| Param | Original file | Final file |
|---|---|---|
| Filename | modeM0/AS1P01_889T01_9000000138_00878cztM0_level2.evt | modeM0/AS1P01_889T01_9000000138_00878cztM0_level2_quad_clean.evt |
| Size (bytes) | 277,220,160 | 30,142,080 |
| Size | 264.4 MB | 28.7 MB |
| Events in quadrant A | 2,132,402 | 193,393 |
| Events in quadrant B | 2,287,956 | 192,194 |
| Events in quadrant C | 1,945,609 | 189,331 |
| Events in quadrant D | 1,890,497 | 188,926 |
| Mode SS | |||
|---|---|---|---|
| Quadrant | BADHDUFLAG | Total packets | Discarded packets |
| A | 0 | 42 | 0 |
| B | 0 | 42 | 0 |
| C | 0 | 42 | 0 |
| D | 0 | 42 | 0 |
| Mode M0 | |||
|---|---|---|---|
| Quadrant | BADHDUFLAG | Total packets | Discarded packets |
| A | 0 | 7801 | 0 |
| B | 0 | 8235 | 0 |
| C | 0 | 7215 | 0 |
| D | 0 | 7101 | 0 |
| Quadrant | Total seconds | Saturated seconds | Saturation percentage |
|---|---|---|---|
| A | 2041 | 0 | 0.000000% |
| B | 2041 | 1 | 0.048996% |
| C | 2041 | 0 | 0.000000% |
| D | 2041 | 2 | 0.097991% |
Noise dominated data is calculated using 1-second bins in cleaned event files. If a bin has >2000 counts, and if more than 50% of those come from <1% of pixels, then it is considered to be noise-dominated and hence unusable.
| Quadrant | # 1 sec bins | Bins with >0 counts | Bins with >2000 counts | High rate bins dominated by noise | Noise dominated (total time) | Noise dominated (detector-on time) | Marked lightcurve |
|---|---|---|---|---|---|---|---|
| A | 2041 | 2041 | 12 | 12 | 0.59% | 0.59% | 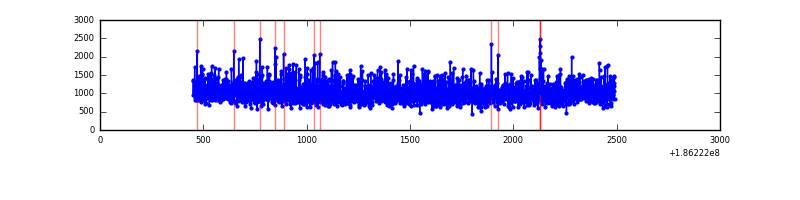 |
| B | 2041 | 2041 | 16 | 16 | 0.78% | 0.78% | 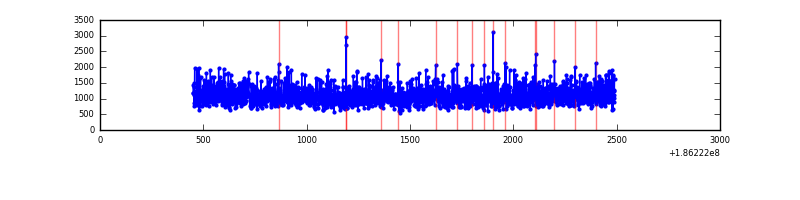 |
| C | 2041 | 2041 | 4 | 4 | 0.20% | 0.20% | 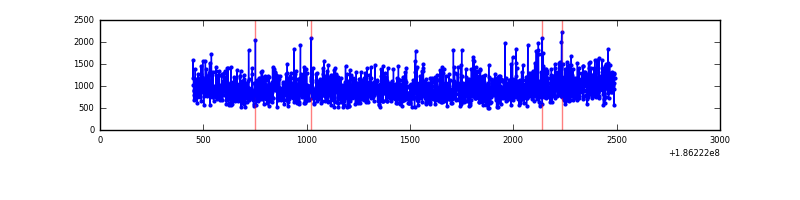 |
| D | 2041 | 2041 | 8 | 8 | 0.39% | 0.39% | 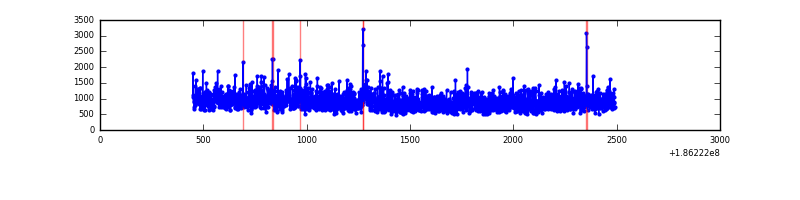 |
Top three noisy pixels from each quadrant. If the there are fewer than three noisy pixels in the level2.evt file, extra rows are filled as -1
| Pixel properties | Quadrant properties | ||||||
|---|---|---|---|---|---|---|---|
| Quadrant | DetID | PixID | Counts | Sigma | Mean | Median | Sigma |
| A | 0 | 117 | 9228 | 64.61 | 551 | 558 | 134.2 |
| A | 10 | 133 | 6097 | 41.28 | 551 | 558 | 134.2 |
| A | 11 | 79 | 2434 | 13.98 | 551 | 558 | 134.2 |
| B | 0 | 220 | 53405 | 378.46 | 579 | 583 | 139.6 |
| B | 8 | 38 | 4803 | 30.24 | 579 | 583 | 139.6 |
| B | 5 | 200 | 4476 | 27.89 | 579 | 583 | 139.6 |
| C | 3 | 111 | 9413 | 65.17 | 489 | 506 | 136.7 |
| C | 3 | 79 | 9057 | 62.57 | 489 | 506 | 136.7 |
| C | 8 | 208 | 6200 | 41.66 | 489 | 506 | 136.7 |
| D | 1 | 4 | 24214 | 162.16 | 475 | 492 | 146.3 |
| D | 8 | 144 | 15874 | 105.15 | 475 | 492 | 146.3 |
| D | 2 | 16 | 14706 | 97.16 | 475 | 492 | 146.3 |
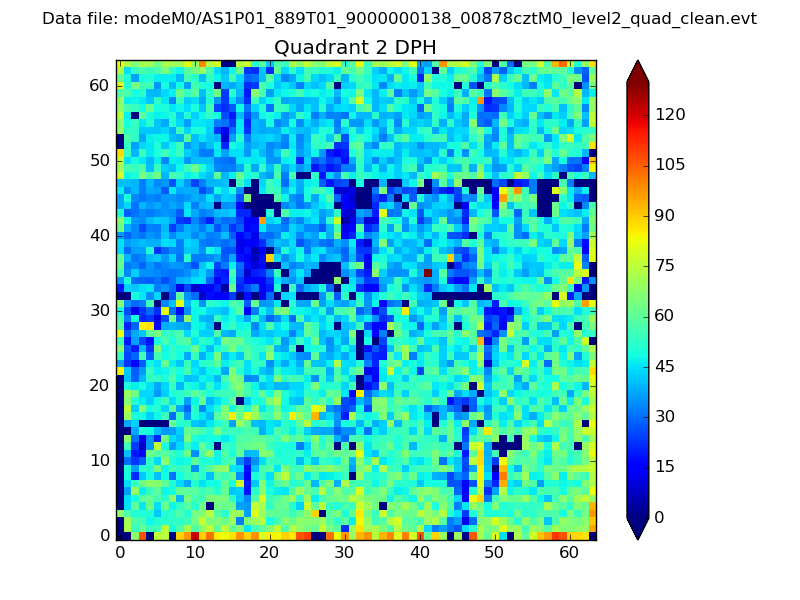
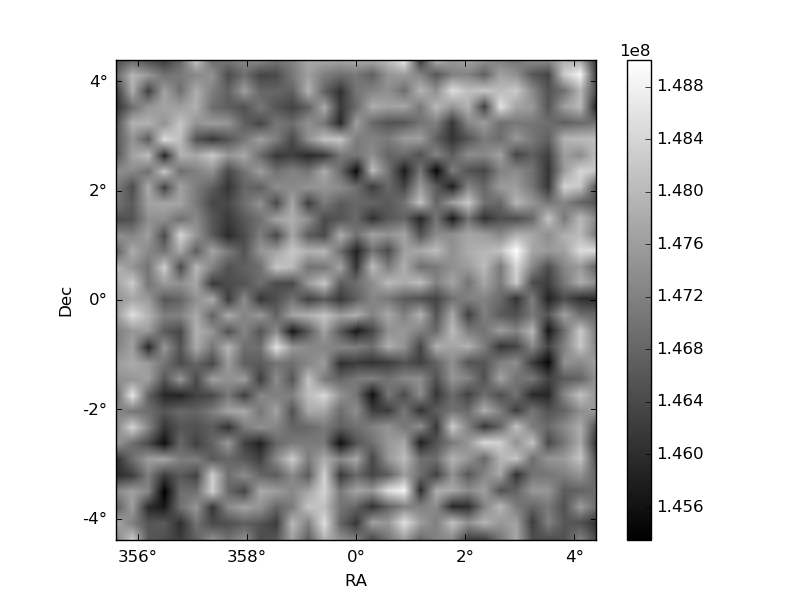
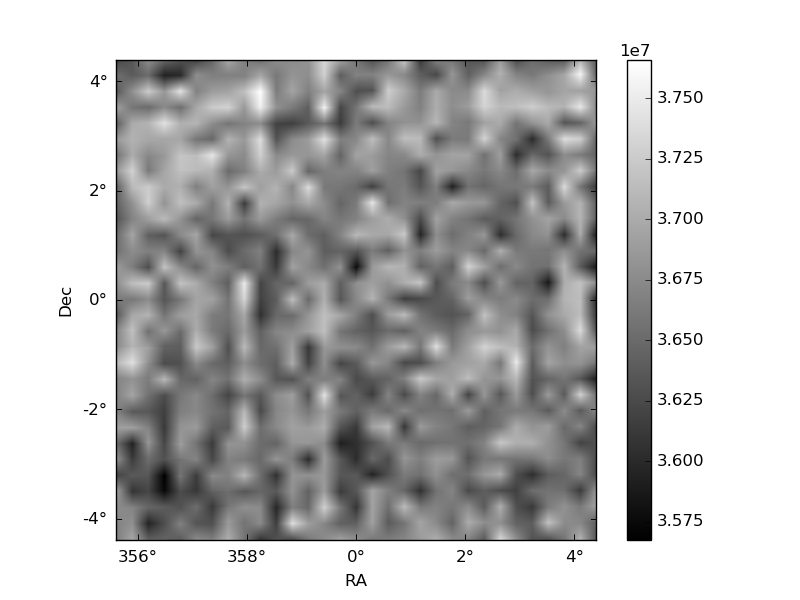
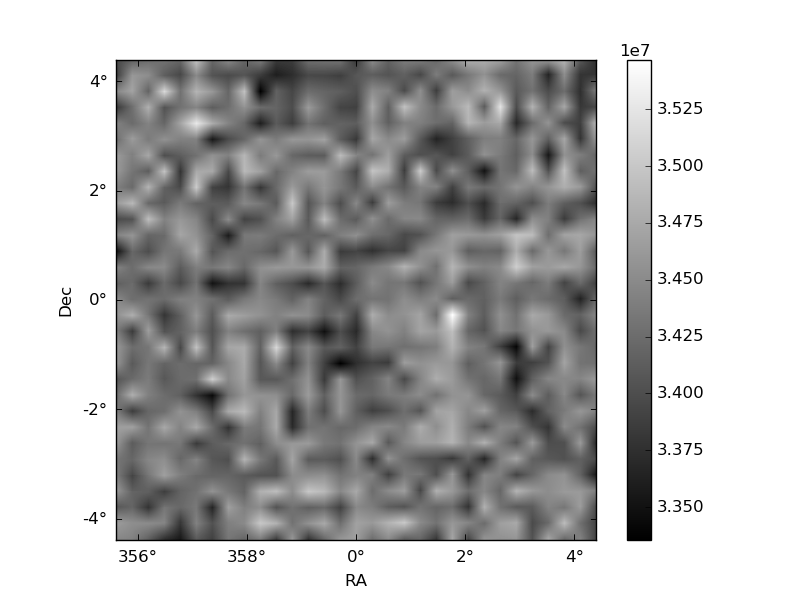
Histogram calculated using DETX and DETY for each event in the final _common_clean file
| Quadrant A | 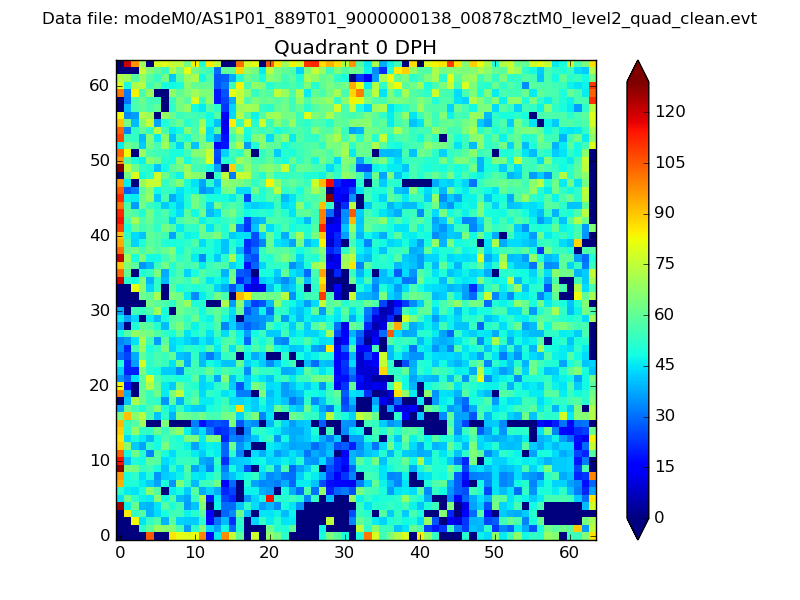 |
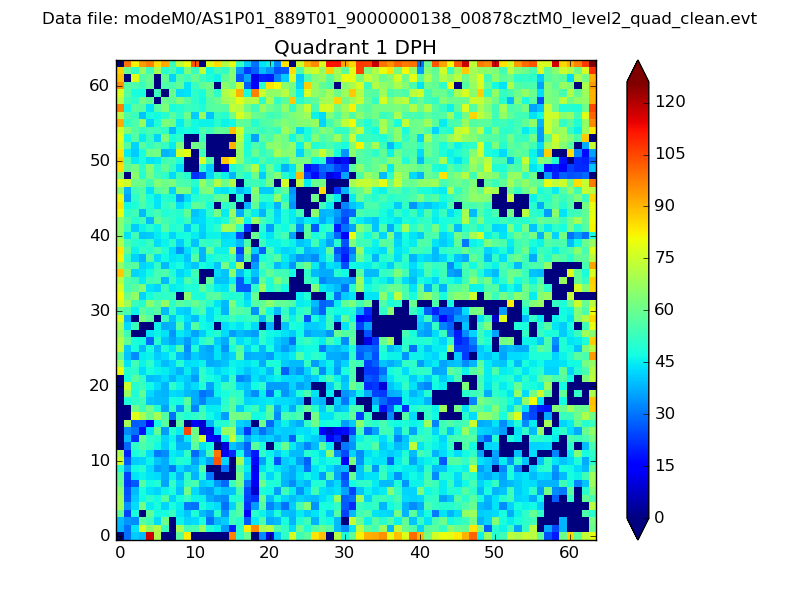 |
Quadrant B |
|---|---|---|---|
| Quadrant D | 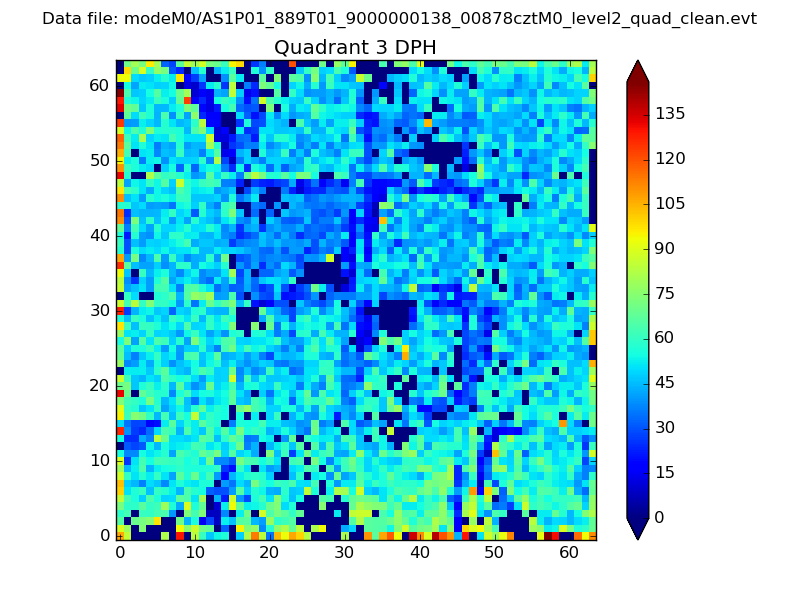 |
 |
Quadrant C |
| Plot type | Count rate plots | Images |
|---|---|---|
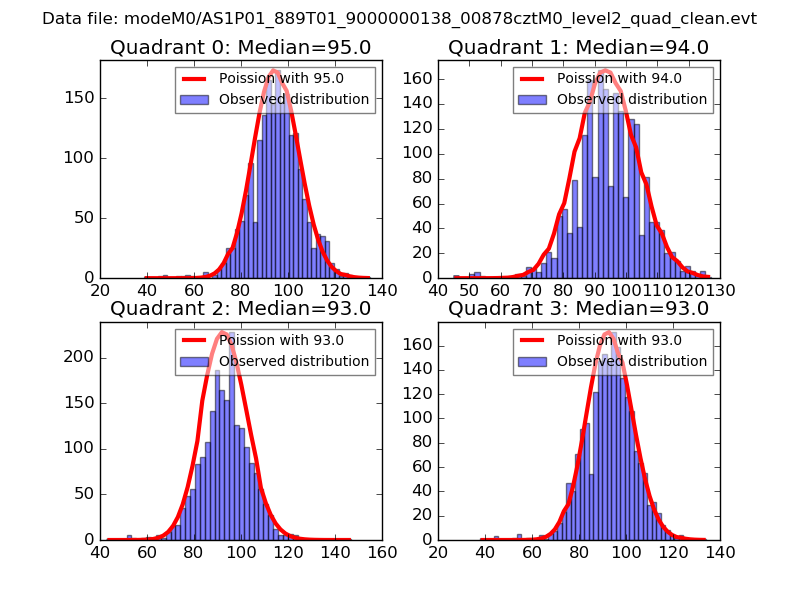
| Comparison with Poisson distribution Blue bars denote a histogram of data divided into 1 sec bins. Red curve is a Poisson curve with rate = median count rate of data. |
 |
 |
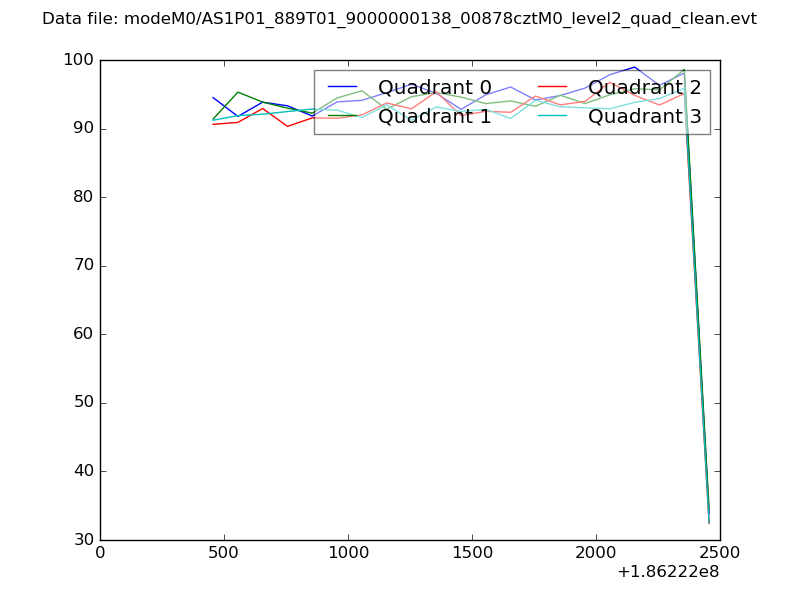
| Quadrant-wise count rates Data is divided into 100 sec bins |
 |
|
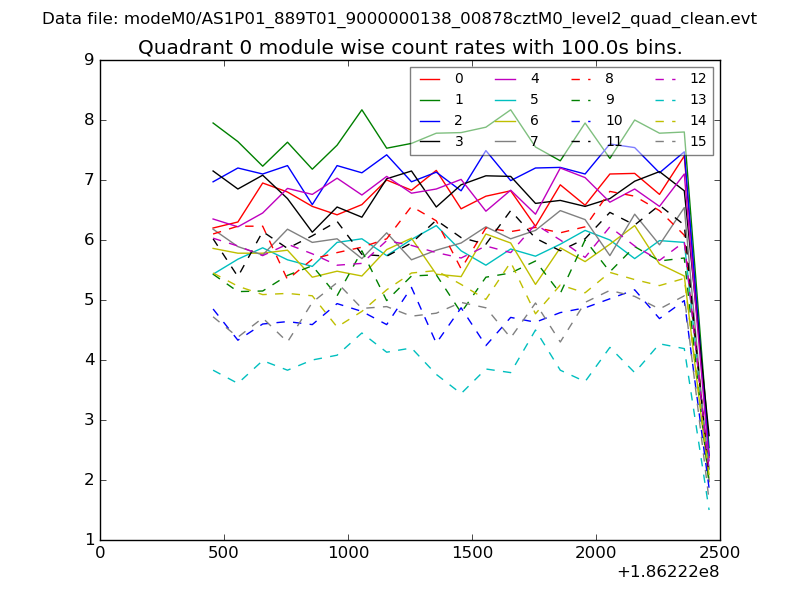
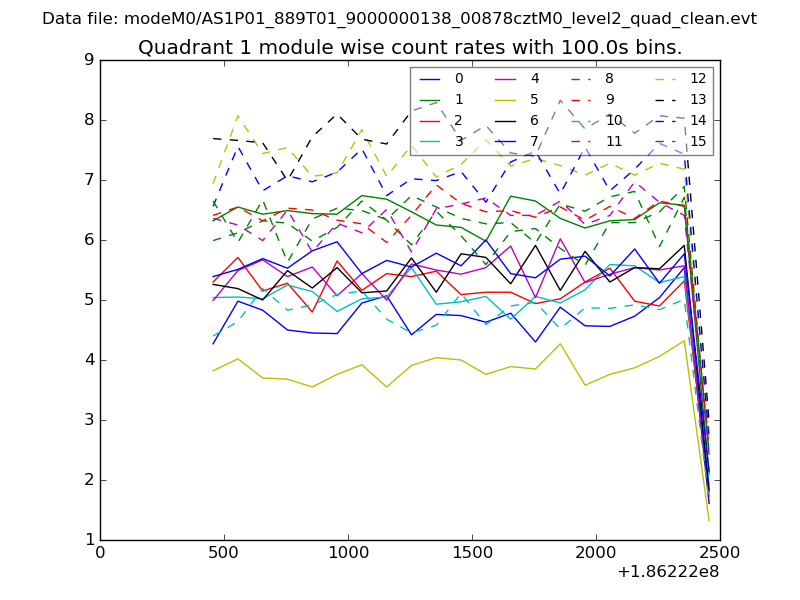
| Module-wise count rates for Quadrant A Data is divided into 100 sec bins |
 |
 |
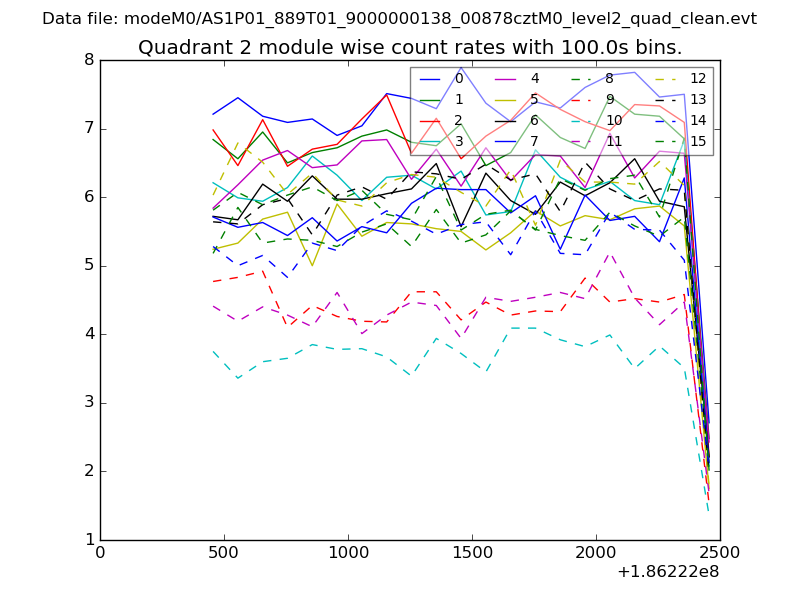
| Module-wise count rates for Quadrant B Data is divided into 100 sec bins |
 |
 |
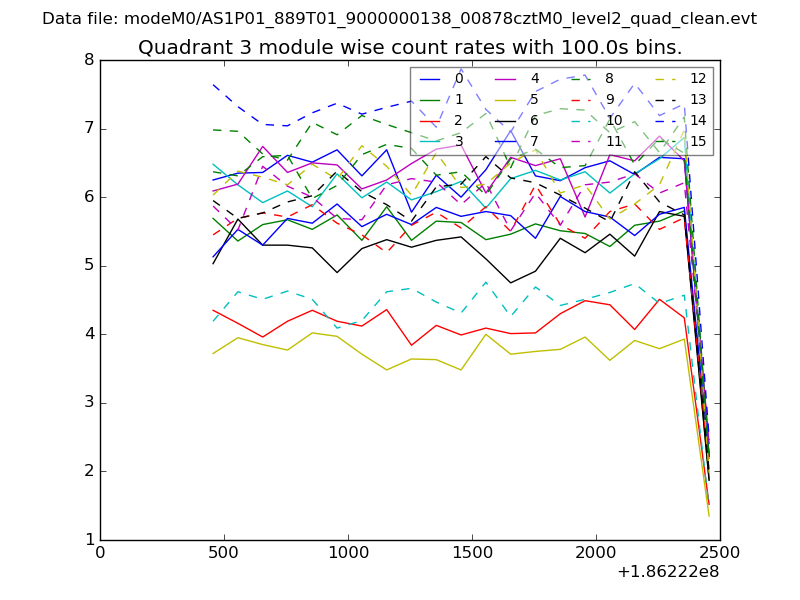
| Module-wise count rates for Quadrant C Data is divided into 100 sec bins |
 |
 |
| Module-wise count rates for Quadrant D Data is divided into 100 sec bins |
 |
 |
| Parameter | Plot |
|---|---|
| CZT HV Monitor | 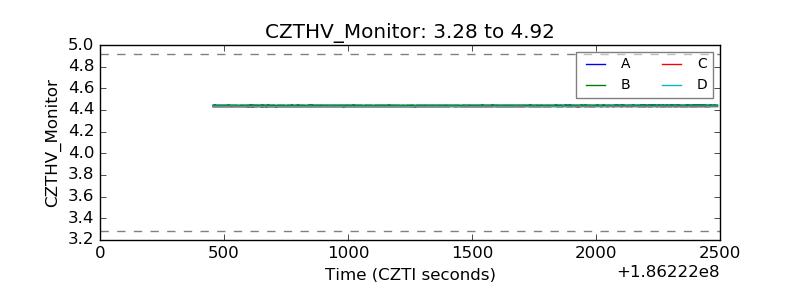 |
| D_VDD | 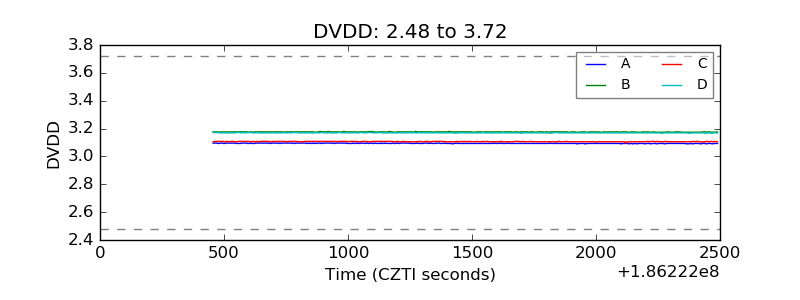 |
| Temperature 1 | 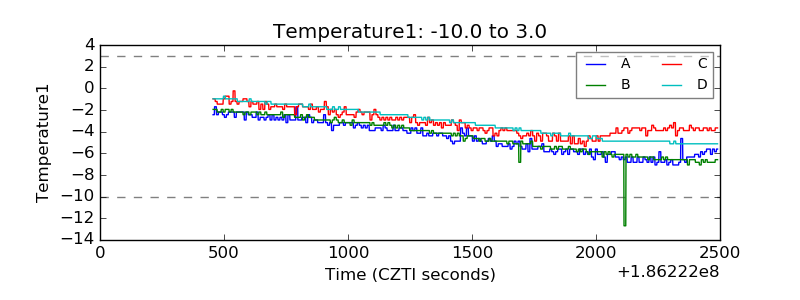 |
| Veto HV Monitor | 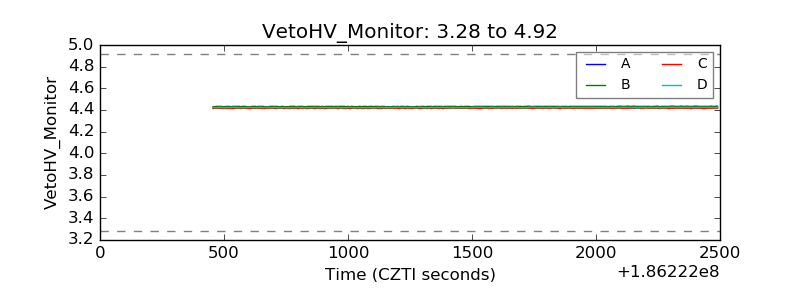 |
| Veto LLD | 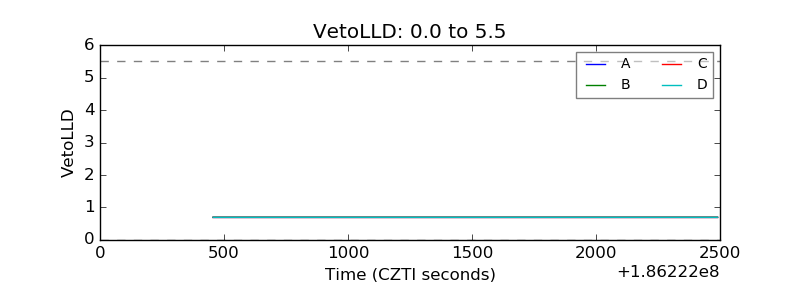 |
| Alpha Counter | 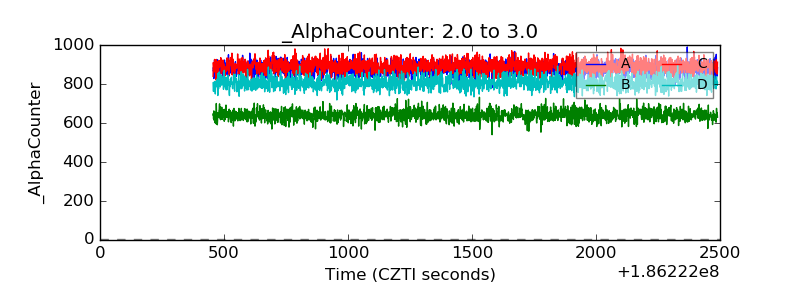 |
| _CPM_Rate | 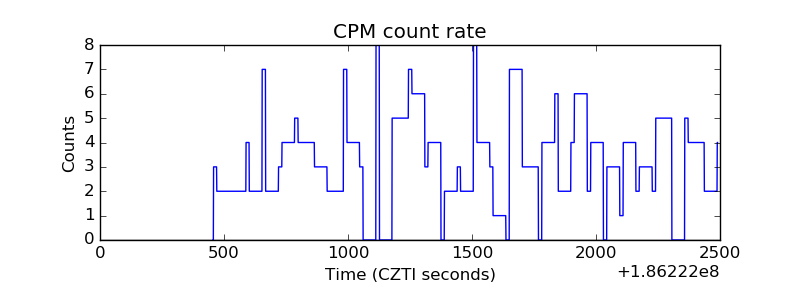 |
| CZT Counter | 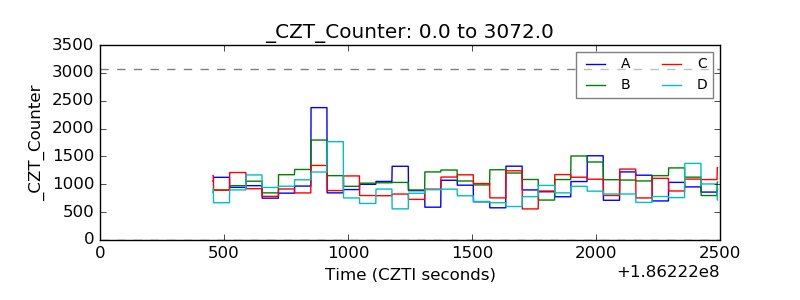 |
| +2.5 Volts monitor |  |
| +5 Volts monitor |  |
| _ROLL_ROT | 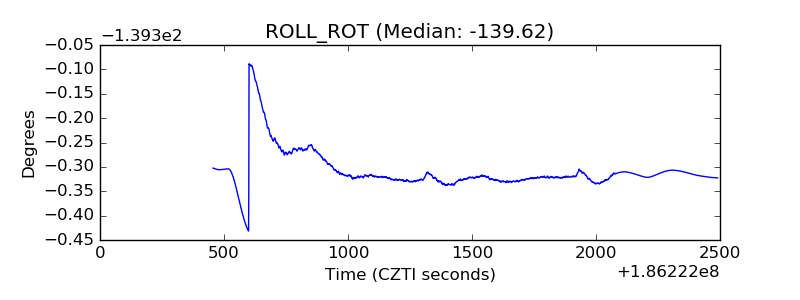 |
| _Roll_DEC | 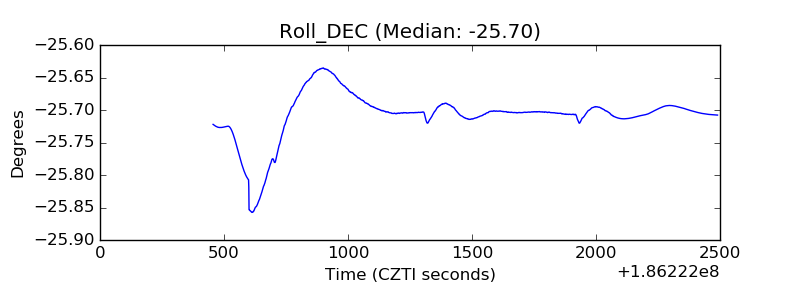 |
| _Roll_RA | 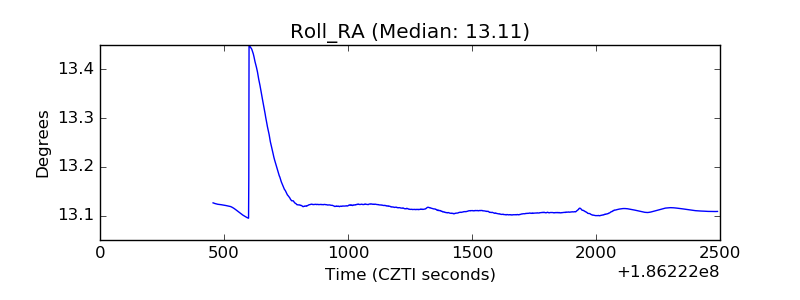 |
| Veto Counter | 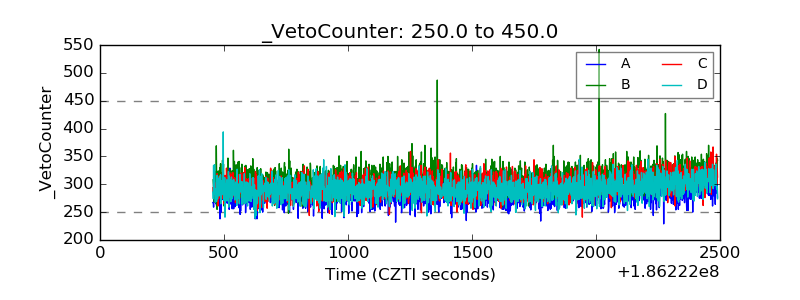 |