| Param | Original file | Final file |
|---|---|---|
| Filename | modeM0/AS1P01_889T01_9000000146cztM0_level2.fits | modeM0/AS1P01_889T01_9000000146cztM0_level2_quad_clean.evt |
| Size (bytes) | 16,231,680 | 12,608,640 |
| Size | 15.5 MB | 12.0 MB |
| Events in quadrant A | 91,024 | 61,618 |
| Events in quadrant B | 88,038 | 60,042 |
| Events in quadrant C | 87,774 | 58,035 |
| Events in quadrant D | 76,328 | 52,480 |
| Mode SS | |||
|---|---|---|---|
| Quadrant | BADHDUFLAG | Total packets | Discarded packets |
| A | 0 | 42 | 0 |
| B | 0 | 42 | 0 |
| C | 0 | 42 | 0 |
| D | 0 | 42 | 0 |
| Mode M0 | |||
|---|---|---|---|
| Quadrant | BADHDUFLAG | Total packets | Discarded packets |
| A | 0 | 7555 | 0 |
| B | 0 | 9227 | 0 |
| C | 0 | 7705 | 0 |
| D | 0 | 7748 | 0 |
| Quadrant | Total seconds | Saturated seconds | Saturation percentage |
|---|---|---|---|
| A | 2044 | 1 | 0.048924% |
| B | 2044 | 56 | 2.739726% |
| C | 2044 | 0 | 0.000000% |
| D | 2044 | 27 | 1.320939% |
Noise dominated data is calculated using 1-second bins in cleaned event files. If a bin has >2000 counts, and if more than 50% of those come from <1% of pixels, then it is considered to be noise-dominated and hence unusable.
| Quadrant | # 1 sec bins | Bins with >0 counts | Bins with >2000 counts | High rate bins dominated by noise | Noise dominated (total time) | Noise dominated (detector-on time) | Marked lightcurve |
|---|---|---|---|---|---|---|---|
| A | 2043 | 2043 | 0 | 0 | 0.00% | 0.00% |  |
| B | 2043 | 2043 | 0 | 0 | 0.00% | 0.00% |  |
| C | 2043 | 2043 | 0 | 0 | 0.00% | 0.00% |  |
| D | 2043 | 2043 | 0 | 0 | 0.00% | 0.00% |  |
Top three noisy pixels from each quadrant. If the there are fewer than three noisy pixels in the level2.evt file, extra rows are filled as -1
| Pixel properties | Quadrant properties | ||||||
|---|---|---|---|---|---|---|---|
| Quadrant | DetID | PixID | Counts | Sigma | Mean | Median | Sigma |
| A | 0 | 29 | 90 | 8.93 | 23 | 22 | 7.6 |
| A | 7 | 110 | 88 | 8.67 | 23 | 22 | 7.6 |
| A | 0 | 28 | 81 | 7.75 | 23 | 22 | 7.6 |
| B | 2 | 9 | 71 | 7.56 | 23 | 22 | 6.5 |
| B | 2 | 18 | 70 | 7.41 | 23 | 22 | 6.5 |
| B | 10 | 225 | 63 | 6.33 | 23 | 22 | 6.5 |
| C | 3 | 236 | 73 | 6.93 | 23 | 21 | 7.5 |
| C | 2 | 191 | 68 | 6.27 | 23 | 21 | 7.5 |
| C | 2 | 207 | 66 | 6.0 | 23 | 21 | 7.5 |
| D | 4 | 160 | 74 | 7.83 | 21 | 19 | 7.0 |
| D | 1 | 19 | 68 | 6.97 | 21 | 19 | 7.0 |
| D | 1 | 3 | 65 | 6.55 | 21 | 19 | 7.0 |
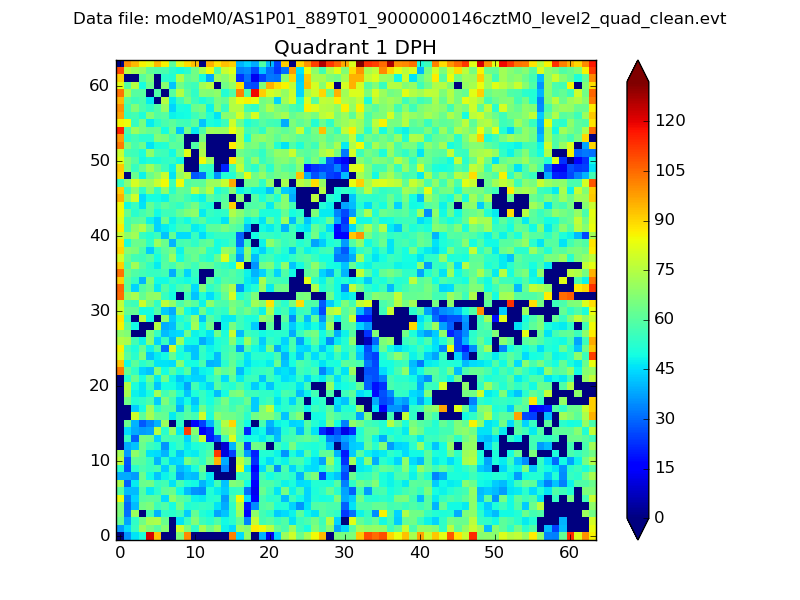
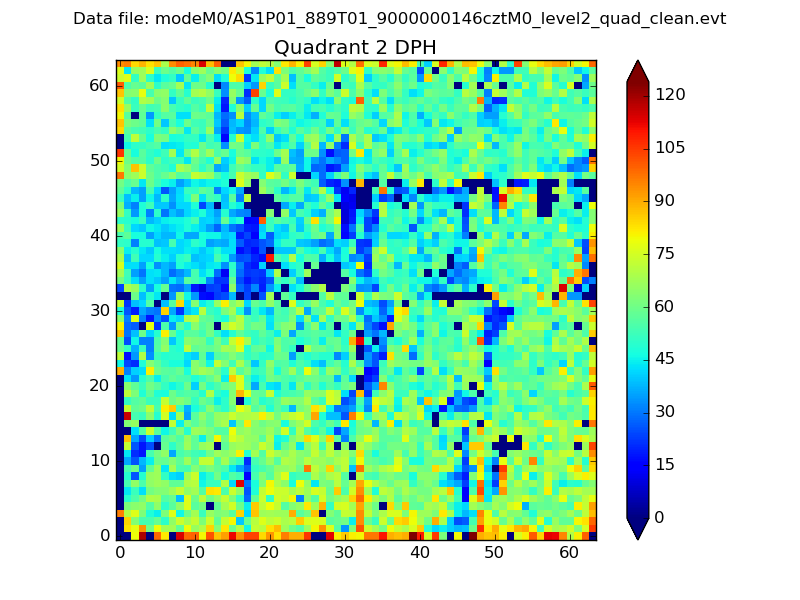
Histogram calculated using DETX and DETY for each event in the final _common_clean file
| Quadrant A |  |
 |
Quadrant B |
|---|---|---|---|
| Quadrant D |  |
 |
Quadrant C |
| Plot type | Count rate plots | Images |
|---|---|---|
| Comparison with Poisson distribution Blue bars denote a histogram of data divided into 1 sec bins. Red curve is a Poisson curve with rate = median count rate of data. |
 |
 |
| Quadrant-wise count rates Data is divided into 100 sec bins |
 |
|
| Module-wise count rates for Quadrant A Data is divided into 100 sec bins |
 |
 |
| Module-wise count rates for Quadrant B Data is divided into 100 sec bins |
 |
 |
| Module-wise count rates for Quadrant C Data is divided into 100 sec bins |
 |
 |
| Module-wise count rates for Quadrant D Data is divided into 100 sec bins |
 |
 |
| Parameter | Plot |
|---|---|
| CZT HV Monitor |  |
| D_VDD | 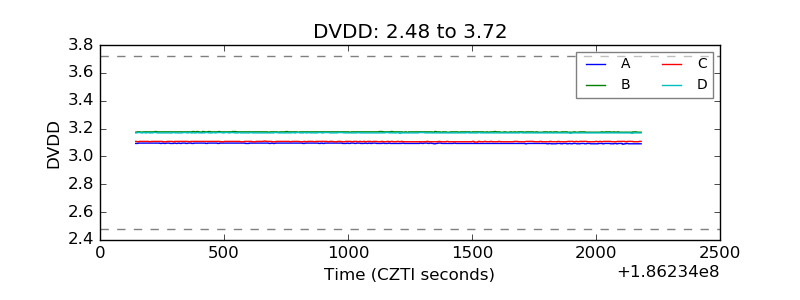 |
| Temperature 1 |  |
| Veto HV Monitor |  |
| Veto LLD |  |
| Alpha Counter |  |
| _CPM_Rate |  |
| CZT Counter |  |
| +2.5 Volts monitor |  |
| +5 Volts monitor |  |
| _ROLL_ROT | 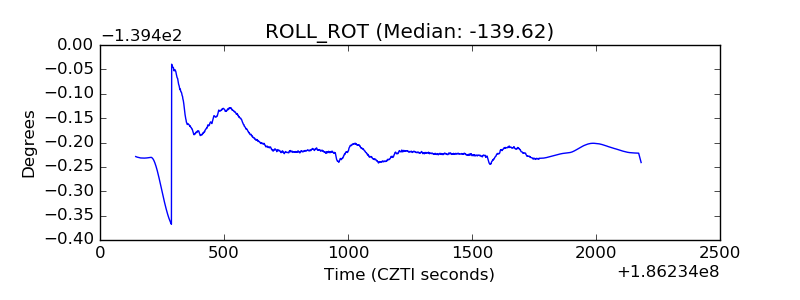 |
| _Roll_DEC |  |
| _Roll_RA |  |
| Veto Counter |  |