| Param | Original file | Final file |
|---|---|---|
| Filename | modeM0/AS1P01_889T01_9000000150_00881cztM0_level2.evt | modeM0/AS1P01_889T01_9000000150_00881cztM0_level2_quad_clean.evt |
| Size (bytes) | 271,791,360 | 31,806,720 |
| Size | 259.2 MB | 30.3 MB |
| Events in quadrant A | 2,044,908 | 206,579 |
| Events in quadrant B | 2,281,461 | 204,271 |
| Events in quadrant C | 1,917,878 | 203,843 |
| Events in quadrant D | 1,847,997 | 199,848 |
| Mode SS | |||
|---|---|---|---|
| Quadrant | BADHDUFLAG | Total packets | Discarded packets |
| A | 0 | 40 | 0 |
| B | 0 | 40 | 0 |
| C | 0 | 40 | 0 |
| D | 0 | 40 | 0 |
| Mode M0 | |||
|---|---|---|---|
| Quadrant | BADHDUFLAG | Total packets | Discarded packets |
| A | 0 | 7533 | 0 |
| B | 0 | 8209 | 0 |
| C | 0 | 7161 | 0 |
| D | 0 | 6983 | 0 |
| Quadrant | Total seconds | Saturated seconds | Saturation percentage |
|---|---|---|---|
| A | 2044 | 0 | 0.000000% |
| B | 2044 | 5 | 0.244618% |
| C | 2044 | 0 | 0.000000% |
| D | 2044 | 3 | 0.146771% |
Noise dominated data is calculated using 1-second bins in cleaned event files. If a bin has >2000 counts, and if more than 50% of those come from <1% of pixels, then it is considered to be noise-dominated and hence unusable.
| Quadrant | # 1 sec bins | Bins with >0 counts | Bins with >2000 counts | High rate bins dominated by noise | Noise dominated (total time) | Noise dominated (detector-on time) | Marked lightcurve |
|---|---|---|---|---|---|---|---|
| A | 2044 | 2044 | 6 | 6 | 0.29% | 0.29% | 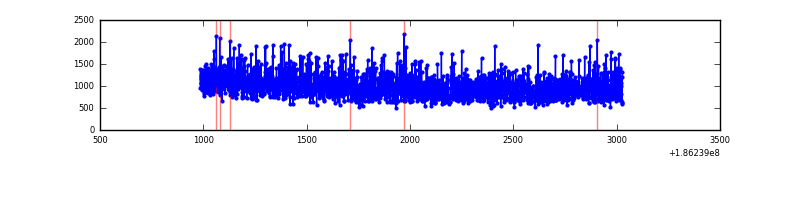 |
| B | 2044 | 2044 | 37 | 37 | 1.81% | 1.81% | 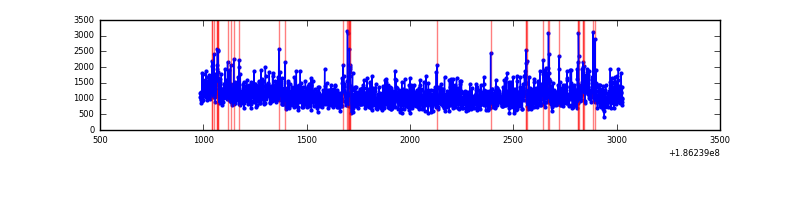 |
| C | 2044 | 2044 | 6 | 6 | 0.29% | 0.29% | 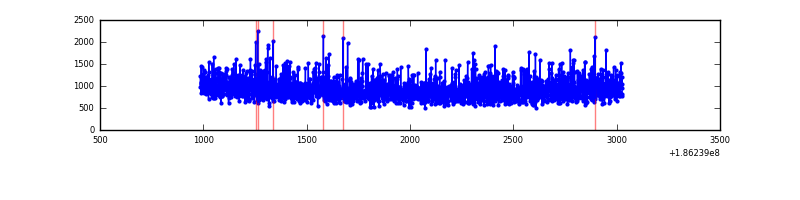 |
| D | 2044 | 2044 | 7 | 7 | 0.34% | 0.34% | 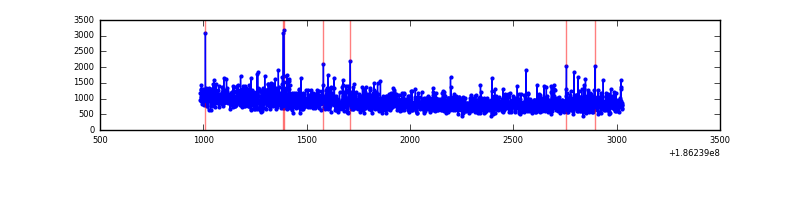 |
Top three noisy pixels from each quadrant. If the there are fewer than three noisy pixels in the level2.evt file, extra rows are filled as -1
| Pixel properties | Quadrant properties | ||||||
|---|---|---|---|---|---|---|---|
| Quadrant | DetID | PixID | Counts | Sigma | Mean | Median | Sigma |
| A | 14 | 79 | 7396 | 53.32 | 531 | 535 | 128.7 |
| A | 14 | 170 | 2025 | 11.58 | 531 | 535 | 128.7 |
| A | 3 | 111 | 1502 | 7.51 | 531 | 535 | 128.7 |
| B | 8 | 38 | 107009 | 829.02 | 551 | 557 | 128.4 |
| B | 0 | 220 | 51720 | 398.44 | 551 | 557 | 128.4 |
| B | 5 | 200 | 11565 | 85.73 | 551 | 557 | 128.4 |
| C | 3 | 79 | 10544 | 75.82 | 479 | 494 | 132.5 |
| C | 3 | 111 | 9983 | 71.59 | 479 | 494 | 132.5 |
| C | 15 | 241 | 5709 | 39.34 | 479 | 494 | 132.5 |
| D | 11 | 131 | 53784 | 374.66 | 462 | 478 | 142.3 |
| D | 1 | 4 | 35946 | 249.29 | 462 | 478 | 142.3 |
| D | 2 | 16 | 13232 | 89.64 | 462 | 478 | 142.3 |
Histogram calculated using DETX and DETY for each event in the final _common_clean file
| Quadrant A | 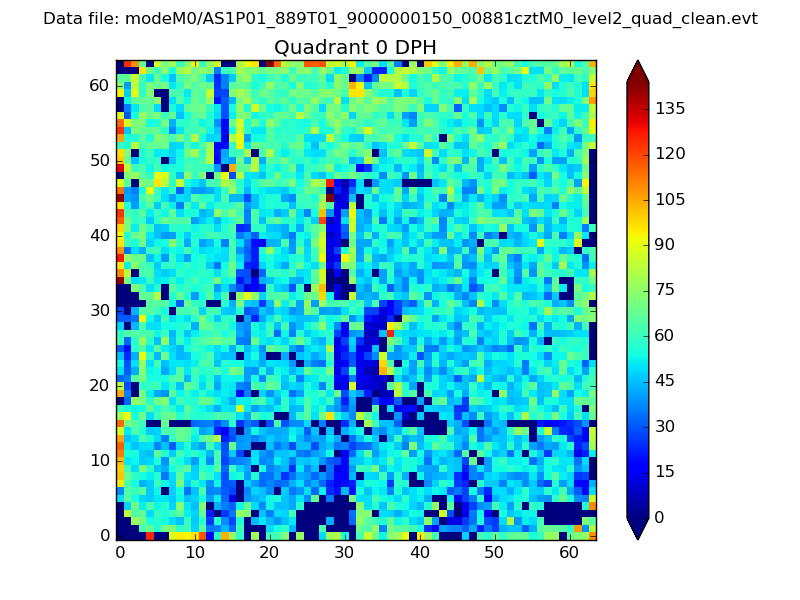 |
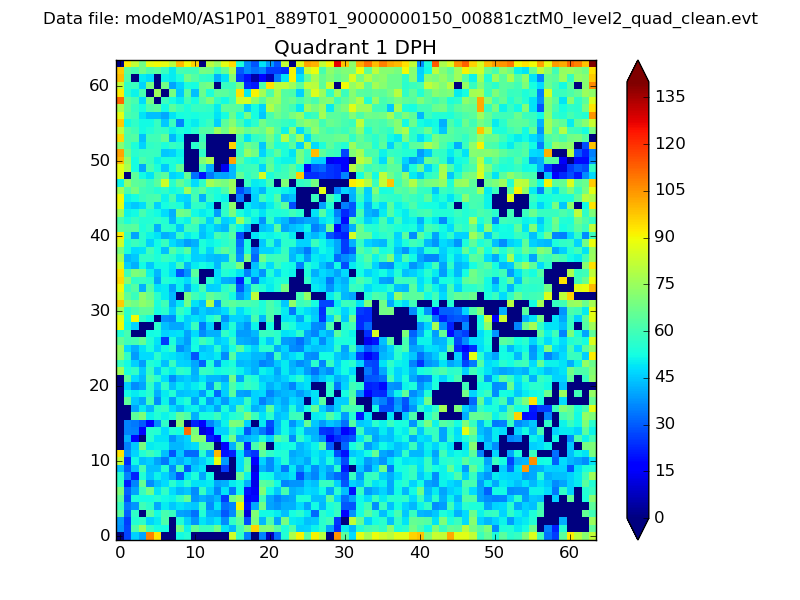 |
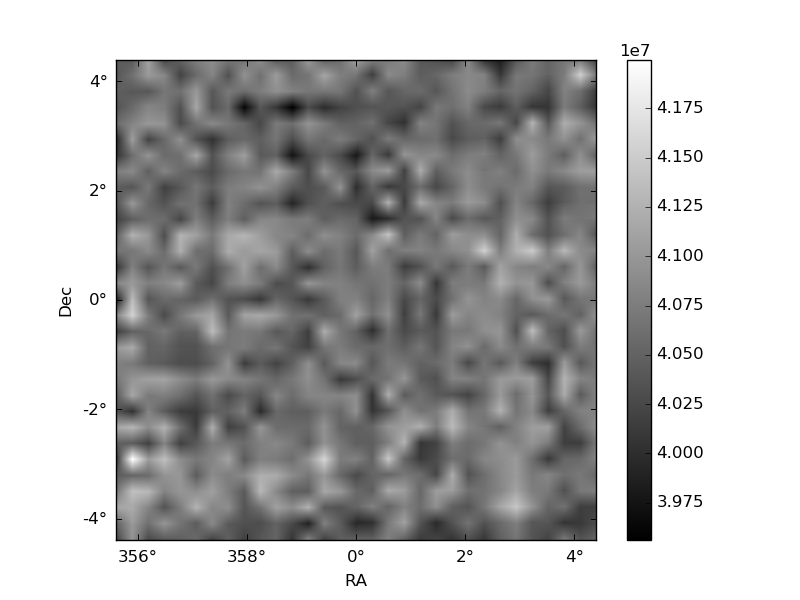
Quadrant B |
|---|---|---|---|
| Quadrant D |  |
 |
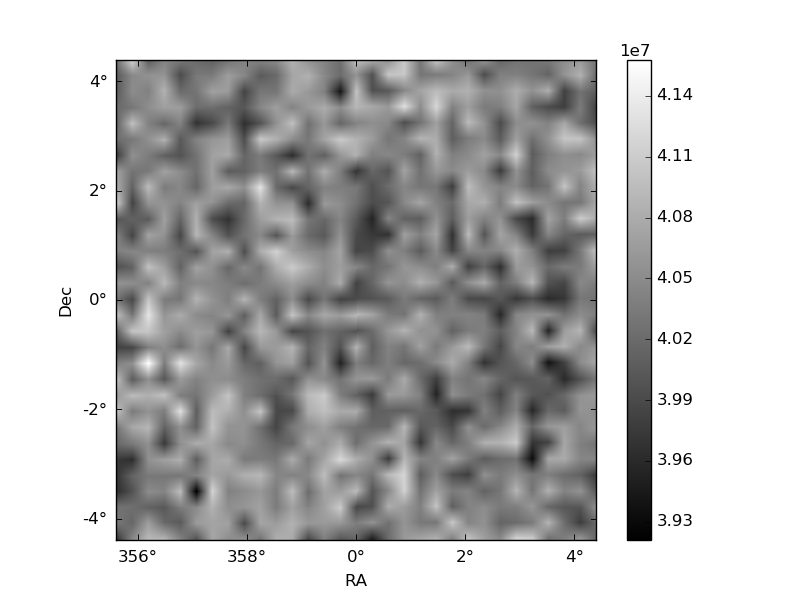
Quadrant C |
| Plot type | Count rate plots | Images |
|---|---|---|
| Comparison with Poisson distribution Blue bars denote a histogram of data divided into 1 sec bins. Red curve is a Poisson curve with rate = median count rate of data. |
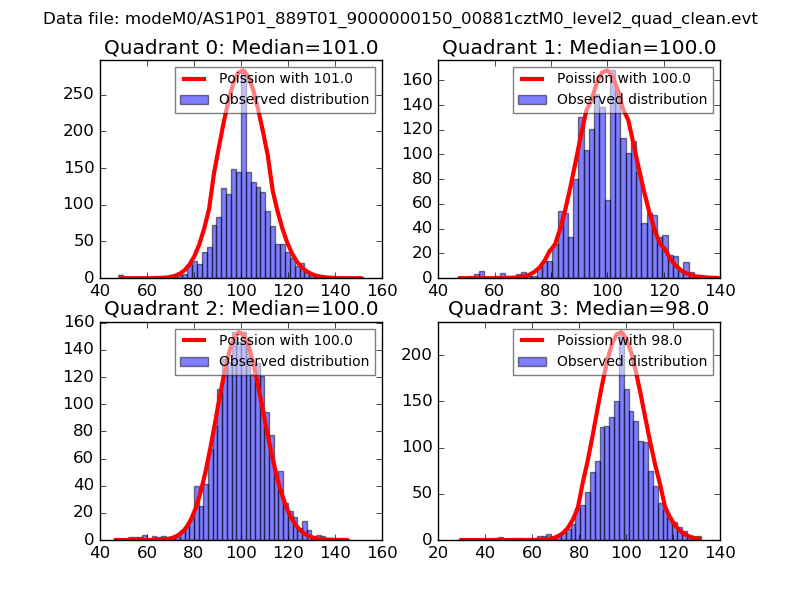 |
 |
| Quadrant-wise count rates Data is divided into 100 sec bins |
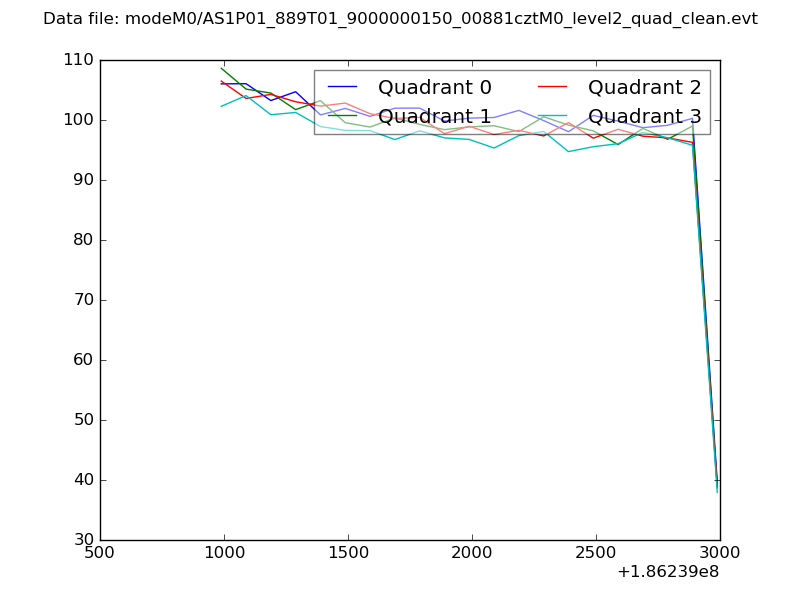 |
|
| Module-wise count rates for Quadrant A Data is divided into 100 sec bins |
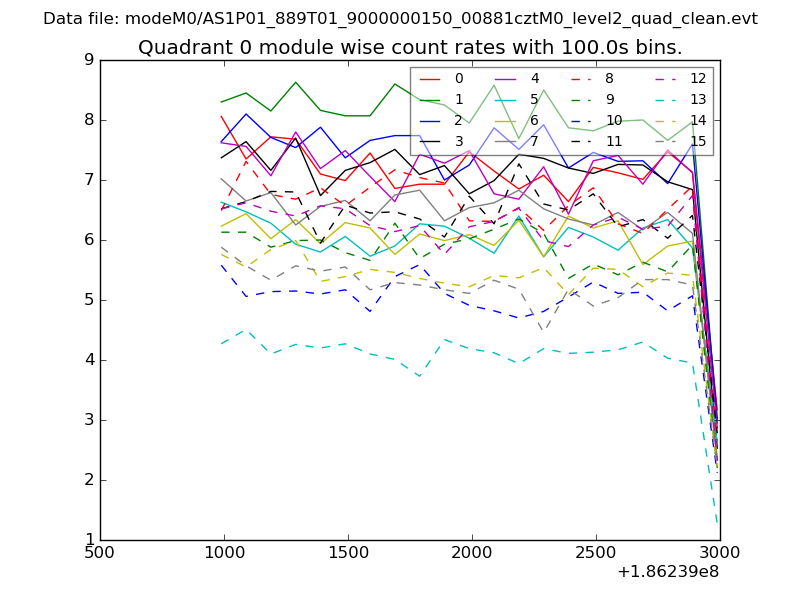 |
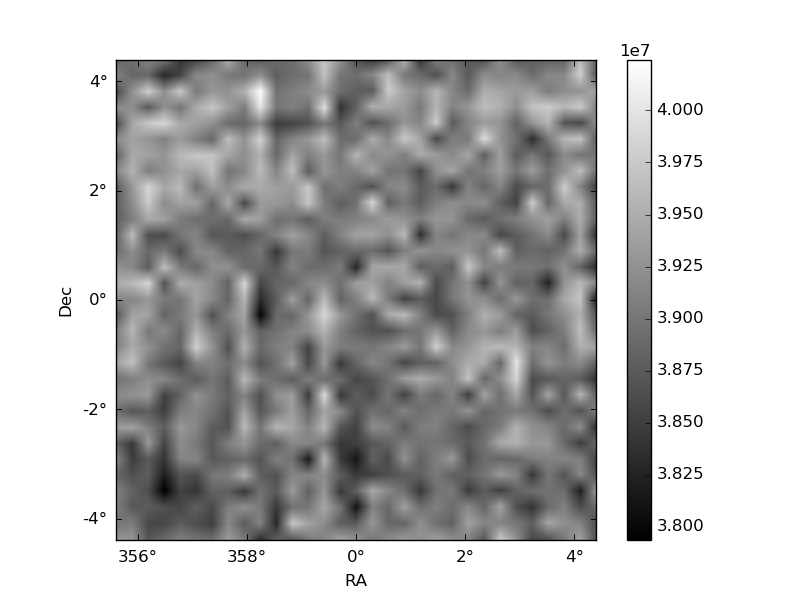 |
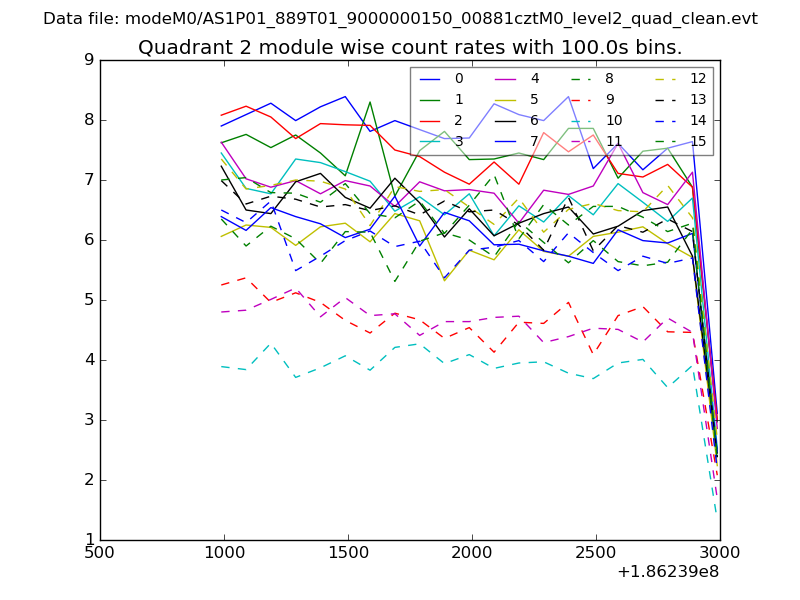
| Module-wise count rates for Quadrant B Data is divided into 100 sec bins |
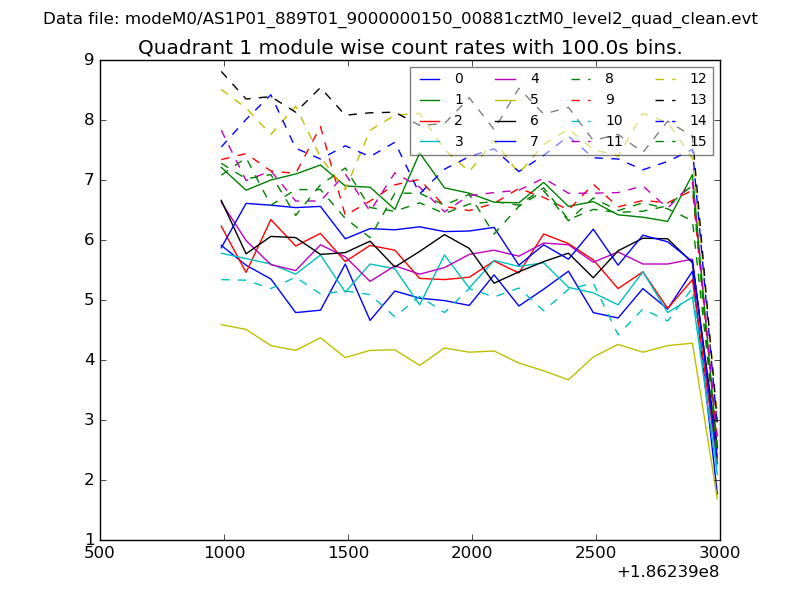 |
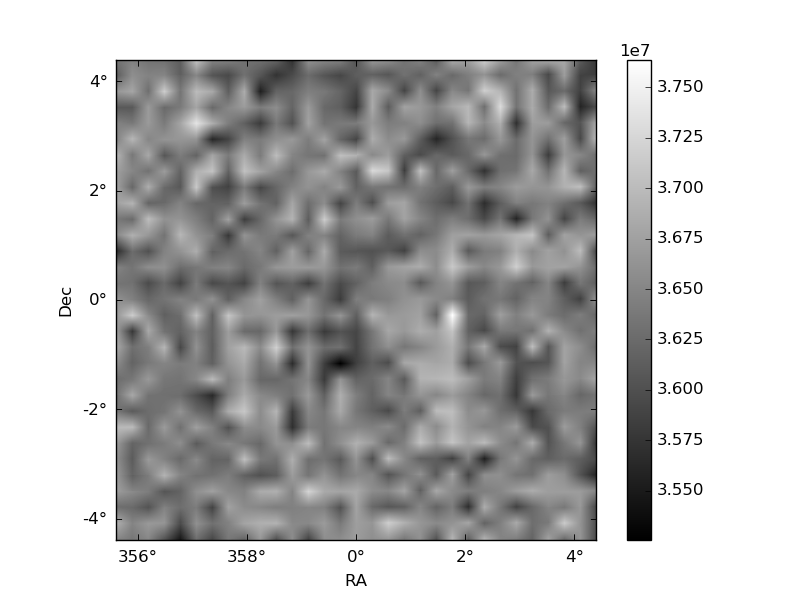 |
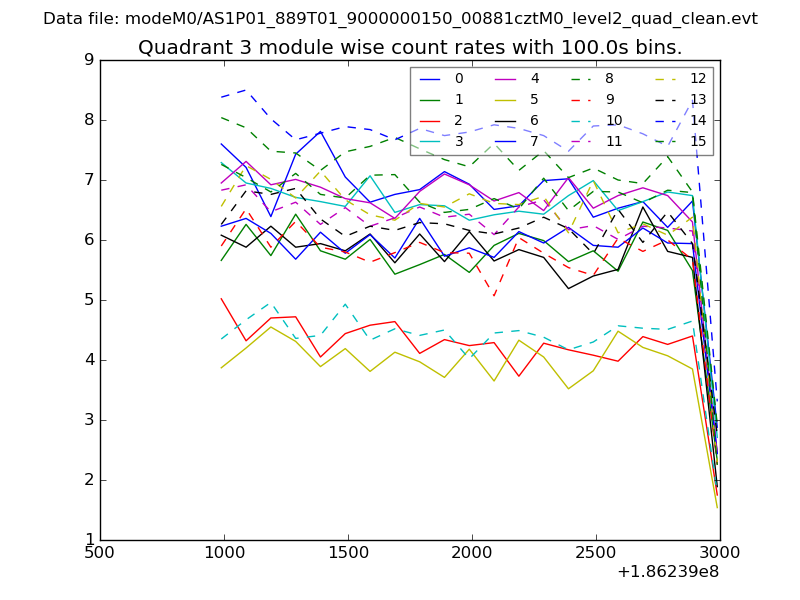
| Module-wise count rates for Quadrant C Data is divided into 100 sec bins |
 |
 |
| Module-wise count rates for Quadrant D Data is divided into 100 sec bins |
 |
 |
| Parameter | Plot |
|---|---|
| CZT HV Monitor | 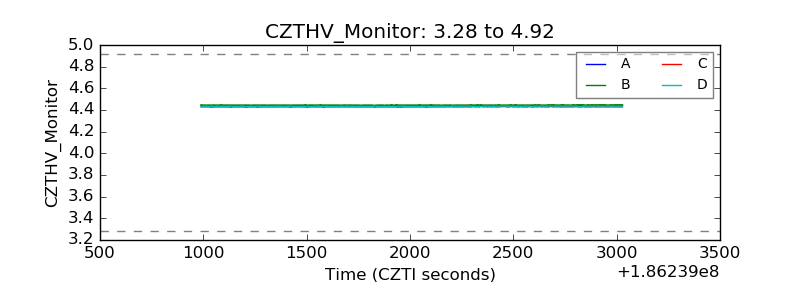 |
| D_VDD | 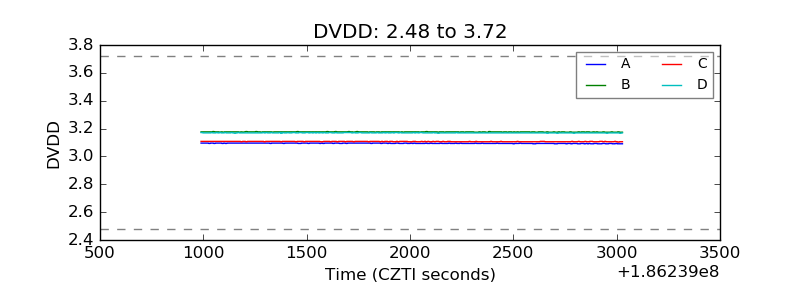 |
| Temperature 1 | 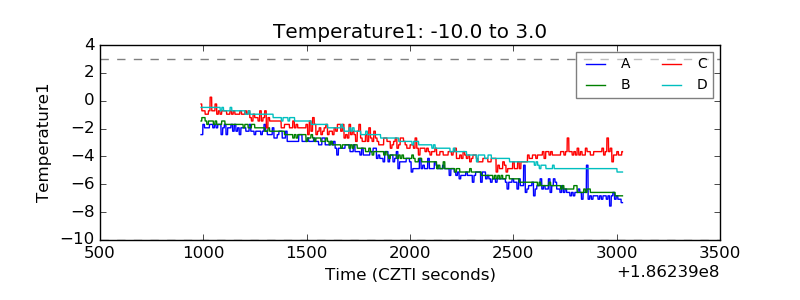 |
| Veto HV Monitor | 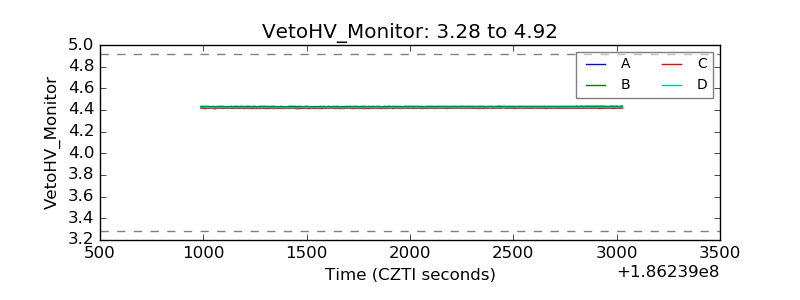 |
| Veto LLD | 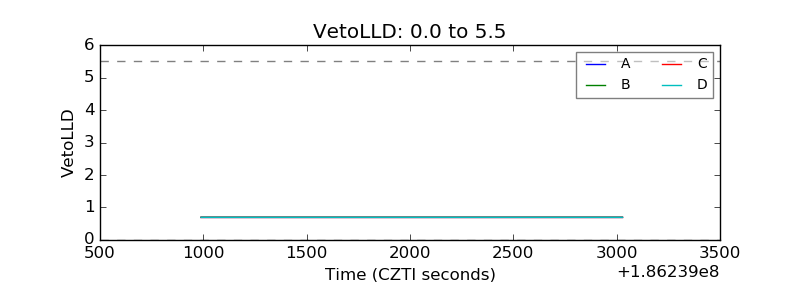 |
| Alpha Counter | 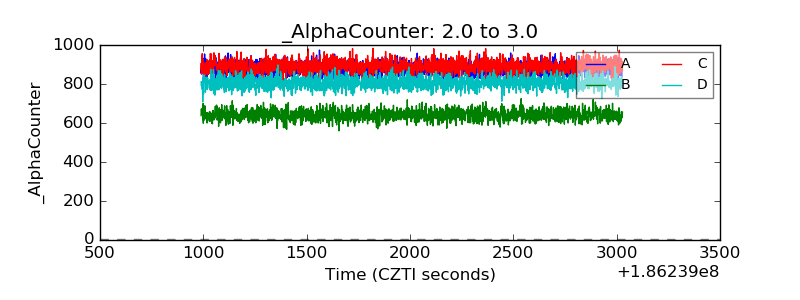 |
| _CPM_Rate | 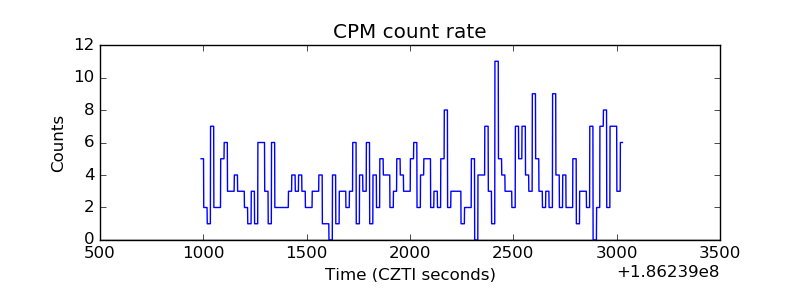 |
| CZT Counter |  |
| +2.5 Volts monitor |  |
| +5 Volts monitor | 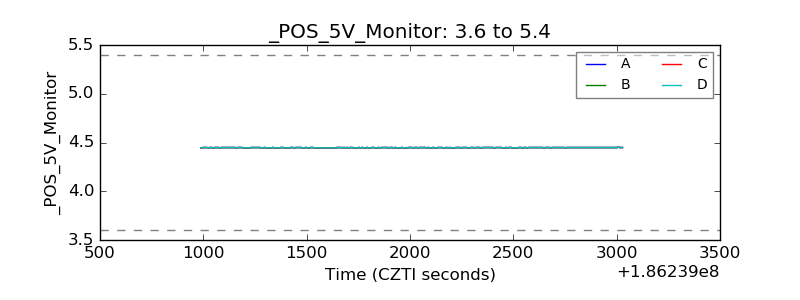 |
| _ROLL_ROT | 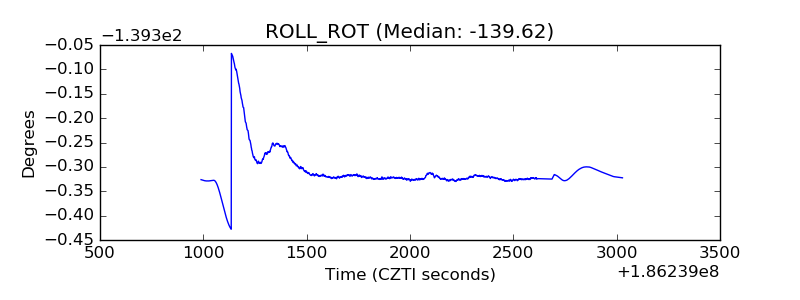 |
| _Roll_DEC | 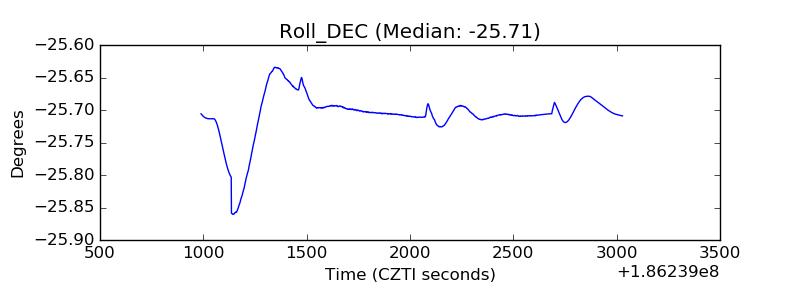 |
| _Roll_RA | 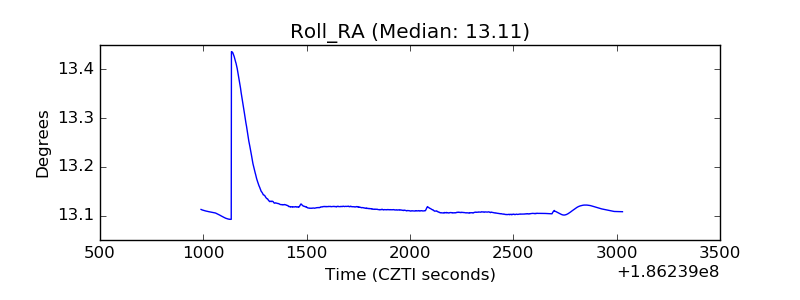 |
| Veto Counter | 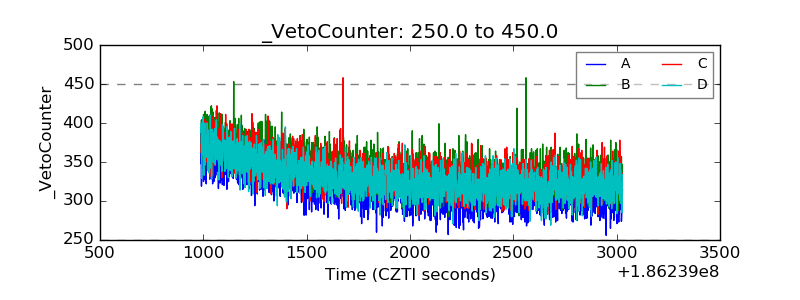 |