| Param | Original file | Final file |
|---|---|---|
| Filename | modeM0/AS1P01_889T01_9000000154cztM0_level2.fits | modeM0/AS1P01_889T01_9000000154cztM0_level2_quad_clean.evt |
| Size (bytes) | 17,752,320 | 13,521,600 |
| Size | 16.9 MB | 12.9 MB |
| Events in quadrant A | 102,528 | 68,032 |
| Events in quadrant B | 98,480 | 65,493 |
| Events in quadrant C | 100,378 | 65,551 |
| Events in quadrant D | 87,702 | 60,580 |
| Mode M0 | |||
|---|---|---|---|
| Quadrant | BADHDUFLAG | Total packets | Discarded packets |
| A | 0 | 7741 | 0 |
| B | 0 | 9342 | 0 |
| C | 0 | 7914 | 0 |
| D | 0 | 7467 | 0 |
| Mode SS | |||
|---|---|---|---|
| Quadrant | BADHDUFLAG | Total packets | Discarded packets |
| A | 0 | 42 | 0 |
| B | 0 | 42 | 0 |
| C | 0 | 42 | 0 |
| D | 0 | 42 | 0 |
| Quadrant | Total seconds | Saturated seconds | Saturation percentage |
|---|---|---|---|
| A | 2045 | 0 | 0.000000% |
| B | 2045 | 68 | 3.325183% |
| C | 2045 | 6 | 0.293399% |
| D | 2045 | 3 | 0.146699% |
Noise dominated data is calculated using 1-second bins in cleaned event files. If a bin has >2000 counts, and if more than 50% of those come from <1% of pixels, then it is considered to be noise-dominated and hence unusable.
| Quadrant | # 1 sec bins | Bins with >0 counts | Bins with >2000 counts | High rate bins dominated by noise | Noise dominated (total time) | Noise dominated (detector-on time) | Marked lightcurve |
|---|---|---|---|---|---|---|---|
| A | 2044 | 2044 | 0 | 0 | 0.00% | 0.00% |  |
| B | 2044 | 2044 | 0 | 0 | 0.00% | 0.00% |  |
| C | 2045 | 2045 | 0 | 0 | 0.00% | 0.00% |  |
| D | 2044 | 2044 | 0 | 0 | 0.00% | 0.00% |  |
Top three noisy pixels from each quadrant. If the there are fewer than three noisy pixels in the level2.evt file, extra rows are filled as -1
| Pixel properties | Quadrant properties | ||||||
|---|---|---|---|---|---|---|---|
| Quadrant | DetID | PixID | Counts | Sigma | Mean | Median | Sigma |
| A | 7 | 110 | 94 | 8.56 | 26 | 25 | 8.1 |
| A | 0 | 29 | 92 | 8.31 | 26 | 25 | 8.1 |
| A | 10 | 252 | 83 | 7.2 | 26 | 25 | 8.1 |
| B | 2 | 9 | 76 | 7.49 | 26 | 25 | 6.8 |
| B | 2 | 8 | 73 | 7.05 | 26 | 25 | 6.8 |
| B | 10 | 233 | 67 | 6.17 | 26 | 25 | 6.8 |
| C | 7 | 233 | 80 | 6.71 | 26 | 25 | 8.2 |
| C | 3 | 202 | 79 | 6.58 | 26 | 25 | 8.2 |
| C | 2 | 191 | 72 | 5.73 | 26 | 25 | 8.2 |
| D | 6 | 44 | 78 | 7.31 | 25 | 23 | 7.5 |
| D | 6 | 51 | 70 | 6.24 | 25 | 23 | 7.5 |
| D | 10 | 189 | 69 | 6.11 | 25 | 23 | 7.5 |
Histogram calculated using DETX and DETY for each event in the final _common_clean file
| Quadrant A | 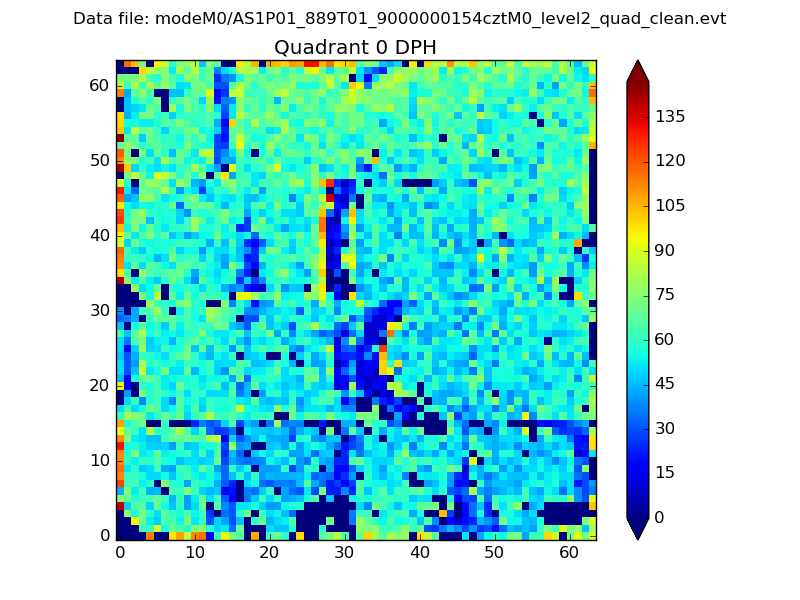 |
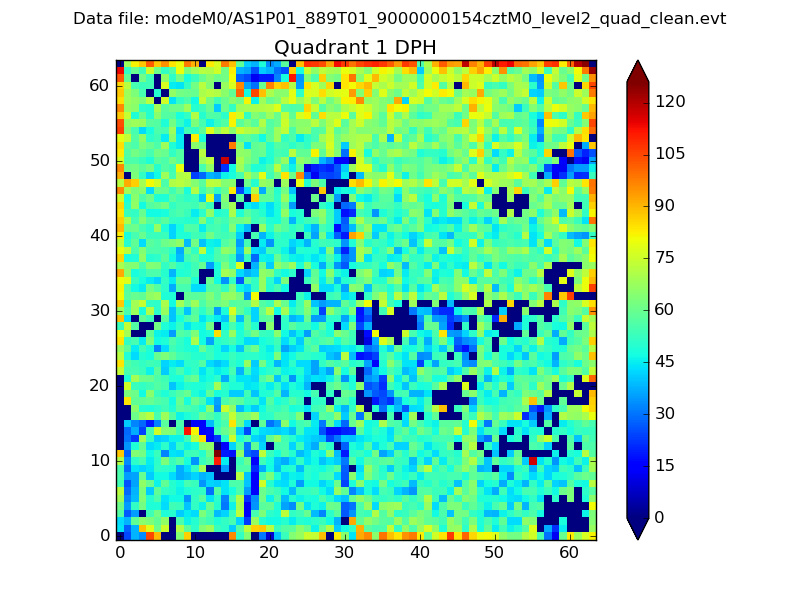 |
Quadrant B |
|---|---|---|---|
| Quadrant D |  |
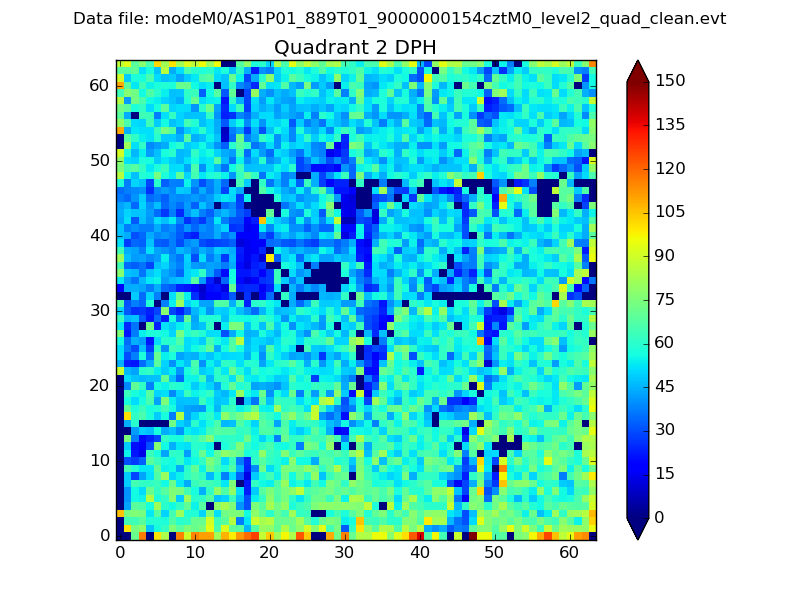 |
Quadrant C |
| Plot type | Count rate plots | Images |
|---|---|---|
| Comparison with Poisson distribution Blue bars denote a histogram of data divided into 1 sec bins. Red curve is a Poisson curve with rate = median count rate of data. |
 |
 |
| Quadrant-wise count rates Data is divided into 100 sec bins |
 |
|
| Module-wise count rates for Quadrant A Data is divided into 100 sec bins |
 |
 |
| Module-wise count rates for Quadrant B Data is divided into 100 sec bins |
 |
 |
| Module-wise count rates for Quadrant C Data is divided into 100 sec bins |
 |
 |
| Module-wise count rates for Quadrant D Data is divided into 100 sec bins |
 |
 |
| Parameter | Plot |
|---|---|
| CZT HV Monitor |  |
| D_VDD |  |
| Temperature 1 |  |
| Veto HV Monitor |  |
| Veto LLD |  |
| Alpha Counter |  |
| _CPM_Rate |  |
| CZT Counter |  |
| +2.5 Volts monitor |  |
| +5 Volts monitor |  |
| _ROLL_ROT |  |
| _Roll_DEC |  |
| _Roll_RA |  |
| Veto Counter |  |