| Param | Original file | Final file |
|---|---|---|
| Filename | modeM0/AS1P01_889T01_9000000154_00882cztM0_level2.evt | modeM0/AS1P01_889T01_9000000154_00882cztM0_level2_quad_clean.evt |
| Size (bytes) | 299,600,640 | 33,200,640 |
| Size | 285.7 MB | 31.7 MB |
| Events in quadrant A | 2,109,290 | 217,831 |
| Events in quadrant B | 2,654,089 | 212,521 |
| Events in quadrant C | 2,162,649 | 214,371 |
| Events in quadrant D | 2,008,382 | 211,500 |
| Mode M0 | |||
|---|---|---|---|
| Quadrant | BADHDUFLAG | Total packets | Discarded packets |
| A | 0 | 7741 | 0 |
| B | 0 | 9342 | 0 |
| C | 0 | 7914 | 0 |
| D | 0 | 7467 | 0 |
| Mode SS | |||
|---|---|---|---|
| Quadrant | BADHDUFLAG | Total packets | Discarded packets |
| A | 0 | 42 | 0 |
| B | 0 | 42 | 0 |
| C | 0 | 42 | 0 |
| D | 0 | 42 | 0 |
| Quadrant | Total seconds | Saturated seconds | Saturation percentage |
|---|---|---|---|
| A | 2045 | 0 | 0.000000% |
| B | 2045 | 68 | 3.325183% |
| C | 2045 | 6 | 0.293399% |
| D | 2045 | 3 | 0.146699% |
Noise dominated data is calculated using 1-second bins in cleaned event files. If a bin has >2000 counts, and if more than 50% of those come from <1% of pixels, then it is considered to be noise-dominated and hence unusable.
| Quadrant | # 1 sec bins | Bins with >0 counts | Bins with >2000 counts | High rate bins dominated by noise | Noise dominated (total time) | Noise dominated (detector-on time) | Marked lightcurve |
|---|---|---|---|---|---|---|---|
| A | 2045 | 2045 | 8 | 8 | 0.39% | 0.39% | 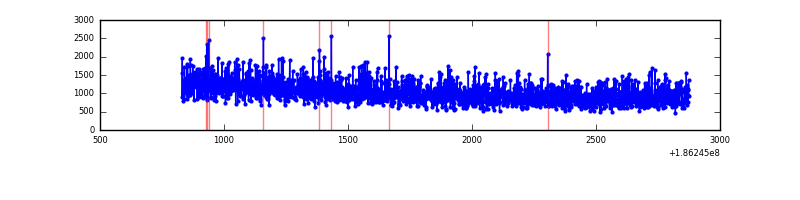 |
| B | 2045 | 2045 | 200 | 200 | 9.78% | 9.78% | 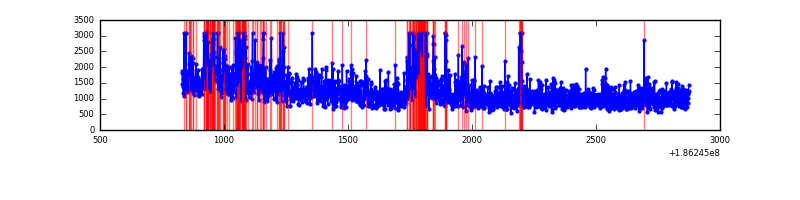 |
| C | 2045 | 2045 | 48 | 48 | 2.35% | 2.35% | 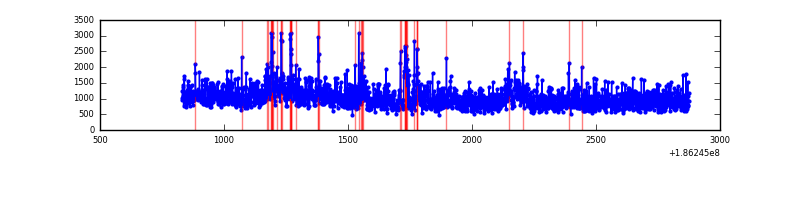 |
| D | 2044 | 2044 | 18 | 18 | 0.88% | 0.88% | 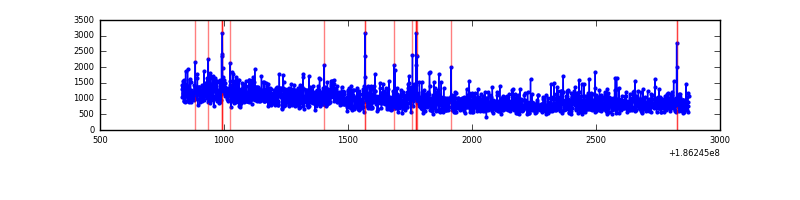 |
Top three noisy pixels from each quadrant. If the there are fewer than three noisy pixels in the level2.evt file, extra rows are filled as -1
| Pixel properties | Quadrant properties | ||||||
|---|---|---|---|---|---|---|---|
| Quadrant | DetID | PixID | Counts | Sigma | Mean | Median | Sigma |
| A | 14 | 170 | 6255 | 42.95 | 546 | 552 | 132.8 |
| A | 14 | 79 | 4321 | 28.38 | 546 | 552 | 132.8 |
| A | 15 | 17 | 3436 | 21.72 | 546 | 552 | 132.8 |
| B | 8 | 38 | 461014 | 3496.58 | 563 | 568 | 131.7 |
| B | 15 | 22 | 11719 | 84.68 | 563 | 568 | 131.7 |
| B | 4 | 200 | 9691 | 69.28 | 563 | 568 | 131.7 |
| C | 8 | 208 | 209552 | 1541.77 | 492 | 508 | 135.6 |
| C | 3 | 111 | 9213 | 64.2 | 492 | 508 | 135.6 |
| C | 3 | 79 | 8824 | 61.33 | 492 | 508 | 135.6 |
| D | 11 | 131 | 76768 | 521.87 | 476 | 490 | 146.2 |
| D | 13 | 170 | 54195 | 367.43 | 476 | 490 | 146.2 |
| D | 2 | 16 | 36532 | 246.59 | 476 | 490 | 146.2 |
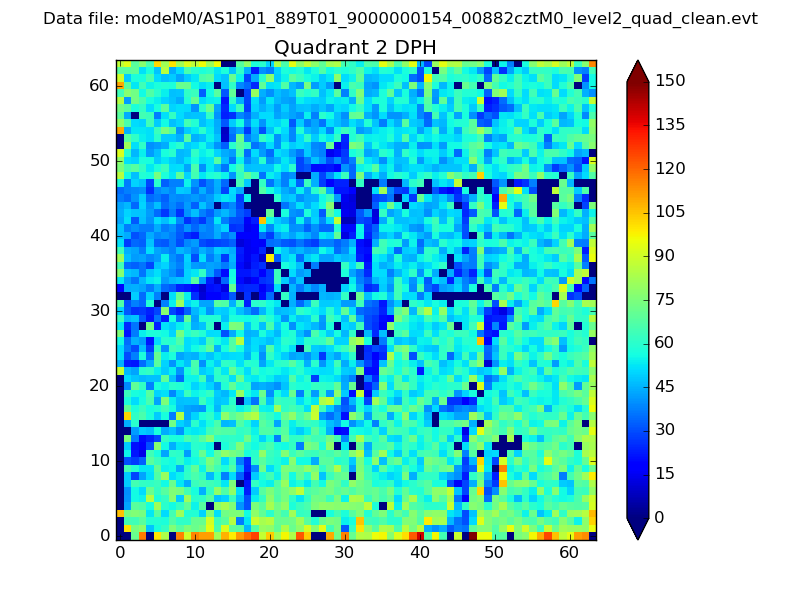
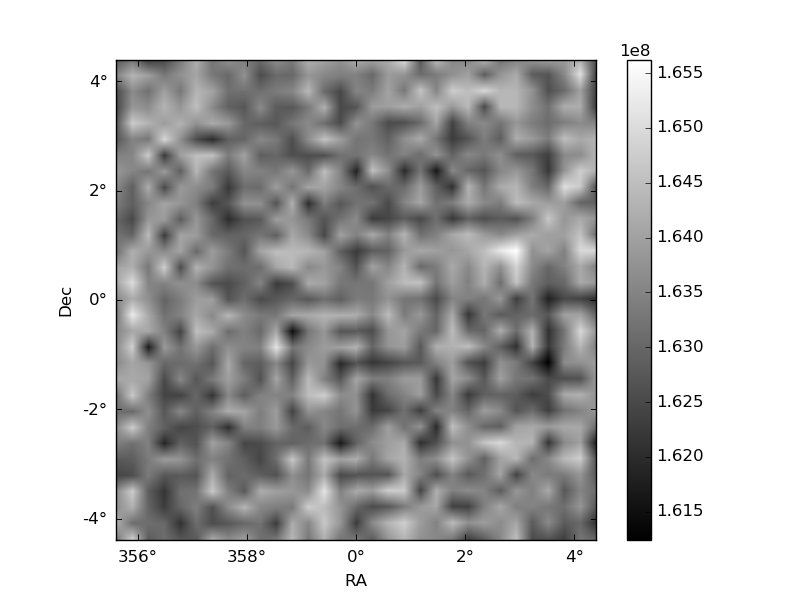
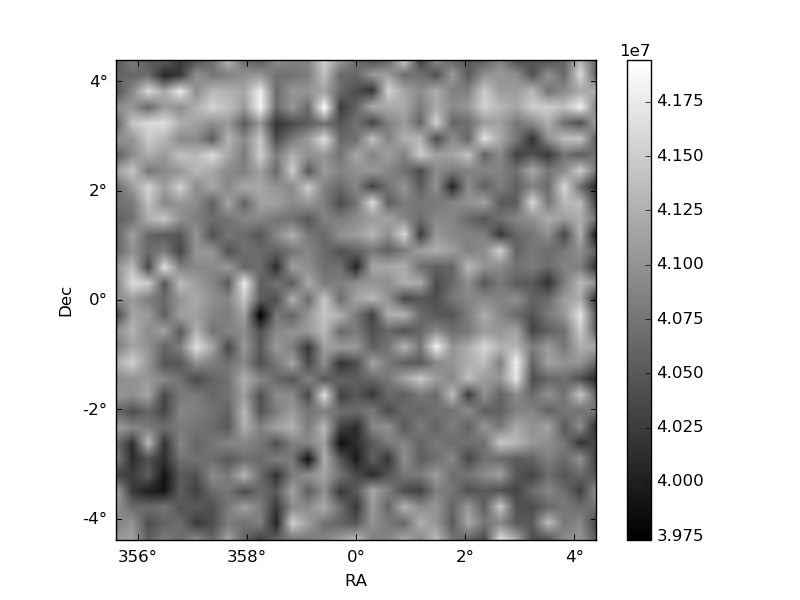
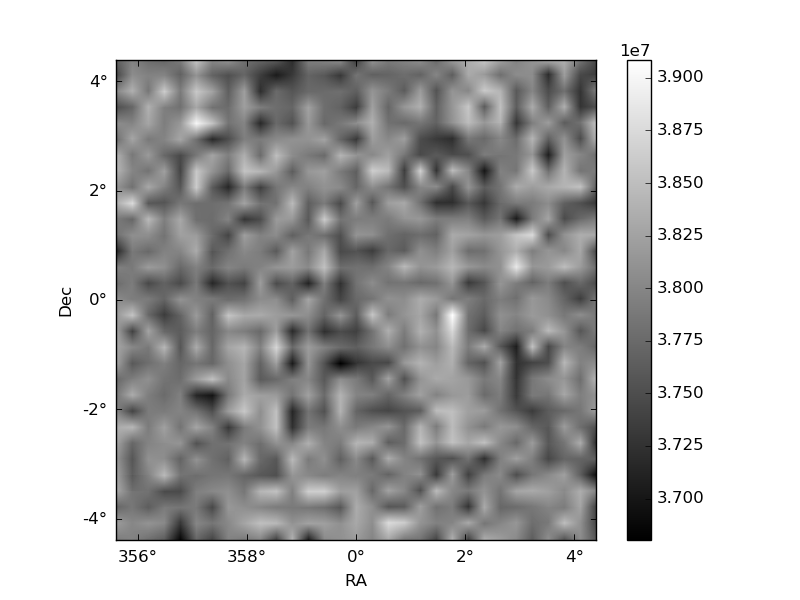
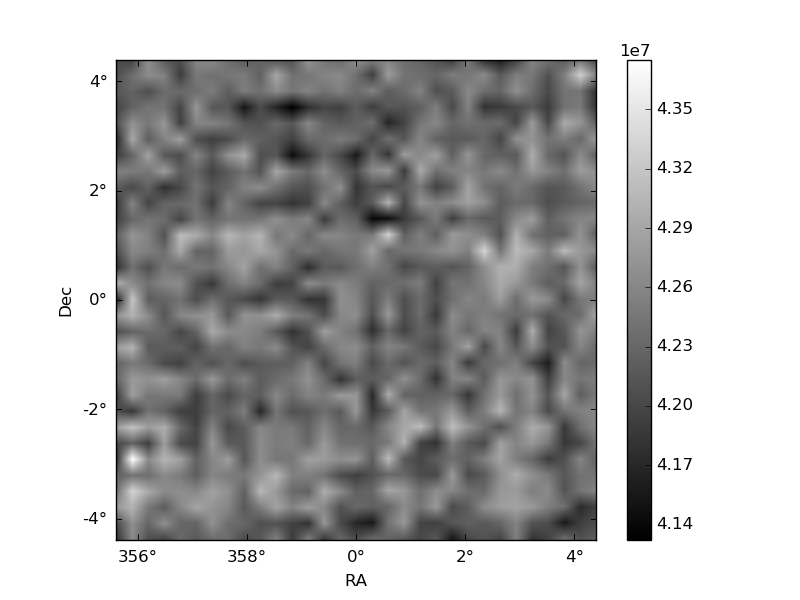
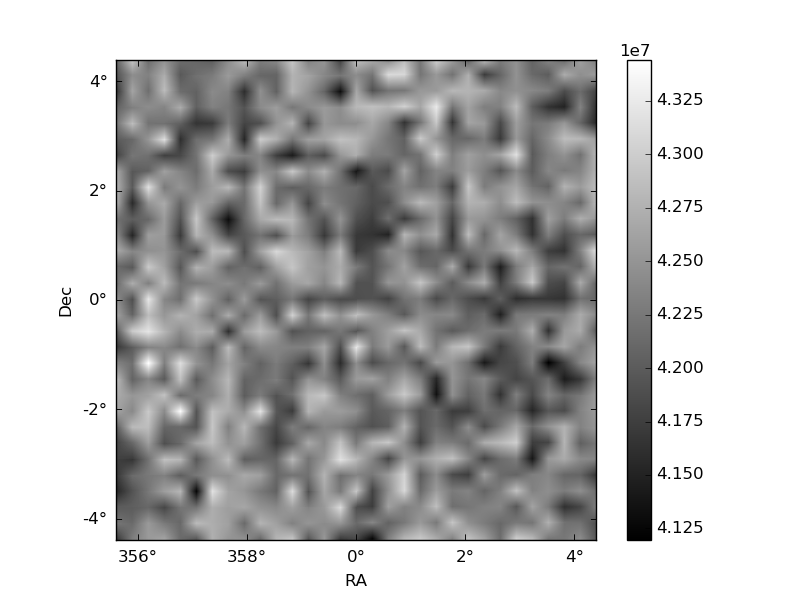
Histogram calculated using DETX and DETY for each event in the final _common_clean file
| Quadrant A | 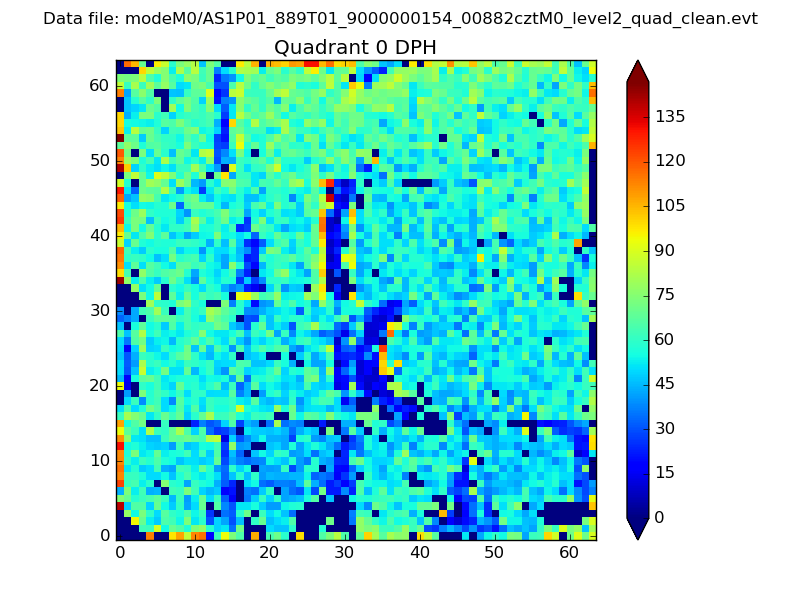 |
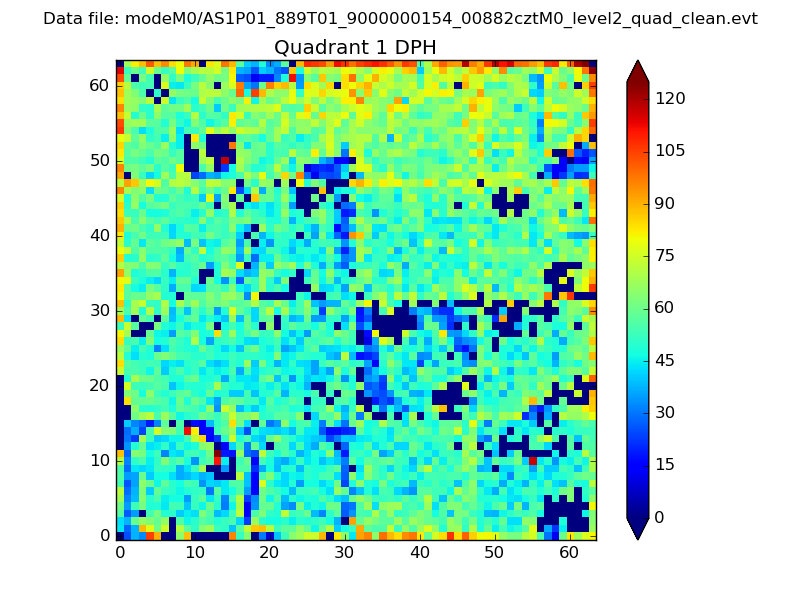 |
Quadrant B |
|---|---|---|---|
| Quadrant D | 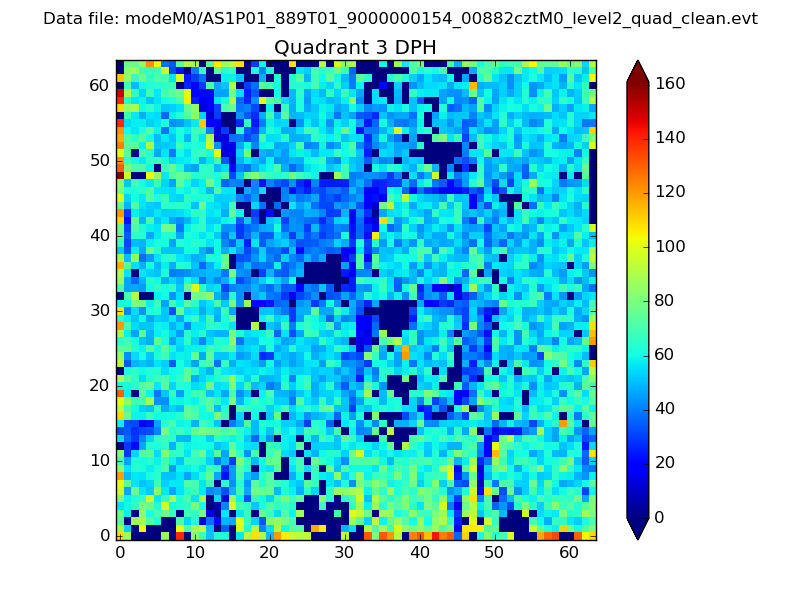 |
 |
Quadrant C |
| Plot type | Count rate plots | Images |
|---|---|---|
| Comparison with Poisson distribution Blue bars denote a histogram of data divided into 1 sec bins. Red curve is a Poisson curve with rate = median count rate of data. |
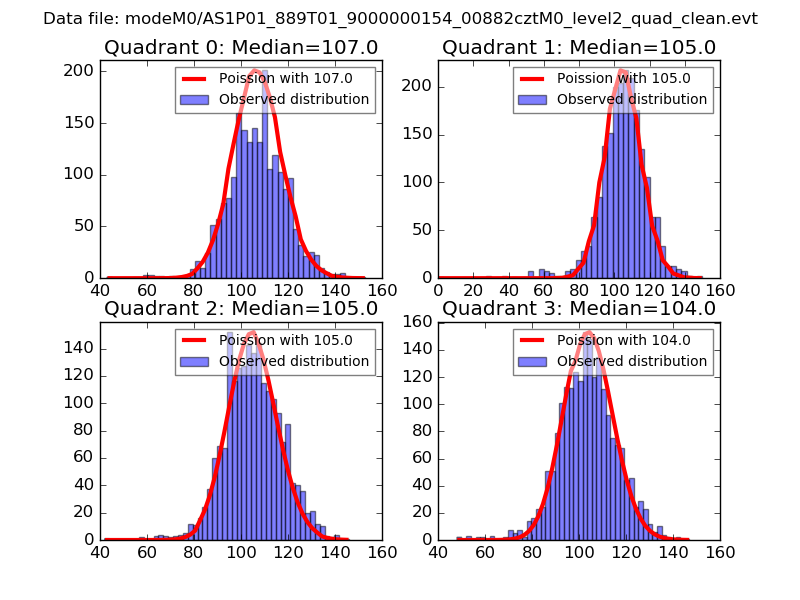 |
 |
| Quadrant-wise count rates Data is divided into 100 sec bins |
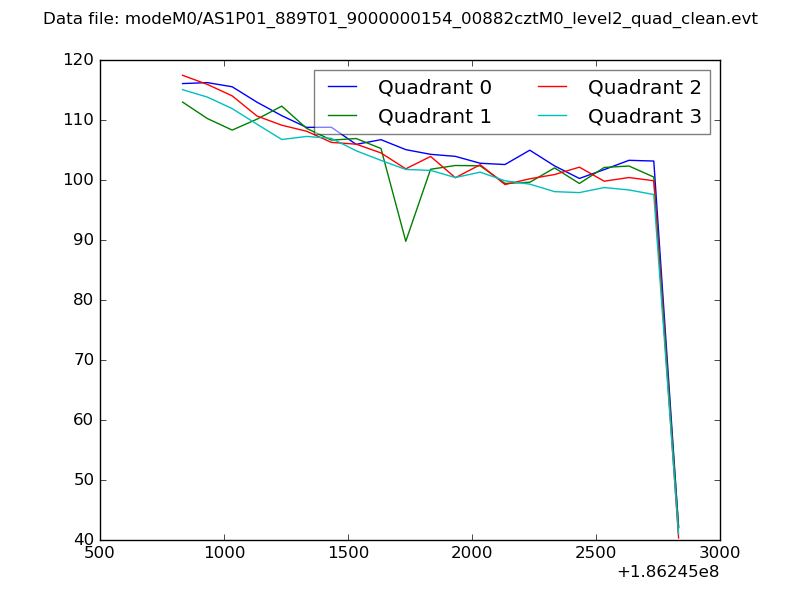 |
|
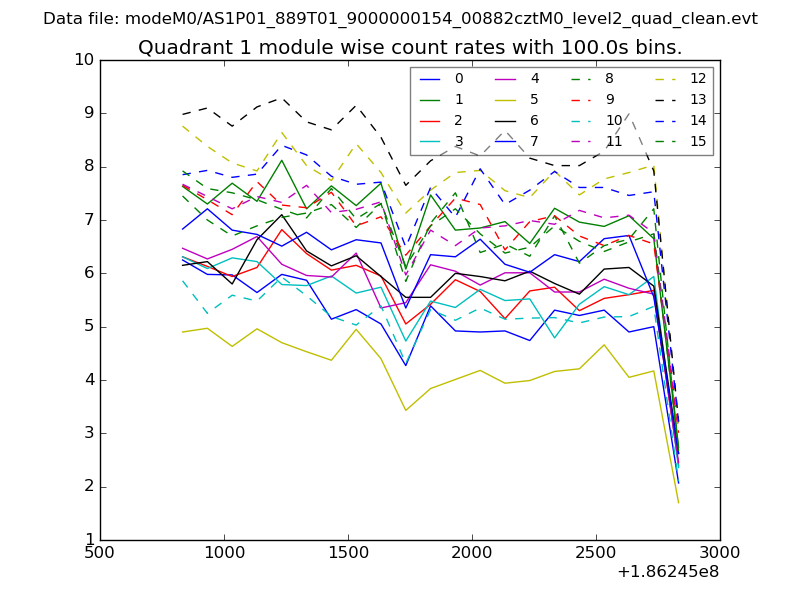
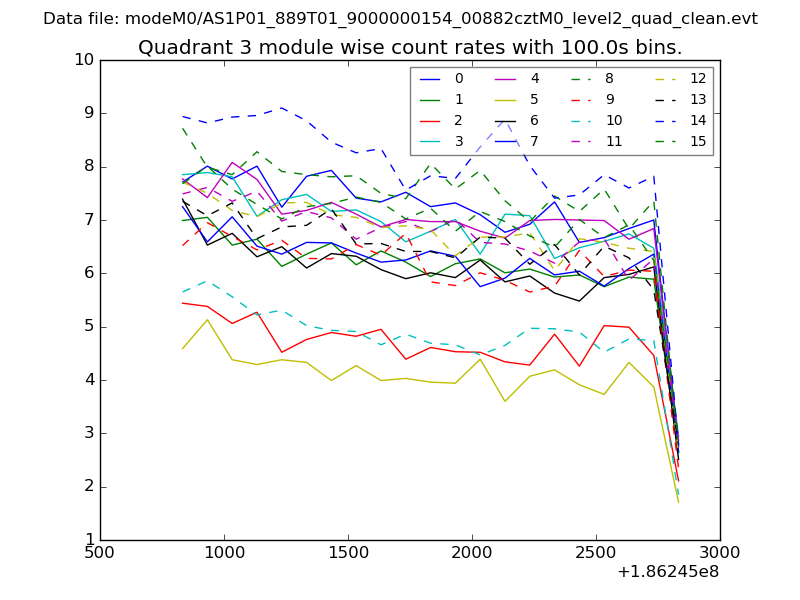
| Module-wise count rates for Quadrant A Data is divided into 100 sec bins |
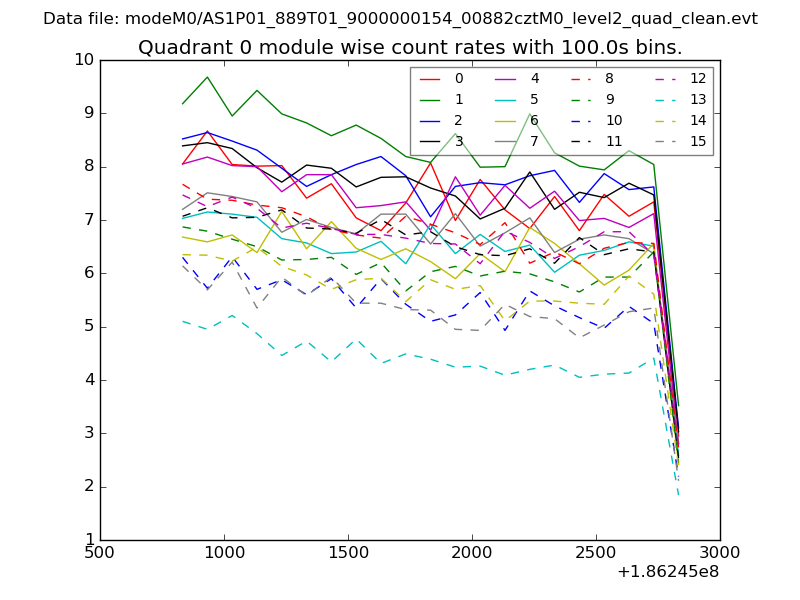 |
 |
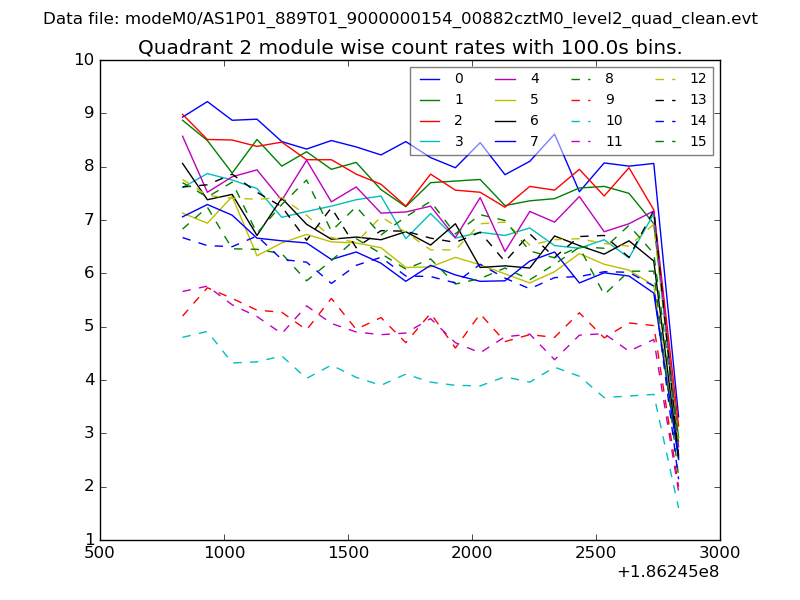
| Module-wise count rates for Quadrant B Data is divided into 100 sec bins |
 |
 |
| Module-wise count rates for Quadrant C Data is divided into 100 sec bins |
 |
 |
| Module-wise count rates for Quadrant D Data is divided into 100 sec bins |
 |
 |
| Parameter | Plot |
|---|---|
| CZT HV Monitor | 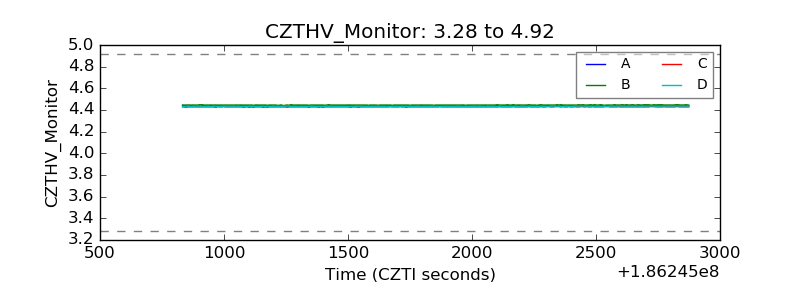 |
| D_VDD |  |
| Temperature 1 | 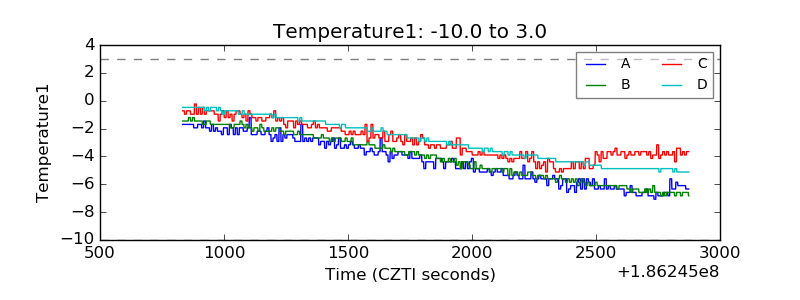 |
| Veto HV Monitor | 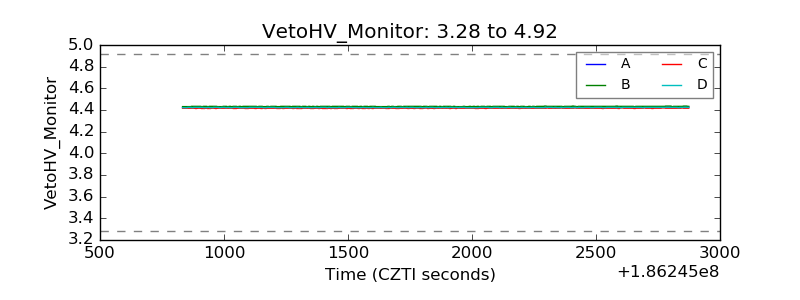 |
| Veto LLD | 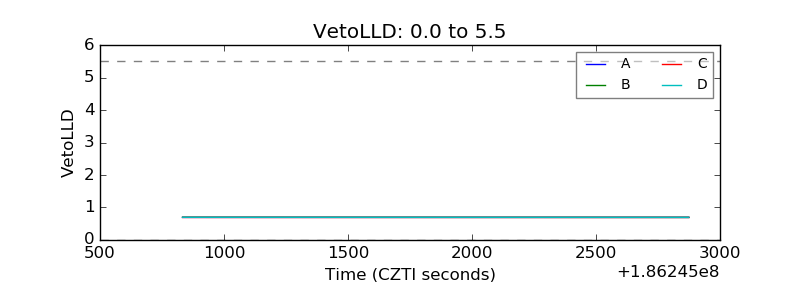 |
| Alpha Counter | 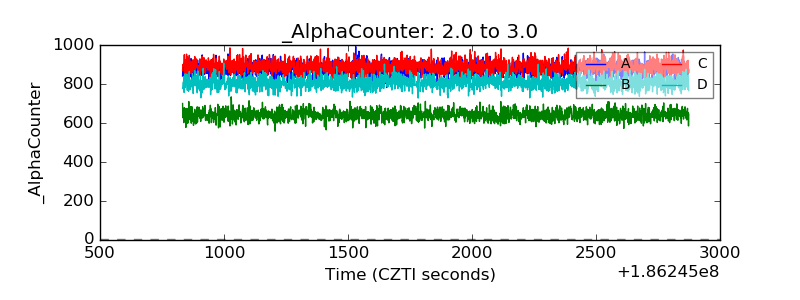 |
| _CPM_Rate | 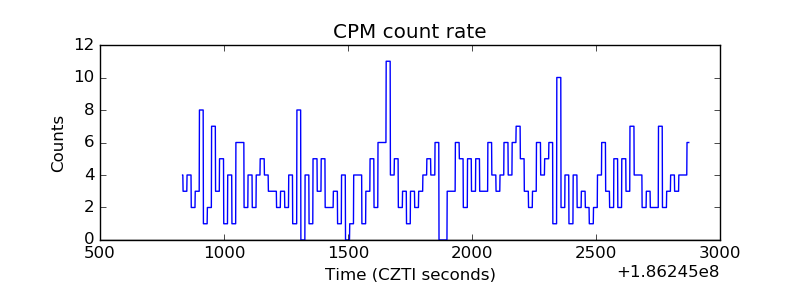 |
| CZT Counter | 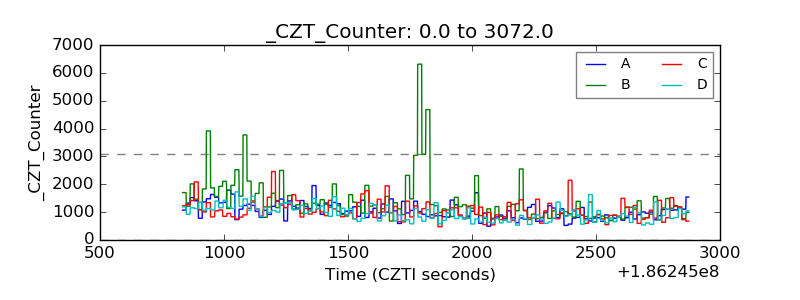 |
| +2.5 Volts monitor |  |
| +5 Volts monitor |  |
| _ROLL_ROT | 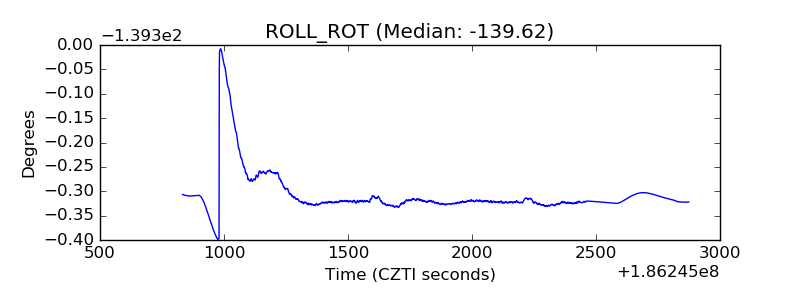 |
| _Roll_DEC | 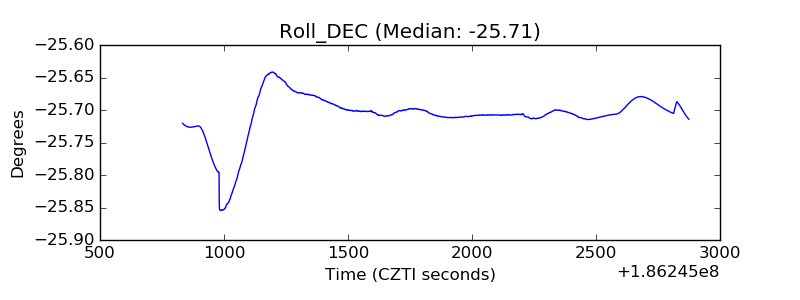 |
| _Roll_RA | 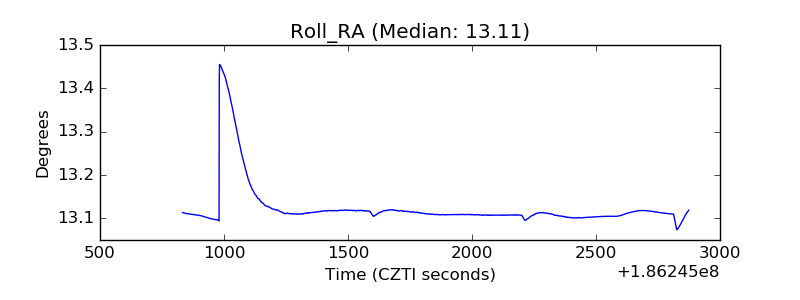 |
| Veto Counter | 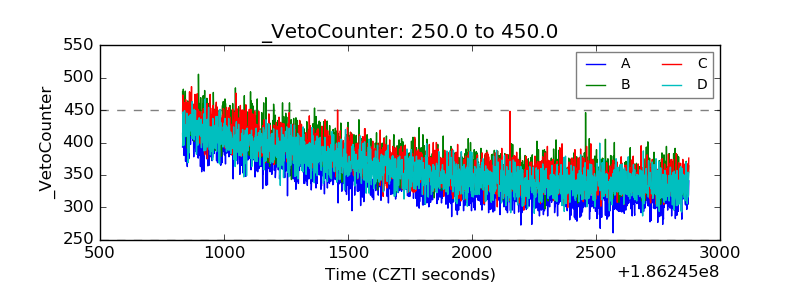 |