| Param | Original file | Final file |
|---|---|---|
| Filename | modeM0/AS1P01_889T01_9000000158cztM0_level2.fits | modeM0/AS1P01_889T01_9000000158cztM0_level2_quad_clean.evt |
| Size (bytes) | 17,968,320 | 13,809,600 |
| Size | 17.1 MB | 13.2 MB |
| Events in quadrant A | 105,192 | 73,341 |
| Events in quadrant B | 93,564 | 57,389 |
| Events in quadrant C | 106,016 | 71,857 |
| Events in quadrant D | 91,034 | 66,211 |
| Mode M0 | |||
|---|---|---|---|
| Quadrant | BADHDUFLAG | Total packets | Discarded packets |
| A | 0 | 7800 | 0 |
| B | 0 | 12095 | 0 |
| C | 0 | 7450 | 0 |
| D | 0 | 7469 | 0 |
| Mode SS | |||
|---|---|---|---|
| Quadrant | BADHDUFLAG | Total packets | Discarded packets |
| A | 0 | 40 | 0 |
| B | 0 | 40 | 0 |
| C | 0 | 40 | 0 |
| D | 0 | 40 | 0 |
| Quadrant | Total seconds | Saturated seconds | Saturation percentage |
|---|---|---|---|
| A | 2046 | 0 | 0.000000% |
| B | 2046 | 342 | 16.715543% |
| C | 2046 | 1 | 0.048876% |
| D | 2046 | 4 | 0.195503% |
Noise dominated data is calculated using 1-second bins in cleaned event files. If a bin has >2000 counts, and if more than 50% of those come from <1% of pixels, then it is considered to be noise-dominated and hence unusable.
| Quadrant | # 1 sec bins | Bins with >0 counts | Bins with >2000 counts | High rate bins dominated by noise | Noise dominated (total time) | Noise dominated (detector-on time) | Marked lightcurve |
|---|---|---|---|---|---|---|---|
| A | 2045 | 2045 | 0 | 0 | 0.00% | 0.00% | 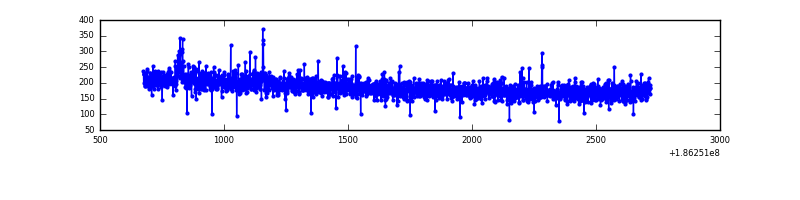 |
| B | 2045 | 2040 | 0 | 0 | 0.00% | 0.00% | 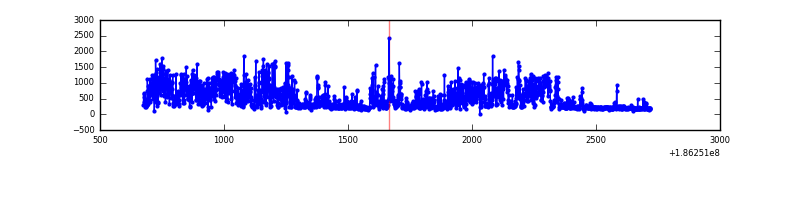 |
| C | 2045 | 2045 | 0 | 0 | 0.00% | 0.00% | 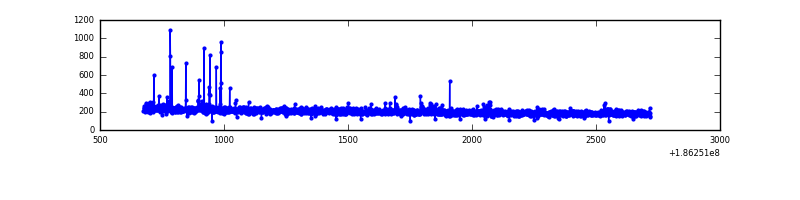 |
| D | 2045 | 2045 | 0 | 0 | 0.00% | 0.00% | 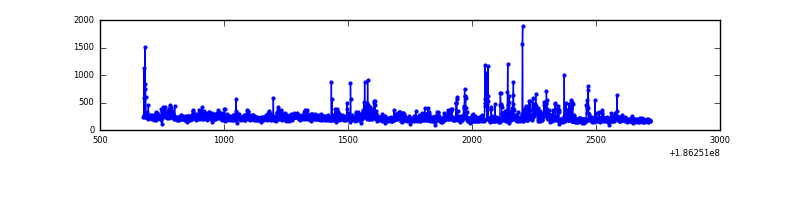 |
Top three noisy pixels from each quadrant. If the there are fewer than three noisy pixels in the level2.evt file, extra rows are filled as -1
| Pixel properties | Quadrant properties | ||||||
|---|---|---|---|---|---|---|---|
| Quadrant | DetID | PixID | Counts | Sigma | Mean | Median | Sigma |
| A | 7 | 110 | 103 | 9.38 | 27 | 26 | 8.2 |
| A | 0 | 29 | 100 | 9.02 | 27 | 26 | 8.2 |
| A | 7 | 94 | 94 | 8.29 | 27 | 26 | 8.2 |
| B | 2 | 9 | 74 | 7.9 | 24 | 23 | 6.5 |
| B | 10 | 225 | 70 | 7.28 | 24 | 23 | 6.5 |
| B | 5 | 225 | 63 | 6.2 | 24 | 23 | 6.5 |
| C | 2 | 191 | 82 | 6.47 | 28 | 26 | 8.7 |
| C | 12 | 225 | 78 | 6.01 | 28 | 26 | 8.7 |
| C | 3 | 235 | 74 | 5.55 | 28 | 26 | 8.7 |
| D | 15 | 30 | 76 | 6.81 | 26 | 24 | 7.6 |
| D | 6 | 44 | 71 | 6.15 | 26 | 24 | 7.6 |
| D | 1 | 19 | 71 | 6.15 | 26 | 24 | 7.6 |
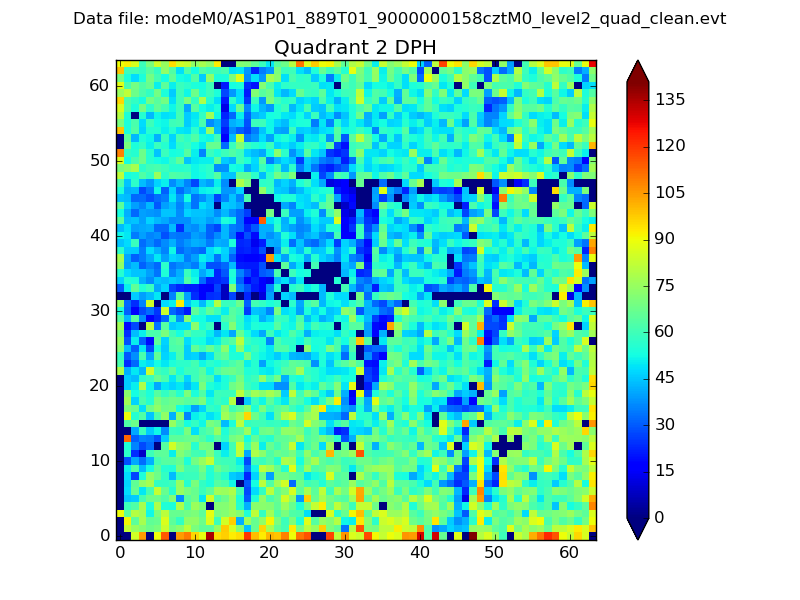
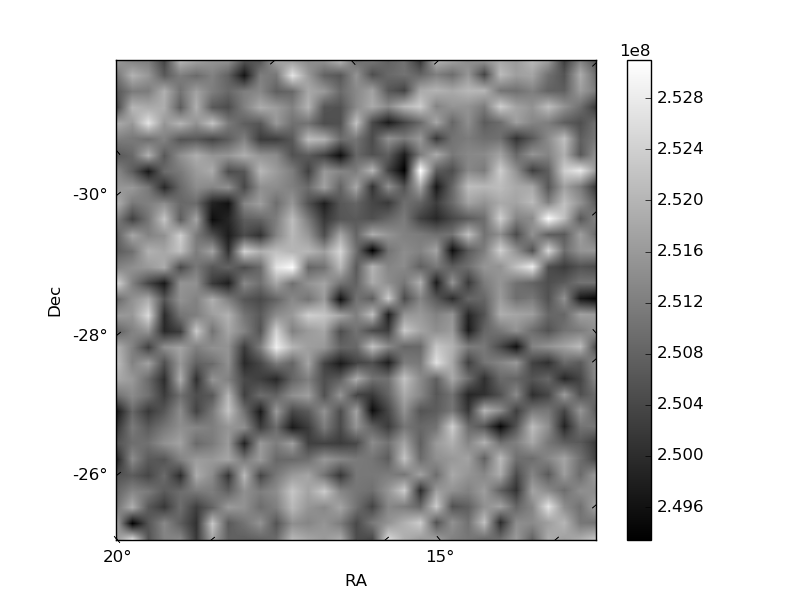
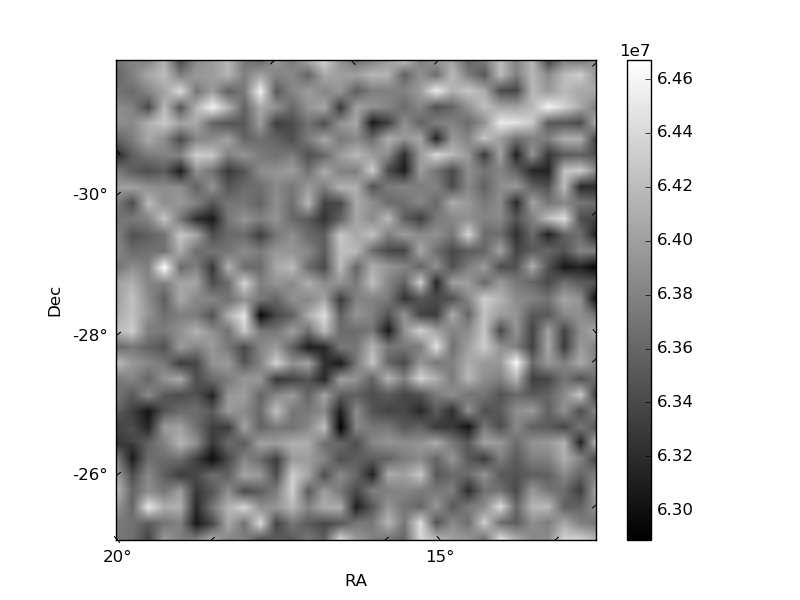
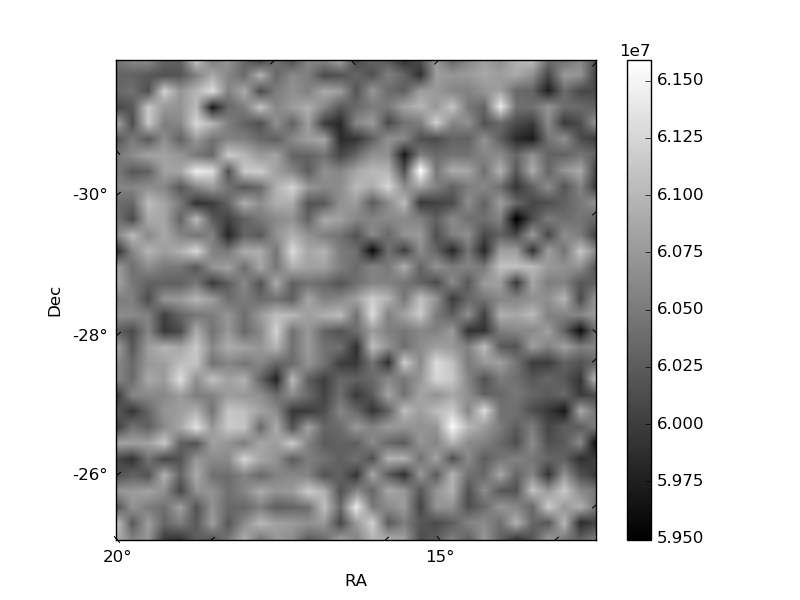
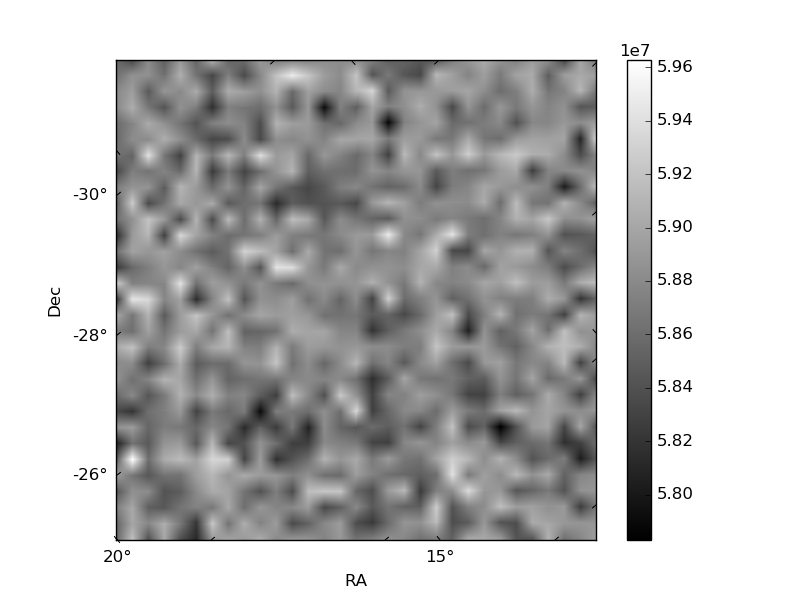
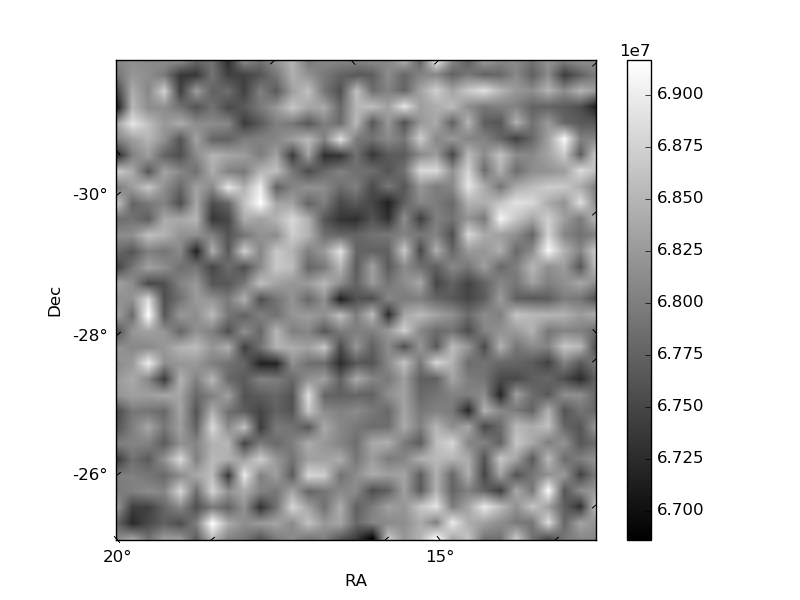
Histogram calculated using DETX and DETY for each event in the final _common_clean file
| Quadrant A | 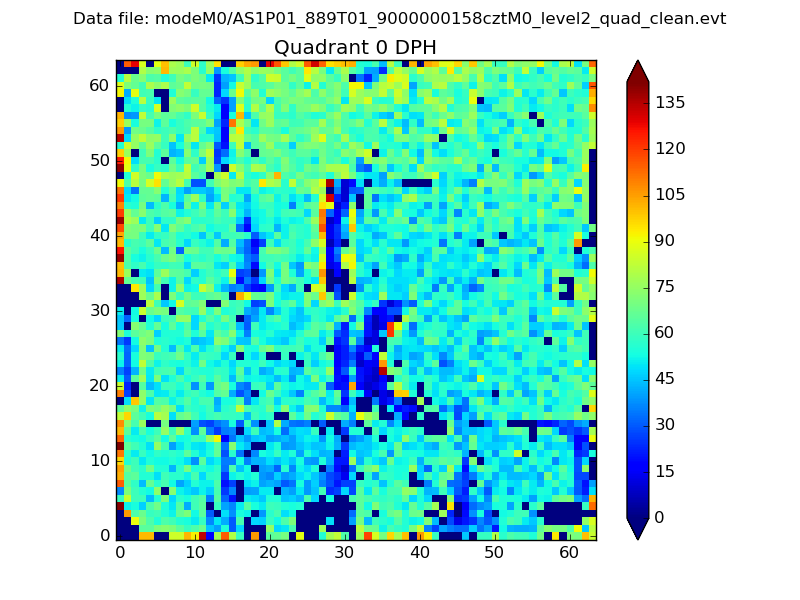 |
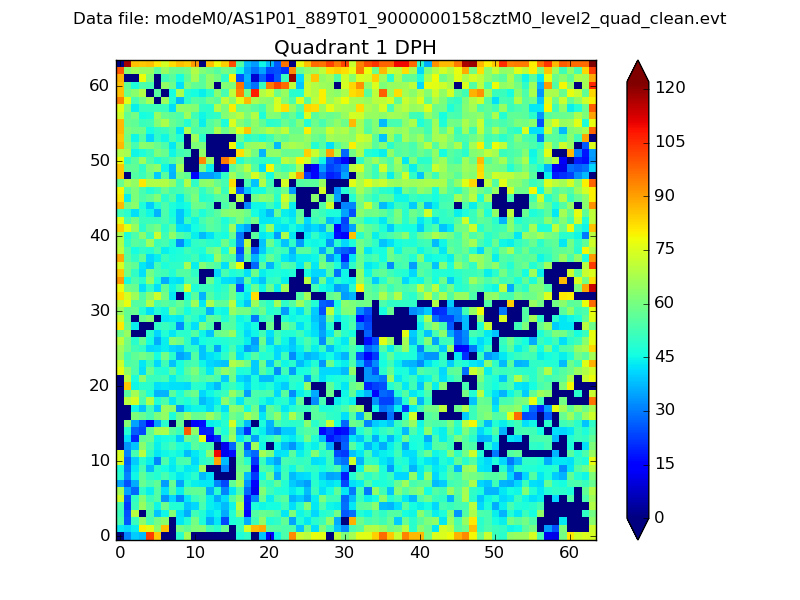 |
Quadrant B |
|---|---|---|---|
| Quadrant D | 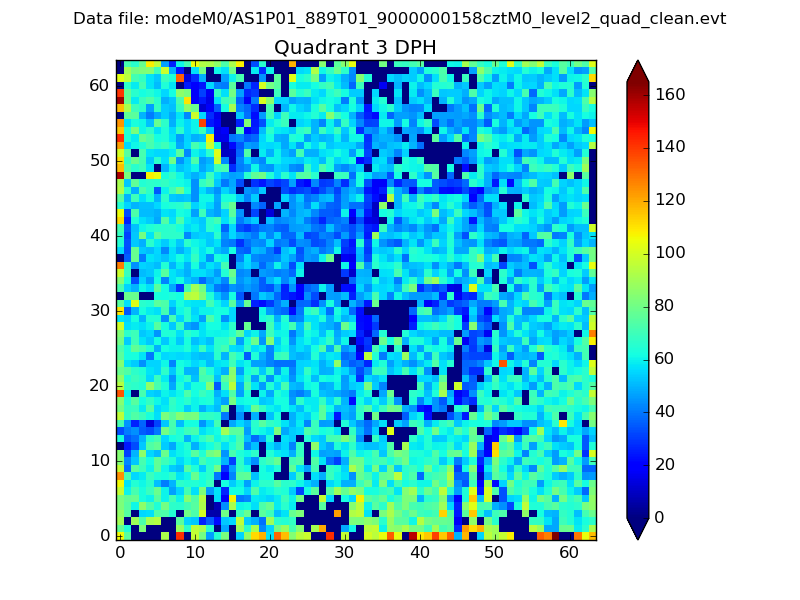 |
 |
Quadrant C |
| Plot type | Count rate plots | Images |
|---|---|---|
| Comparison with Poisson distribution Blue bars denote a histogram of data divided into 1 sec bins. Red curve is a Poisson curve with rate = median count rate of data. |
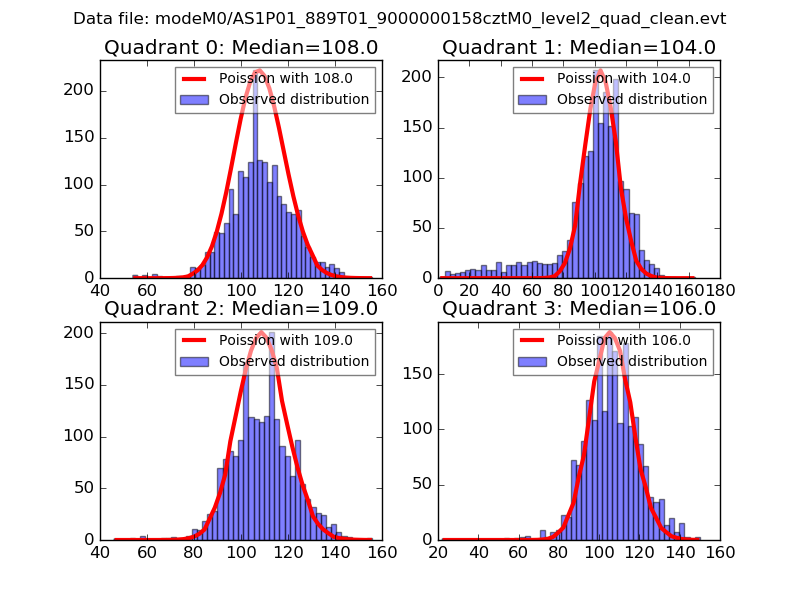 |
 |
| Quadrant-wise count rates Data is divided into 100 sec bins |
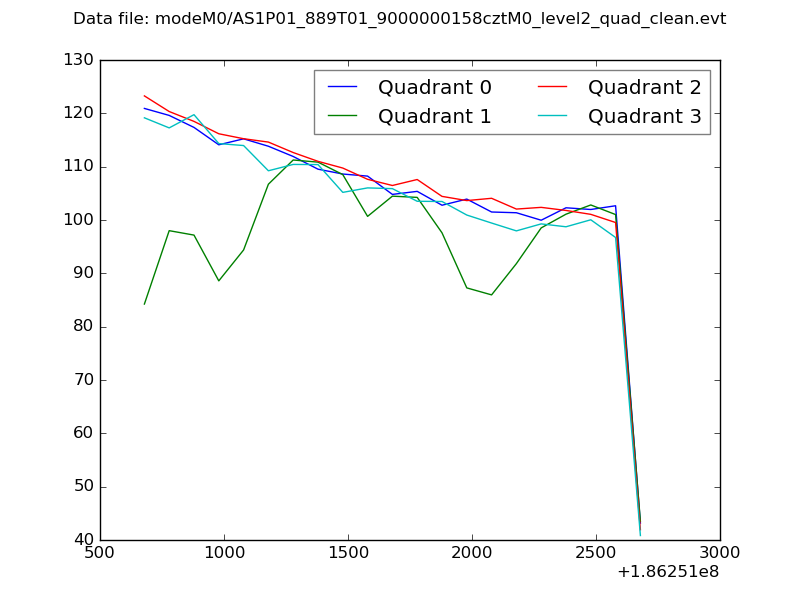 |
|
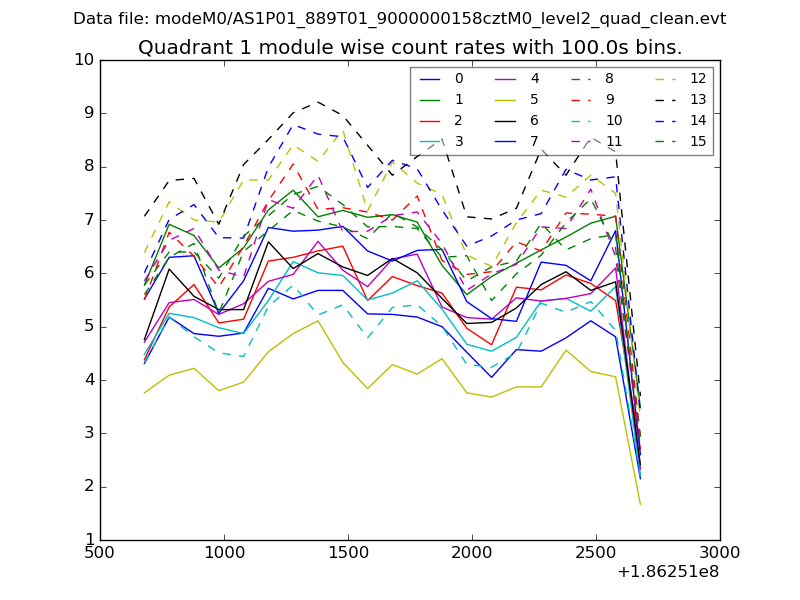
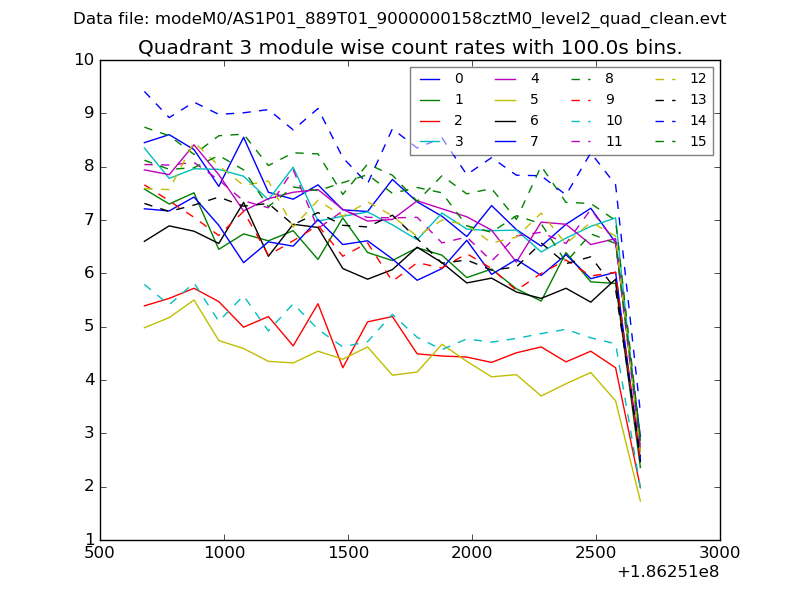
| Module-wise count rates for Quadrant A Data is divided into 100 sec bins |
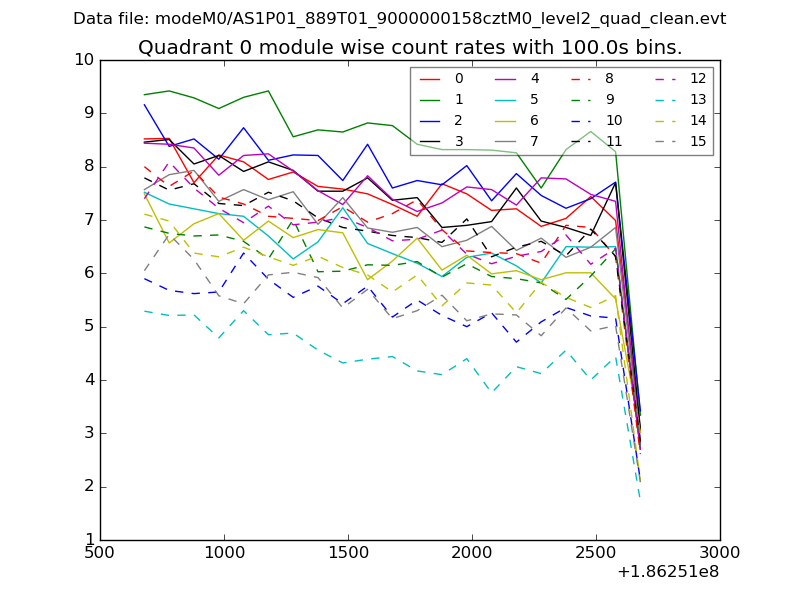 |
 |
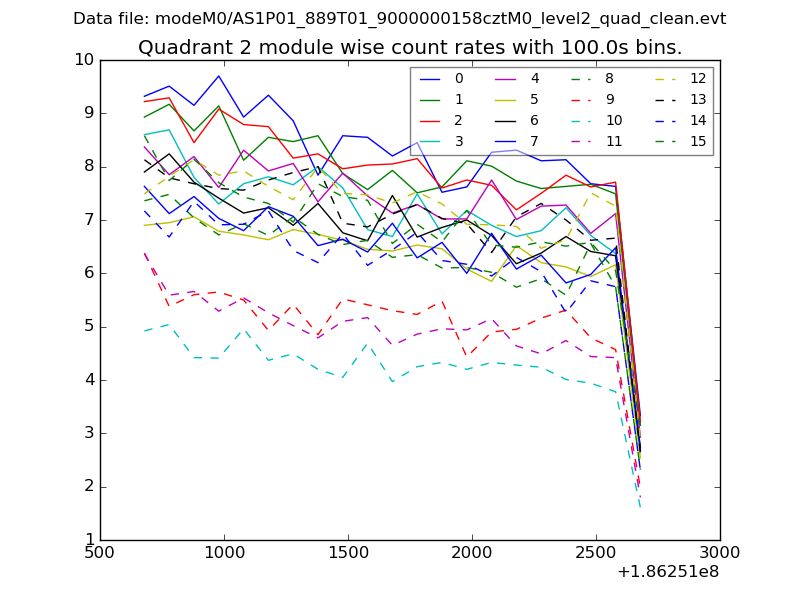
| Module-wise count rates for Quadrant B Data is divided into 100 sec bins |
 |
 |
| Module-wise count rates for Quadrant C Data is divided into 100 sec bins |
 |
 |
| Module-wise count rates for Quadrant D Data is divided into 100 sec bins |
 |
 |
| Parameter | Plot |
|---|---|
| CZT HV Monitor |  |
| D_VDD | 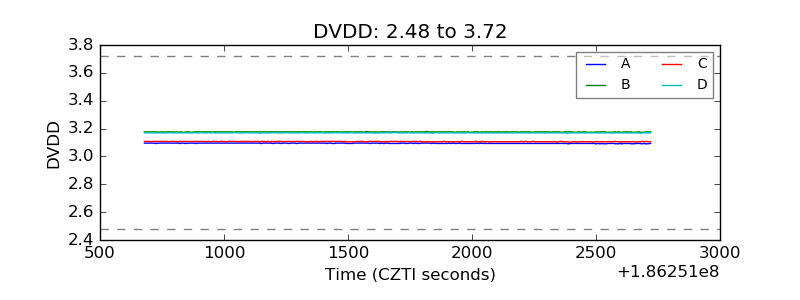 |
| Temperature 1 | 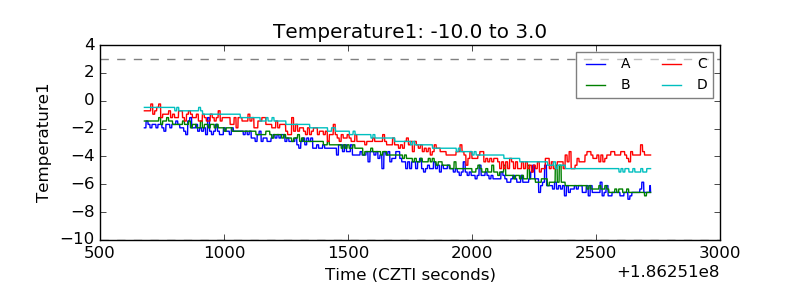 |
| Veto HV Monitor | 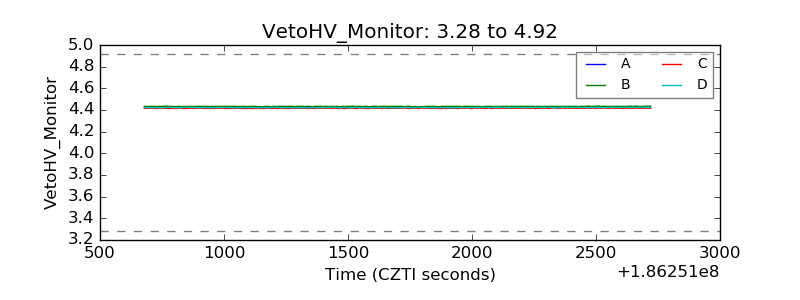 |
| Veto LLD | 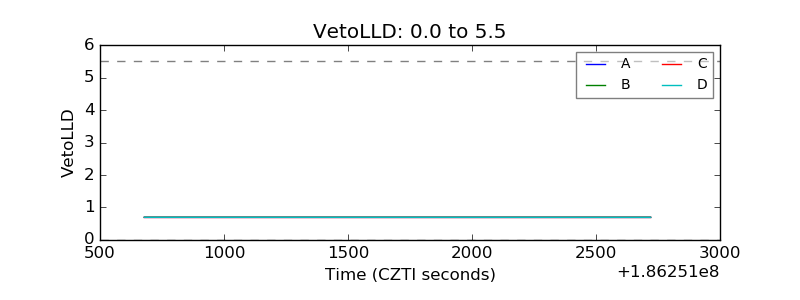 |
| Alpha Counter | 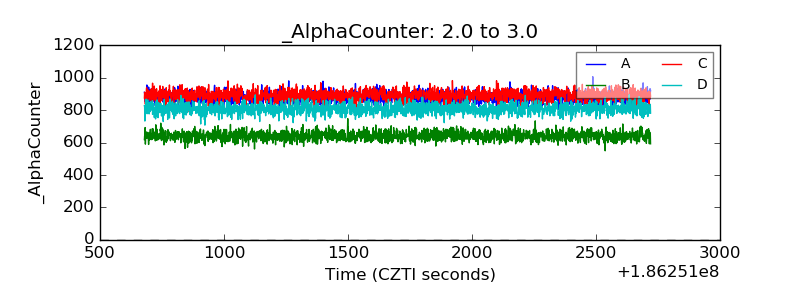 |
| _CPM_Rate | 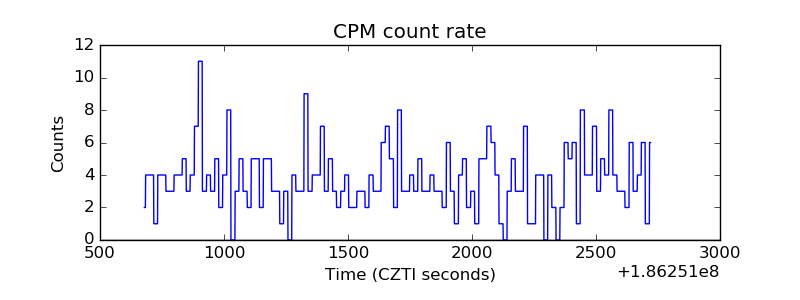 |
| CZT Counter | 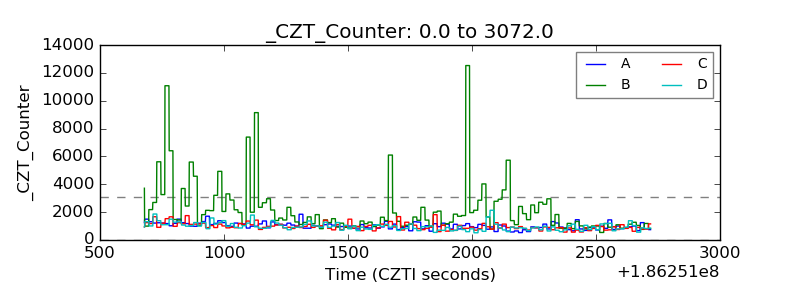 |
| +2.5 Volts monitor | 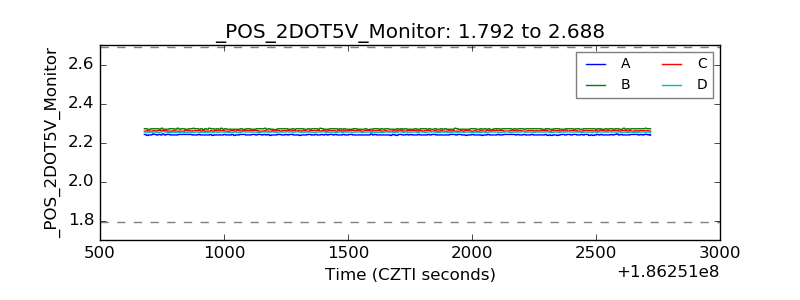 |
| +5 Volts monitor | 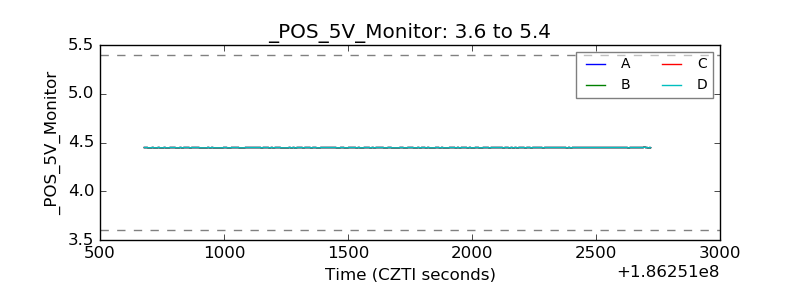 |
| _ROLL_ROT | 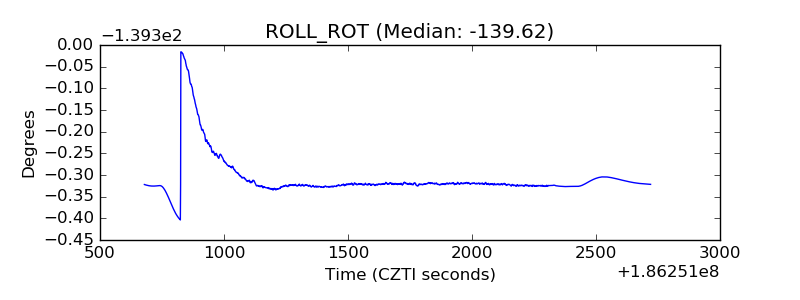 |
| _Roll_DEC | 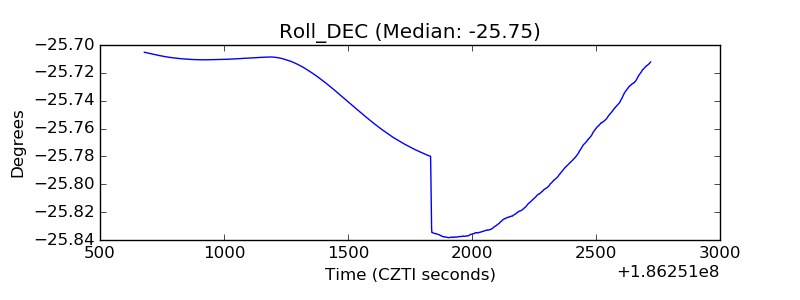 |
| _Roll_RA | 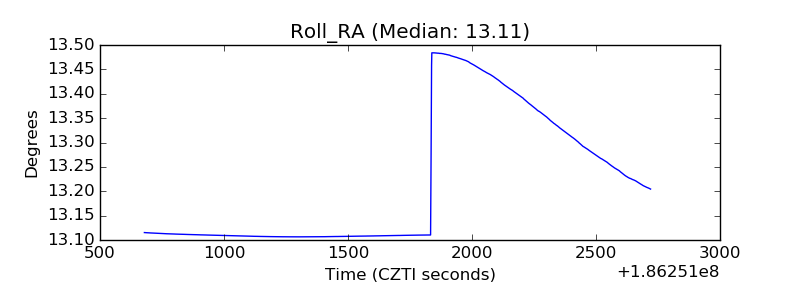 |
| Veto Counter | 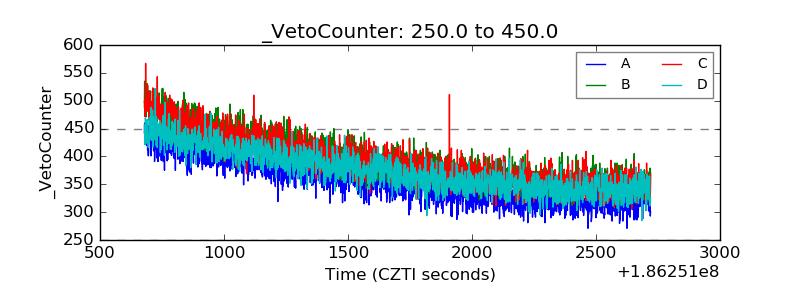 |