| Param | Original file | Final file |
|---|---|---|
| Filename | modeM0/AS1P01_889T01_9000000158_00883cztM0_level2.evt | modeM0/AS1P01_889T01_9000000158_00883cztM0_level2_quad_clean.evt |
| Size (bytes) | 326,139,840 | 33,410,880 |
| Size | 311.0 MB | 31.9 MB |
| Events in quadrant A | 2,135,400 | 221,045 |
| Events in quadrant B | 3,570,907 | 201,992 |
| Events in quadrant C | 2,010,881 | 222,539 |
| Events in quadrant D | 2,021,484 | 217,371 |
| Mode M0 | |||
|---|---|---|---|
| Quadrant | BADHDUFLAG | Total packets | Discarded packets |
| A | 0 | 7800 | 0 |
| B | 0 | 12095 | 0 |
| C | 0 | 7450 | 0 |
| D | 0 | 7469 | 0 |
| Mode SS | |||
|---|---|---|---|
| Quadrant | BADHDUFLAG | Total packets | Discarded packets |
| A | 0 | 40 | 0 |
| B | 0 | 40 | 0 |
| C | 0 | 40 | 0 |
| D | 0 | 40 | 0 |
| Quadrant | Total seconds | Saturated seconds | Saturation percentage |
|---|---|---|---|
| A | 2046 | 0 | 0.000000% |
| B | 2046 | 342 | 16.715543% |
| C | 2046 | 1 | 0.048876% |
| D | 2046 | 4 | 0.195503% |
Noise dominated data is calculated using 1-second bins in cleaned event files. If a bin has >2000 counts, and if more than 50% of those come from <1% of pixels, then it is considered to be noise-dominated and hence unusable.
| Quadrant | # 1 sec bins | Bins with >0 counts | Bins with >2000 counts | High rate bins dominated by noise | Noise dominated (total time) | Noise dominated (detector-on time) | Marked lightcurve |
|---|---|---|---|---|---|---|---|
| A | 2045 | 2045 | 7 | 7 | 0.34% | 0.34% | 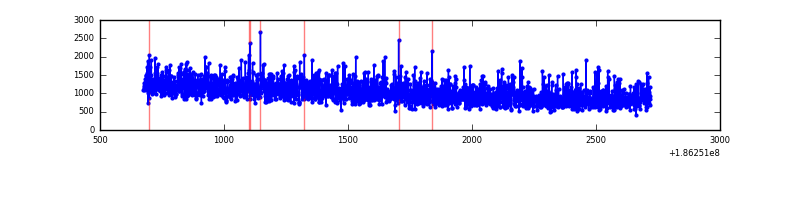 |
| B | 2045 | 2045 | 650 | 650 | 31.78% | 31.78% | 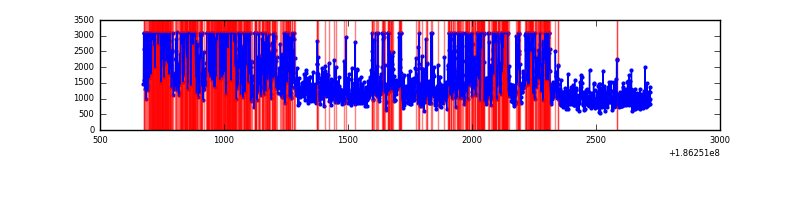 |
| C | 2045 | 2045 | 7 | 7 | 0.34% | 0.34% | 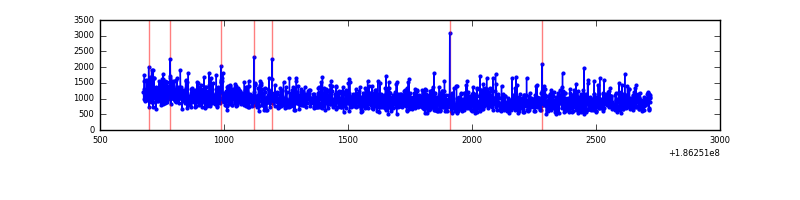 |
| D | 2045 | 2045 | 21 | 21 | 1.03% | 1.03% | 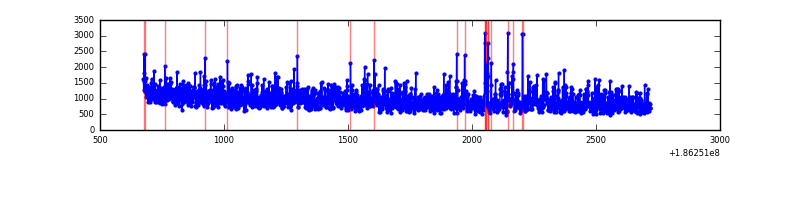 |
Top three noisy pixels from each quadrant. If the there are fewer than three noisy pixels in the level2.evt file, extra rows are filled as -1
| Pixel properties | Quadrant properties | ||||||
|---|---|---|---|---|---|---|---|
| Quadrant | DetID | PixID | Counts | Sigma | Mean | Median | Sigma |
| A | 14 | 170 | 3760 | 24.13 | 554 | 559 | 132.7 |
| A | 3 | 80 | 3663 | 23.4 | 554 | 559 | 132.7 |
| A | 11 | 79 | 2292 | 13.06 | 554 | 559 | 132.7 |
| B | 3 | 0 | 1192192 | 9225.56 | 544 | 548 | 129.2 |
| B | 8 | 38 | 235825 | 1821.49 | 544 | 548 | 129.2 |
| B | 4 | 222 | 23493 | 177.64 | 544 | 548 | 129.2 |
| C | 2 | 53 | 18363 | 129.03 | 502 | 518 | 138.3 |
| C | 3 | 111 | 8798 | 59.87 | 502 | 518 | 138.3 |
| C | 3 | 79 | 7285 | 48.93 | 502 | 518 | 138.3 |
| D | 13 | 170 | 126058 | 832.74 | 490 | 505 | 150.8 |
| D | 1 | 4 | 26614 | 173.17 | 490 | 505 | 150.8 |
| D | 13 | 13 | 10140 | 63.91 | 490 | 505 | 150.8 |
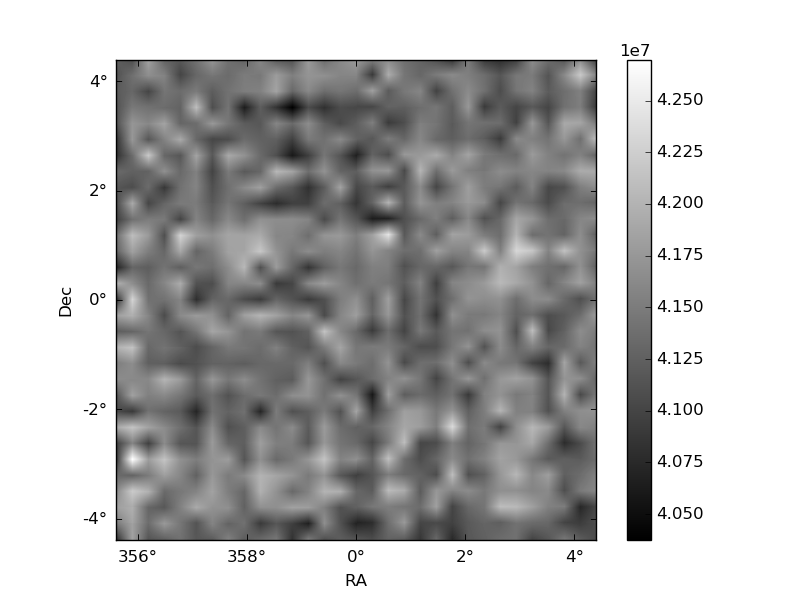
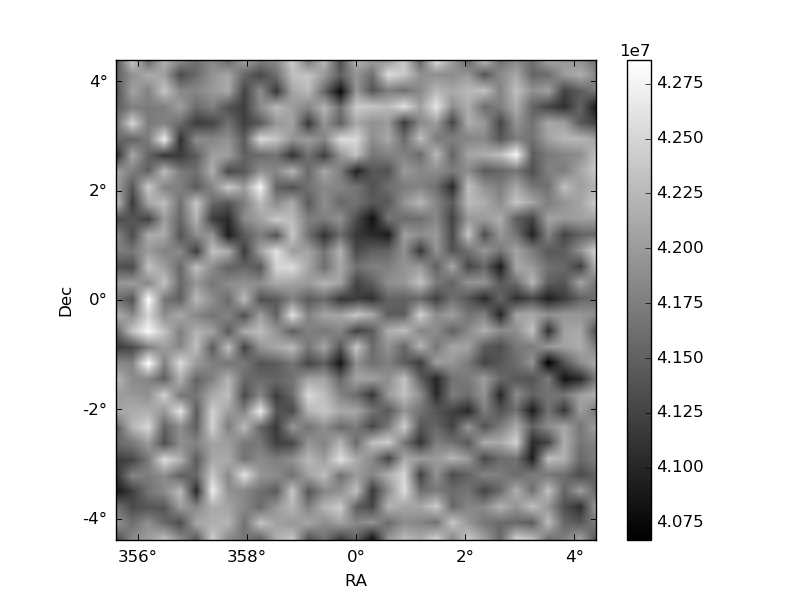
Histogram calculated using DETX and DETY for each event in the final _common_clean file
| Quadrant A | 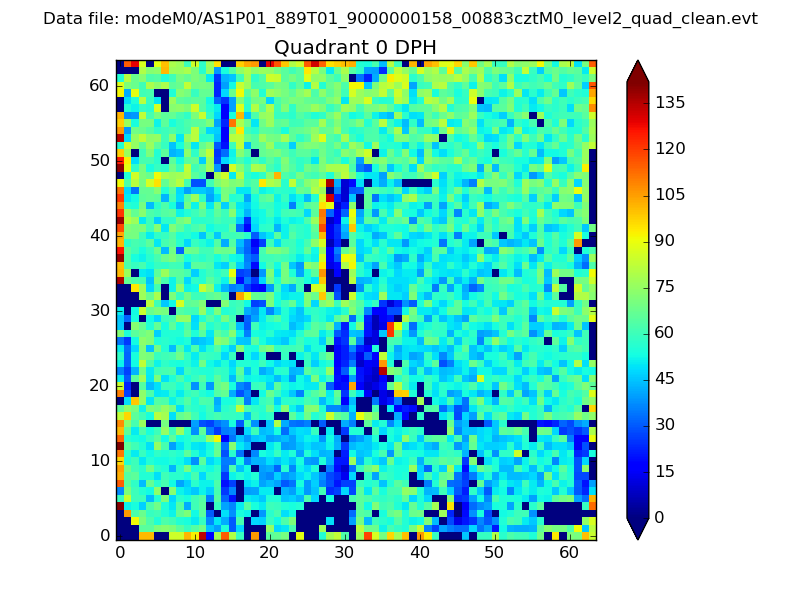 |
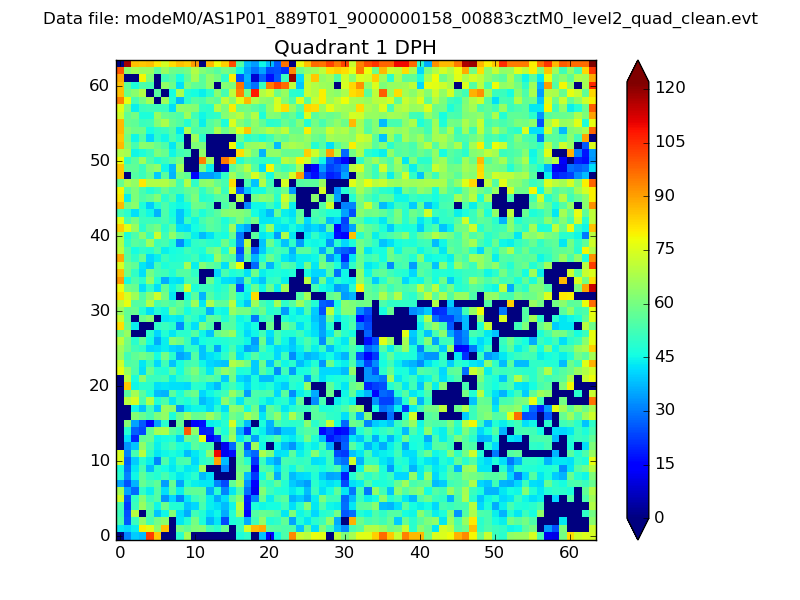 |
Quadrant B |
|---|---|---|---|
| Quadrant D |  |
 |
Quadrant C |
| Plot type | Count rate plots | Images |
|---|---|---|
| Comparison with Poisson distribution Blue bars denote a histogram of data divided into 1 sec bins. Red curve is a Poisson curve with rate = median count rate of data. |
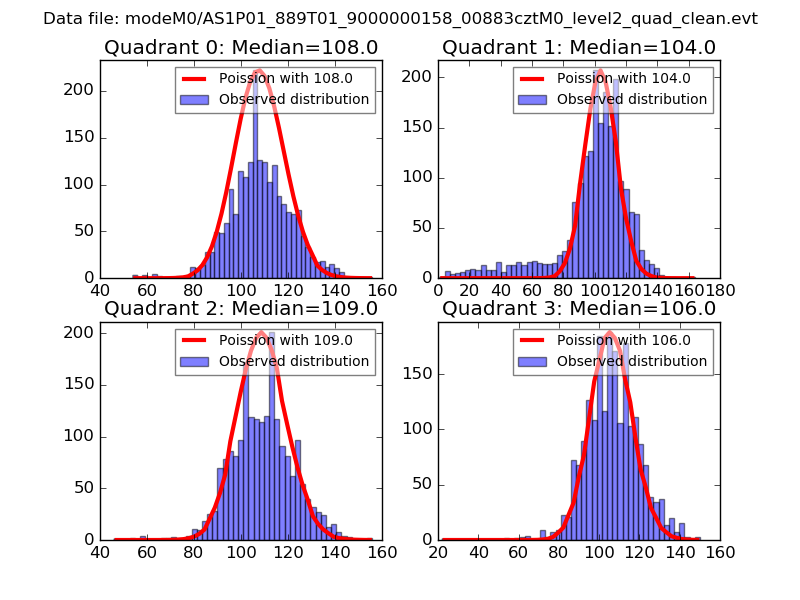 |
 |
| Quadrant-wise count rates Data is divided into 100 sec bins |
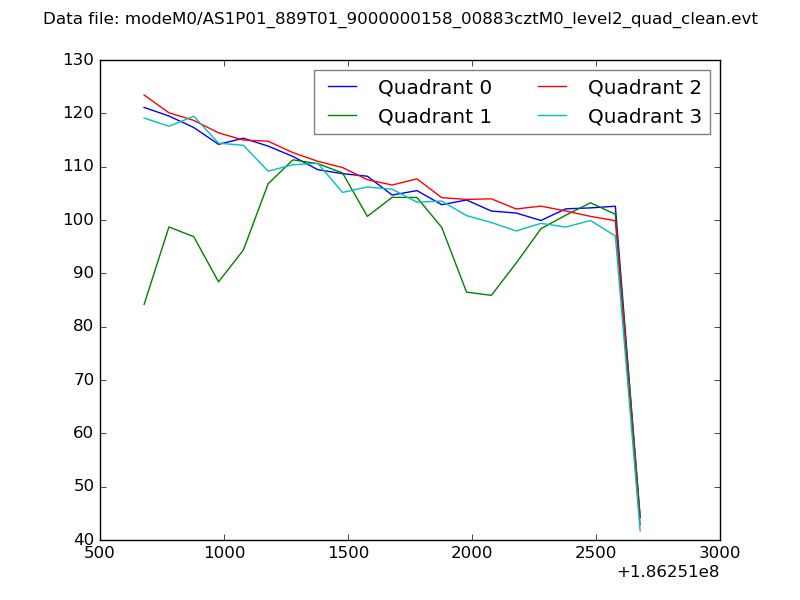 |
|
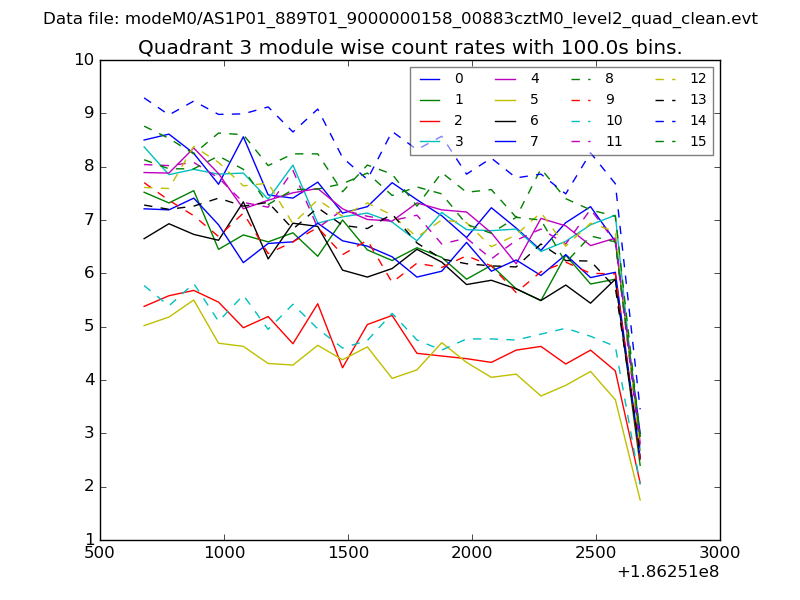
| Module-wise count rates for Quadrant A Data is divided into 100 sec bins |
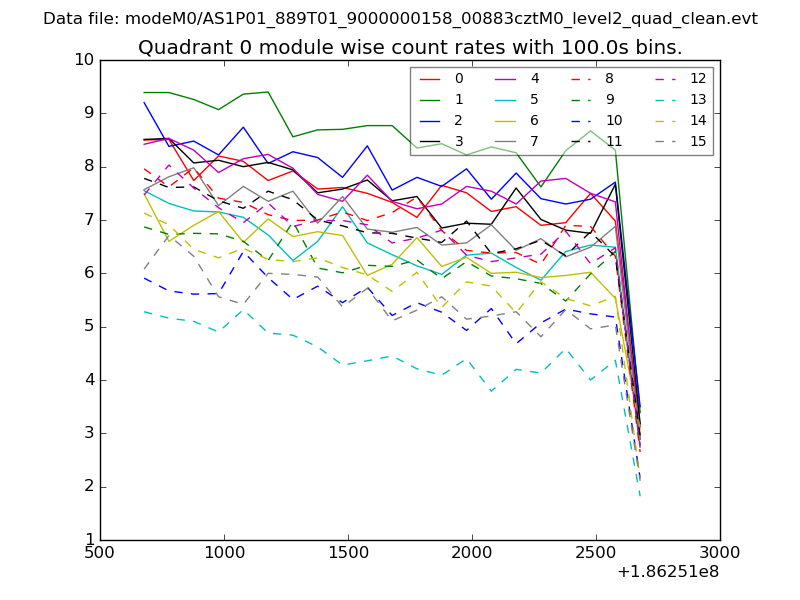 |
 |
| Module-wise count rates for Quadrant B Data is divided into 100 sec bins |
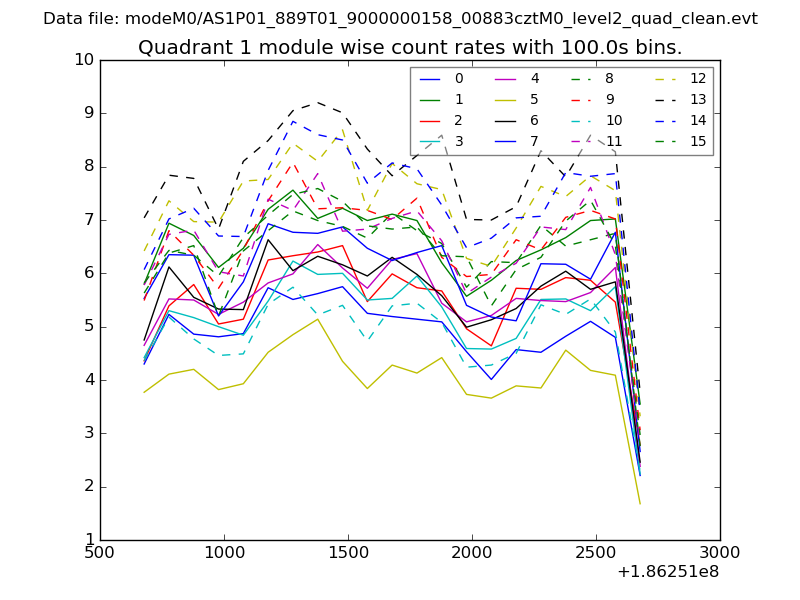 |
 |
| Module-wise count rates for Quadrant C Data is divided into 100 sec bins |
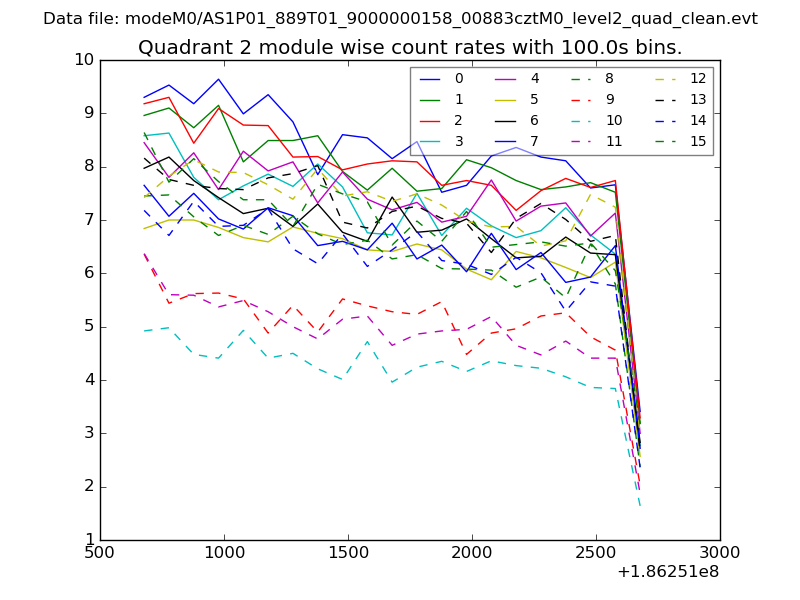 |
 |
| Module-wise count rates for Quadrant D Data is divided into 100 sec bins |
 |
 |
| Parameter | Plot |
|---|---|
| CZT HV Monitor | 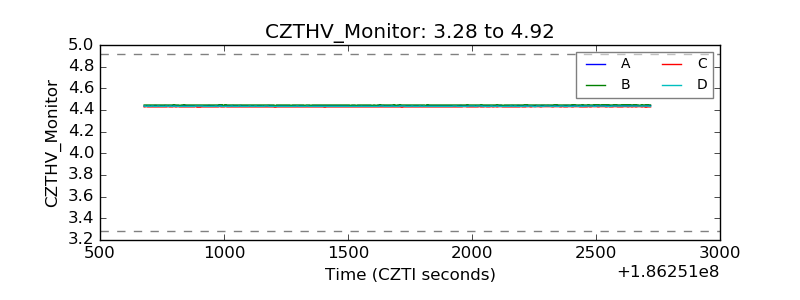 |
| D_VDD | 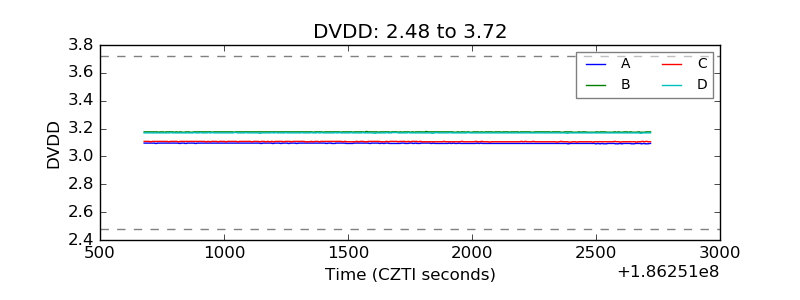 |
| Temperature 1 | 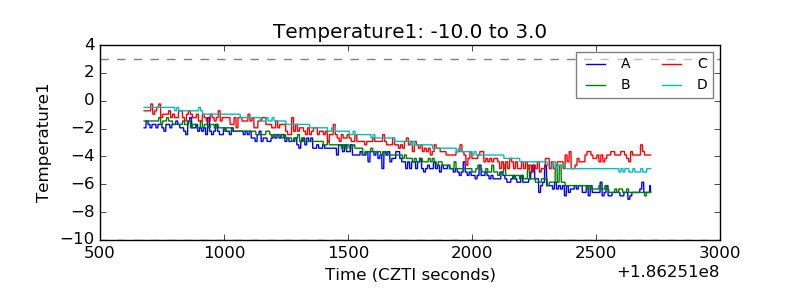 |
| Veto HV Monitor | 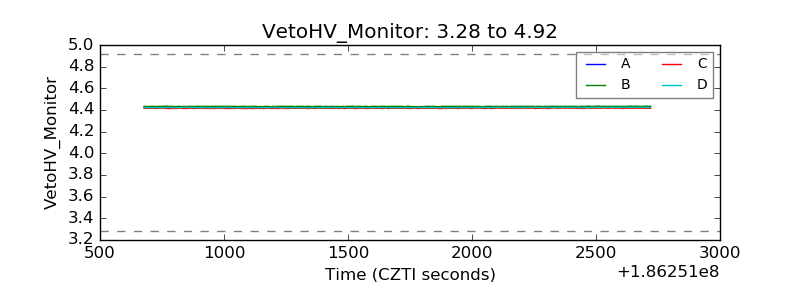 |
| Veto LLD | 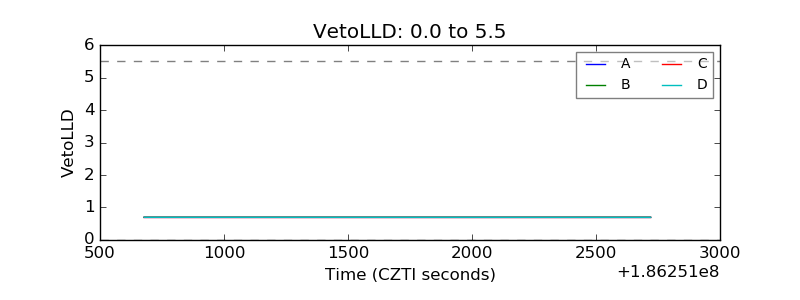 |
| Alpha Counter | 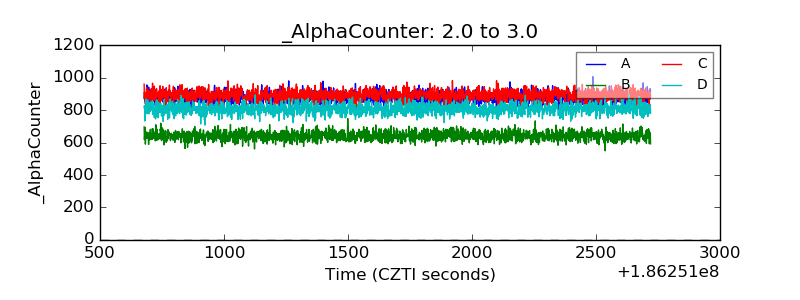 |
| _CPM_Rate | 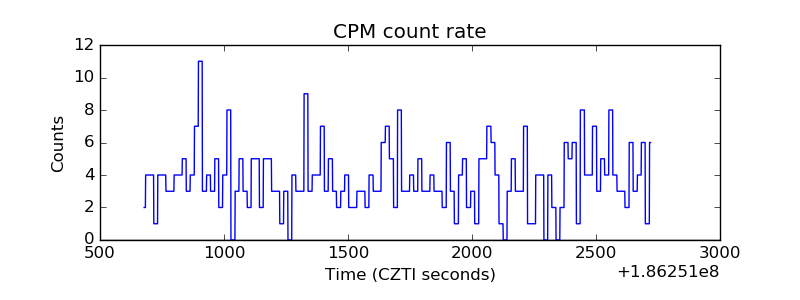 |
| CZT Counter |  |
| +2.5 Volts monitor |  |
| +5 Volts monitor |  |
| _ROLL_ROT | 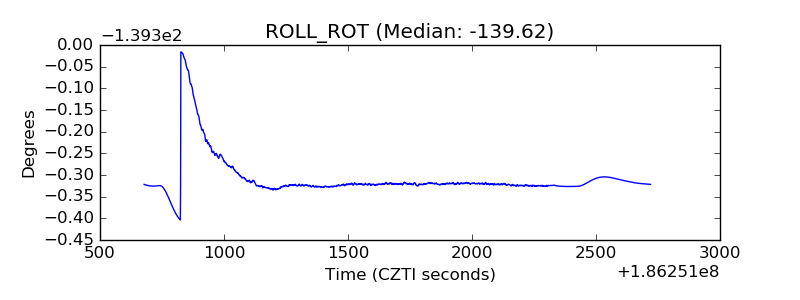 |
| _Roll_DEC | 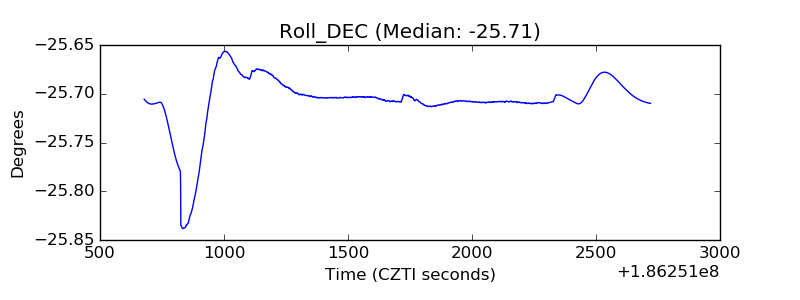 |
| _Roll_RA | 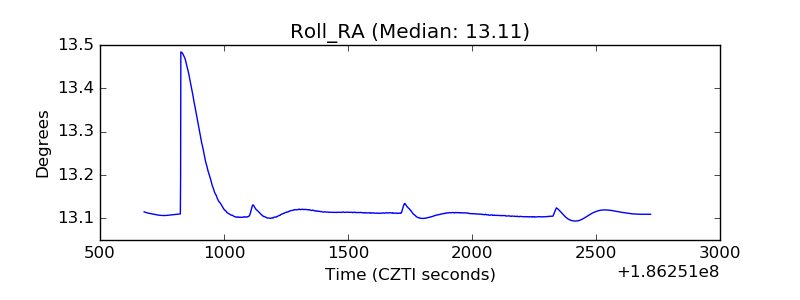 |
| Veto Counter | 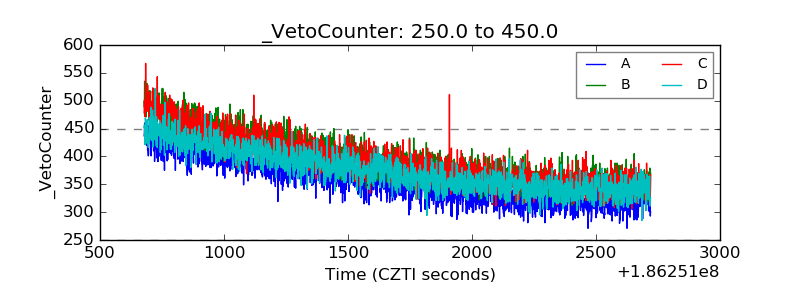 |