| Param | Original file | Final file |
|---|---|---|
| Filename | modeM0/AS1P01_889T01_9000000162cztM0_level2.fits | modeM0/AS1P01_889T01_9000000162cztM0_level2_quad_clean.evt |
| Size (bytes) | 17,786,880 | 12,170,880 |
| Size | 17.0 MB | 11.6 MB |
| Events in quadrant A | 103,038 | 60,478 |
| Events in quadrant B | 93,788 | 46,193 |
| Events in quadrant C | 104,522 | 58,776 |
| Events in quadrant D | 88,542 | 53,297 |
| Mode M0 | |||
|---|---|---|---|
| Quadrant | BADHDUFLAG | Total packets | Discarded packets |
| A | 0 | 8405 | 0 |
| B | 0 | 12266 | 0 |
| C | 0 | 7538 | 0 |
| D | 0 | 8733 | 0 |
| Mode SS | |||
|---|---|---|---|
| Quadrant | BADHDUFLAG | Total packets | Discarded packets |
| A | 0 | 42 | 0 |
| B | 0 | 42 | 0 |
| C | 0 | 42 | 0 |
| D | 0 | 42 | 0 |
| Quadrant | Total seconds | Saturated seconds | Saturation percentage |
|---|---|---|---|
| A | 2047 | 1 | 0.048852% |
| B | 2046 | 342 | 16.715543% |
| C | 2047 | 0 | 0.000000% |
| D | 2046 | 15 | 0.733138% |
Noise dominated data is calculated using 1-second bins in cleaned event files. If a bin has >2000 counts, and if more than 50% of those come from <1% of pixels, then it is considered to be noise-dominated and hence unusable.
| Quadrant | # 1 sec bins | Bins with >0 counts | Bins with >2000 counts | High rate bins dominated by noise | Noise dominated (total time) | Noise dominated (detector-on time) | Marked lightcurve |
|---|---|---|---|---|---|---|---|
| A | 2046 | 2046 | 0 | 0 | 0.00% | 0.00% |  |
| B | 2046 | 2036 | 0 | 0 | 0.00% | 0.00% |  |
| C | 2046 | 2046 | 0 | 0 | 0.00% | 0.00% |  |
| D | 2046 | 2045 | 0 | 0 | 0.00% | 0.00% |  |
Top three noisy pixels from each quadrant. If the there are fewer than three noisy pixels in the level2.evt file, extra rows are filled as -1
| Pixel properties | Quadrant properties | ||||||
|---|---|---|---|---|---|---|---|
| Quadrant | DetID | PixID | Counts | Sigma | Mean | Median | Sigma |
| A | 0 | 29 | 87 | 7.74 | 26 | 25 | 8.0 |
| A | 7 | 110 | 84 | 7.36 | 26 | 25 | 8.0 |
| A | 9 | 191 | 82 | 7.11 | 26 | 25 | 8.0 |
| B | 2 | 9 | 74 | 7.36 | 24 | 23 | 6.9 |
| B | 3 | 80 | 67 | 6.35 | 24 | 23 | 6.9 |
| B | 14 | 207 | 66 | 6.2 | 24 | 23 | 6.9 |
| C | 3 | 202 | 86 | 7.03 | 27 | 25 | 8.7 |
| C | 9 | 233 | 82 | 6.57 | 27 | 25 | 8.7 |
| C | 2 | 17 | 76 | 5.88 | 27 | 25 | 8.7 |
| D | 7 | 3 | 75 | 6.7 | 25 | 23 | 7.8 |
| D | 15 | 78 | 71 | 6.19 | 25 | 23 | 7.8 |
| D | 6 | 83 | 70 | 6.06 | 25 | 23 | 7.8 |
Histogram calculated using DETX and DETY for each event in the final _common_clean file
| Quadrant A | 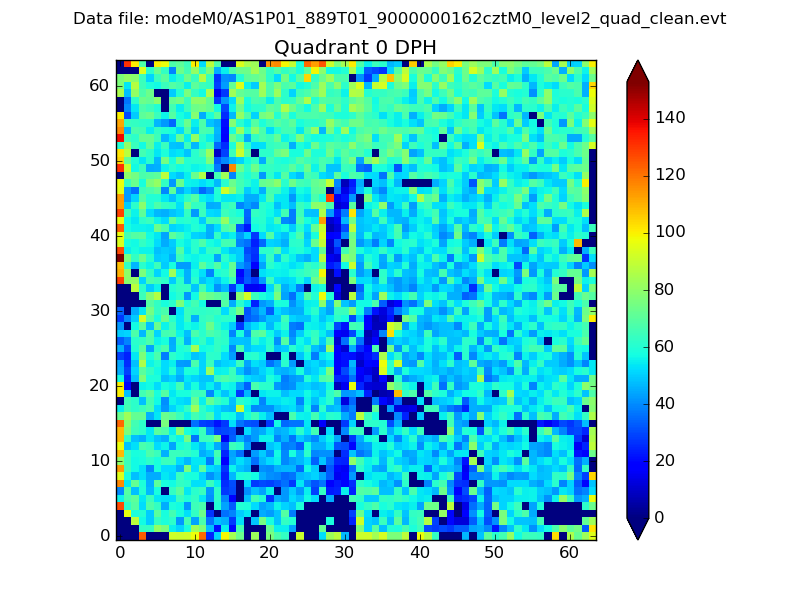 |
 |
Quadrant B |
|---|---|---|---|
| Quadrant D |  |
 |
Quadrant C |
| Plot type | Count rate plots | Images |
|---|---|---|
| Comparison with Poisson distribution Blue bars denote a histogram of data divided into 1 sec bins. Red curve is a Poisson curve with rate = median count rate of data. |
 |
 |
| Quadrant-wise count rates Data is divided into 100 sec bins |
 |
|
| Module-wise count rates for Quadrant A Data is divided into 100 sec bins |
 |
 |
| Module-wise count rates for Quadrant B Data is divided into 100 sec bins |
 |
 |
| Module-wise count rates for Quadrant C Data is divided into 100 sec bins |
 |
 |
| Module-wise count rates for Quadrant D Data is divided into 100 sec bins |
 |
 |
| Parameter | Plot |
|---|---|
| CZT HV Monitor |  |
| D_VDD | 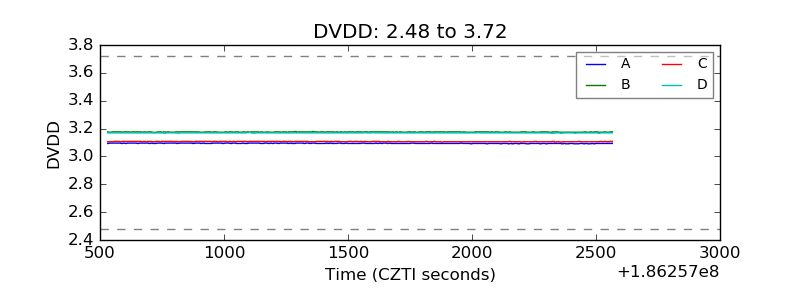 |
| Temperature 1 |  |
| Veto HV Monitor |  |
| Veto LLD |  |
| Alpha Counter |  |
| _CPM_Rate |  |
| CZT Counter |  |
| +2.5 Volts monitor |  |
| +5 Volts monitor |  |
| _ROLL_ROT |  |
| _Roll_DEC |  |
| _Roll_RA |  |
| Veto Counter |  |