| Param | Original file | Final file |
|---|---|---|
| Filename | modeM0/AS1P01_889T01_9000000162_00884cztM0_level2.evt | modeM0/AS1P01_889T01_9000000162_00884cztM0_level2_quad_clean.evt |
| Size (bytes) | 350,118,720 | 32,708,160 |
| Size | 333.9 MB | 31.2 MB |
| Events in quadrant A | 2,343,526 | 216,655 |
| Events in quadrant B | 3,626,098 | 197,103 |
| Events in quadrant C | 2,047,351 | 217,544 |
| Events in quadrant D | 2,447,799 | 209,737 |
| Mode M0 | |||
|---|---|---|---|
| Quadrant | BADHDUFLAG | Total packets | Discarded packets |
| A | 0 | 8405 | 0 |
| B | 0 | 12266 | 0 |
| C | 0 | 7538 | 0 |
| D | 0 | 8733 | 0 |
| Mode SS | |||
|---|---|---|---|
| Quadrant | BADHDUFLAG | Total packets | Discarded packets |
| A | 0 | 42 | 0 |
| B | 0 | 42 | 0 |
| C | 0 | 42 | 0 |
| D | 0 | 42 | 0 |
| Quadrant | Total seconds | Saturated seconds | Saturation percentage |
|---|---|---|---|
| A | 2047 | 1 | 0.048852% |
| B | 2046 | 342 | 16.715543% |
| C | 2047 | 0 | 0.000000% |
| D | 2046 | 15 | 0.733138% |
Noise dominated data is calculated using 1-second bins in cleaned event files. If a bin has >2000 counts, and if more than 50% of those come from <1% of pixels, then it is considered to be noise-dominated and hence unusable.
| Quadrant | # 1 sec bins | Bins with >0 counts | Bins with >2000 counts | High rate bins dominated by noise | Noise dominated (total time) | Noise dominated (detector-on time) | Marked lightcurve |
|---|---|---|---|---|---|---|---|
| A | 2047 | 2047 | 32 | 32 | 1.56% | 1.56% | 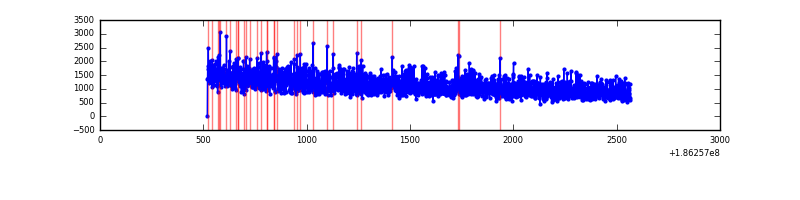 |
| B | 2047 | 2047 | 634 | 634 | 30.97% | 30.97% | 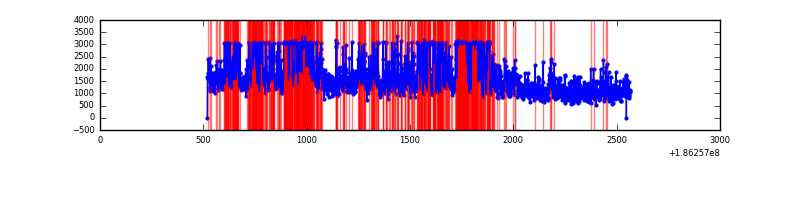 |
| C | 2047 | 2047 | 2 | 2 | 0.10% | 0.10% |  |
| D | 2047 | 2047 | 133 | 133 | 6.50% | 6.50% |  |
Top three noisy pixels from each quadrant. If the there are fewer than three noisy pixels in the level2.evt file, extra rows are filled as -1
| Pixel properties | Quadrant properties | ||||||
|---|---|---|---|---|---|---|---|
| Quadrant | DetID | PixID | Counts | Sigma | Mean | Median | Sigma |
| A | 14 | 170 | 140198 | 1002.85 | 573 | 581 | 139.2 |
| A | 14 | 79 | 2992 | 17.32 | 573 | 581 | 139.2 |
| A | 11 | 79 | 1923 | 9.64 | 573 | 581 | 139.2 |
| B | 3 | 0 | 1197260 | 9004.71 | 560 | 564 | 132.9 |
| B | 8 | 38 | 212612 | 1595.59 | 560 | 564 | 132.9 |
| B | 0 | 220 | 54616 | 406.72 | 560 | 564 | 132.9 |
| C | 3 | 111 | 7078 | 45.36 | 517 | 535 | 144.2 |
| C | 15 | 241 | 6931 | 44.34 | 517 | 535 | 144.2 |
| C | 3 | 79 | 4651 | 28.53 | 517 | 535 | 144.2 |
| D | 13 | 170 | 432789 | 2758.54 | 504 | 520 | 156.7 |
| D | 1 | 4 | 78354 | 496.7 | 504 | 520 | 156.7 |
| D | 13 | 72 | 14193 | 87.25 | 504 | 520 | 156.7 |
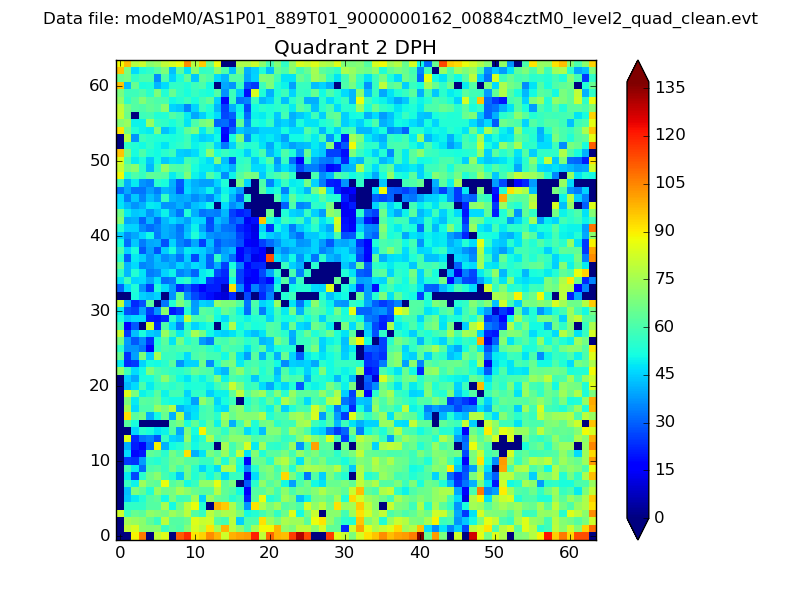
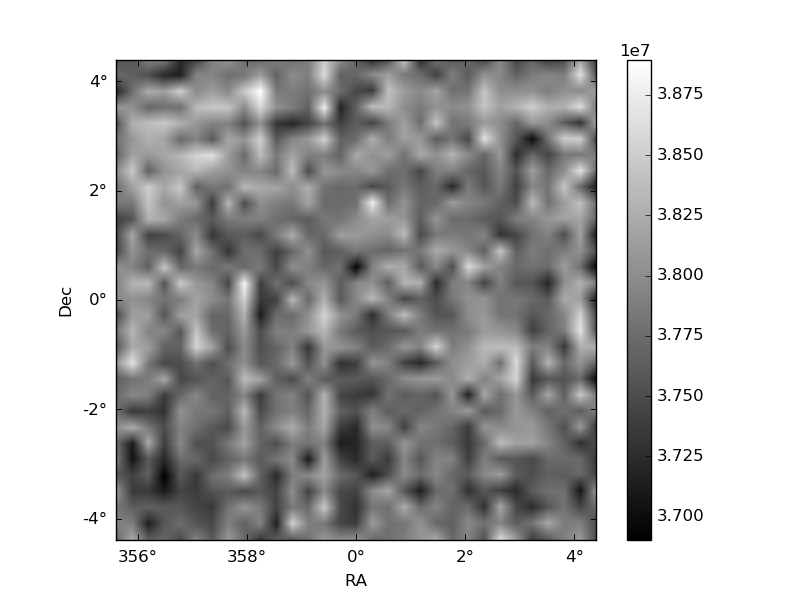
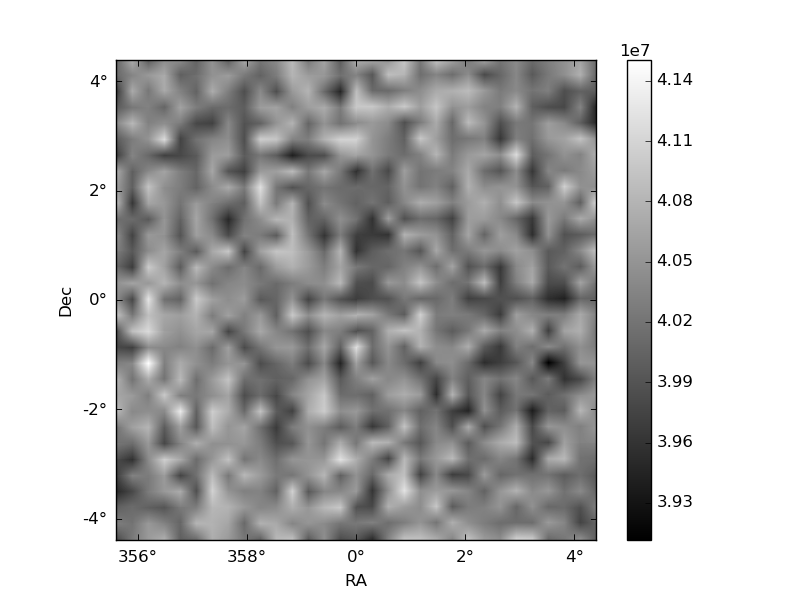
Histogram calculated using DETX and DETY for each event in the final _common_clean file
| Quadrant A | 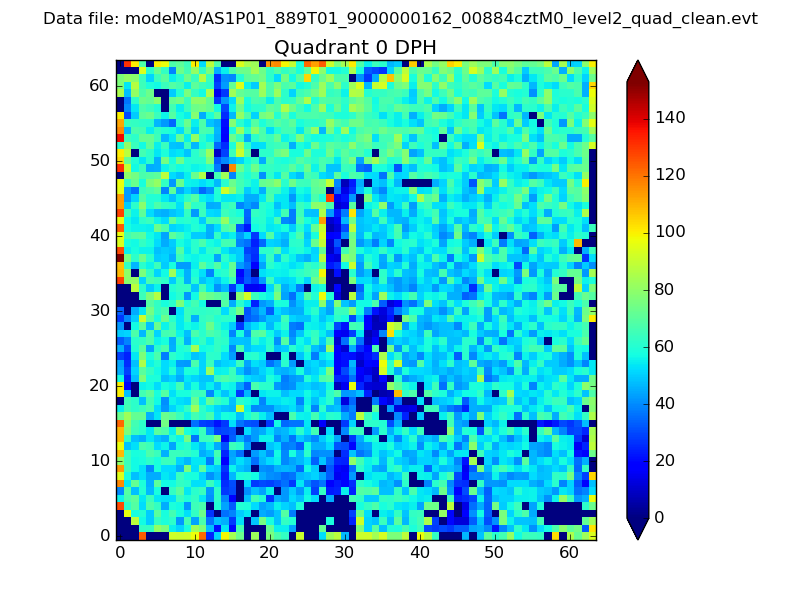 |
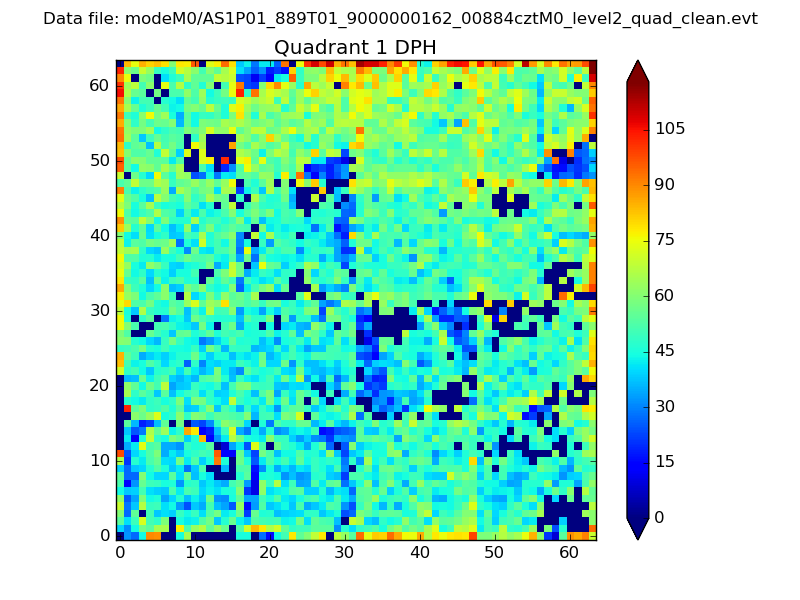 |
Quadrant B |
|---|---|---|---|
| Quadrant D | 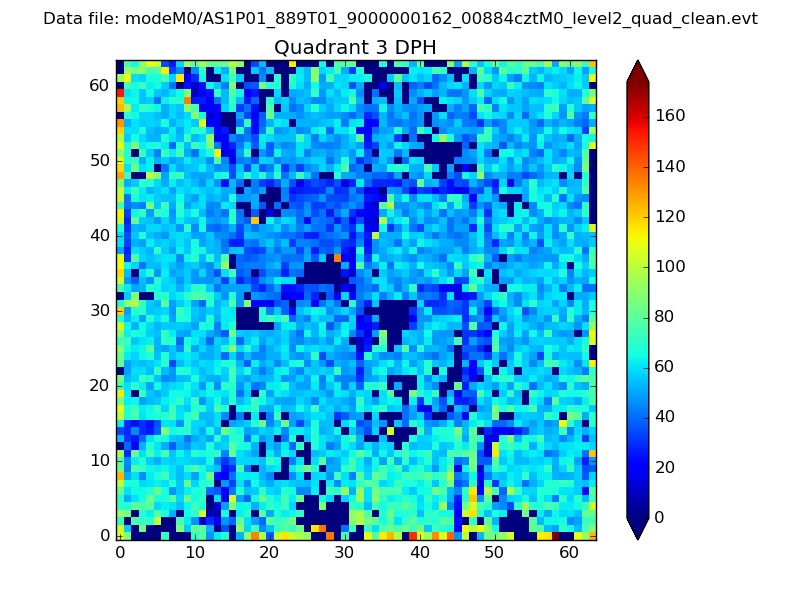 |
 |
Quadrant C |
| Plot type | Count rate plots | Images |
|---|---|---|
| Comparison with Poisson distribution Blue bars denote a histogram of data divided into 1 sec bins. Red curve is a Poisson curve with rate = median count rate of data. |
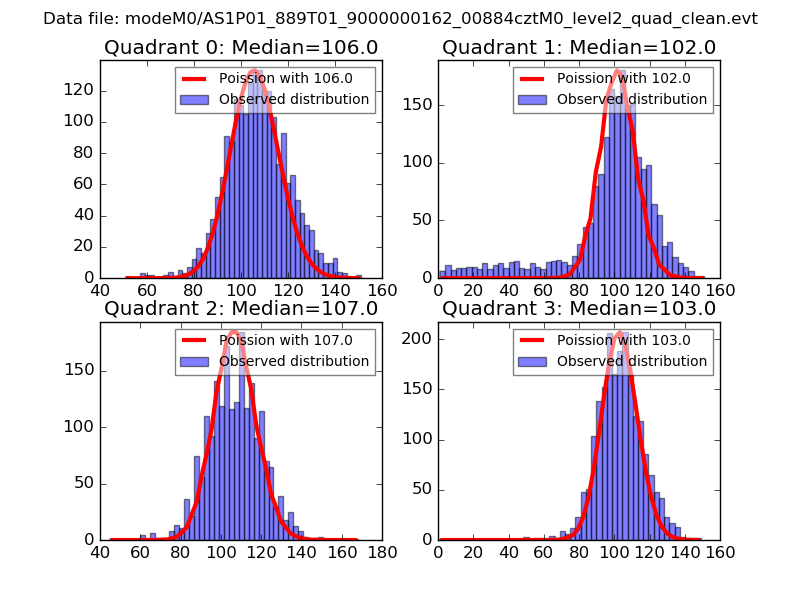 |
 |
| Quadrant-wise count rates Data is divided into 100 sec bins |
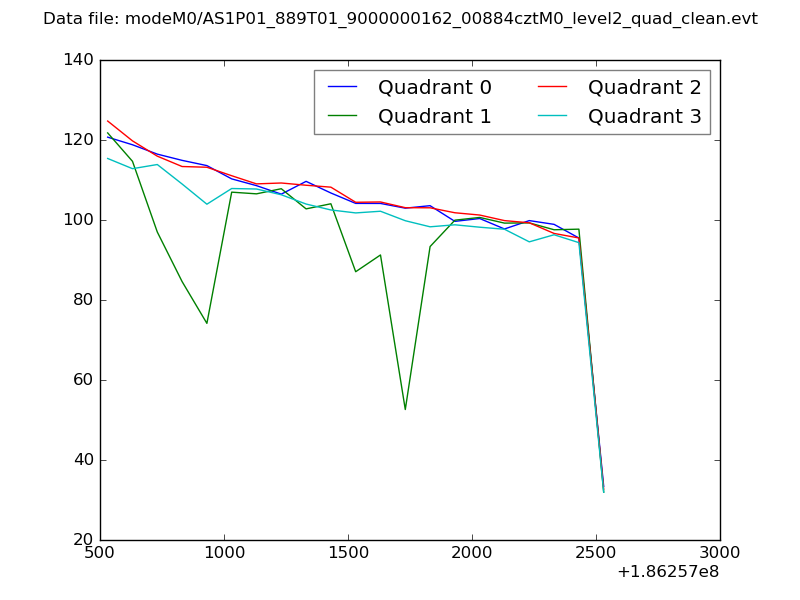 |
|
| Module-wise count rates for Quadrant A Data is divided into 100 sec bins |
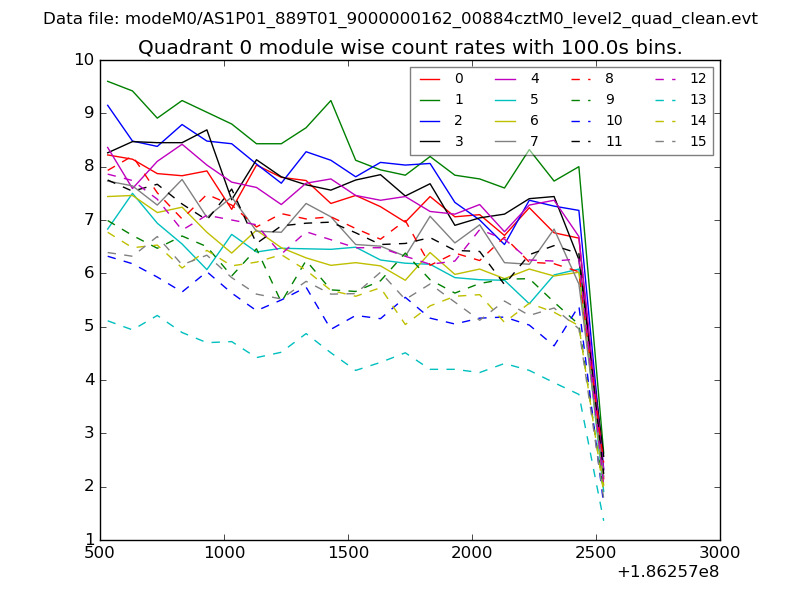 |
 |
| Module-wise count rates for Quadrant B Data is divided into 100 sec bins |
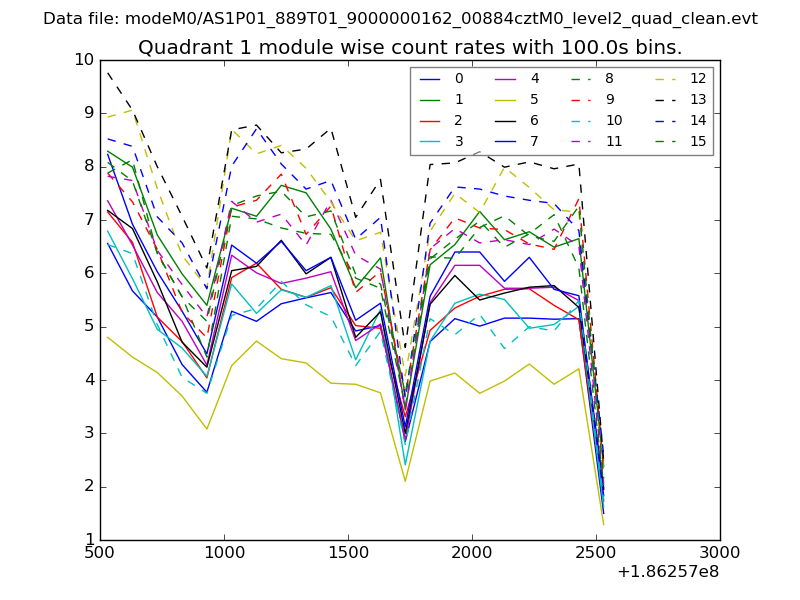 |
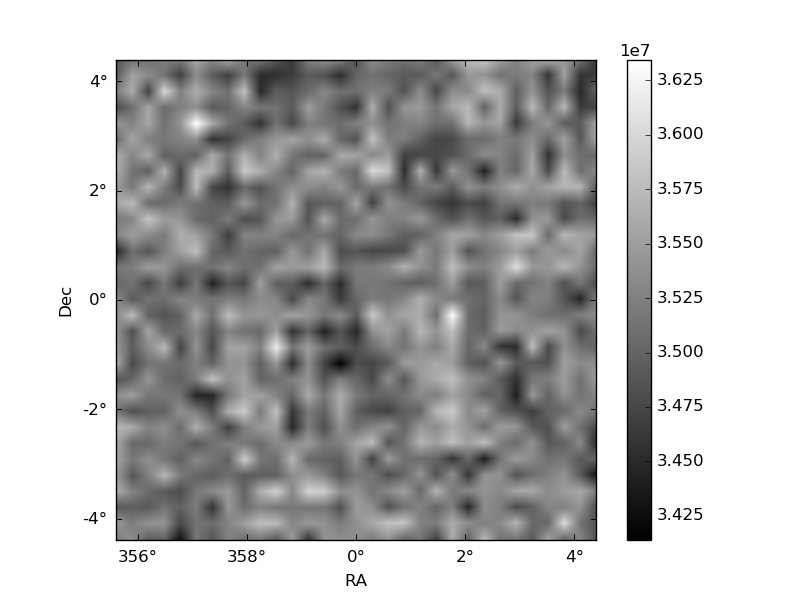 |
| Module-wise count rates for Quadrant C Data is divided into 100 sec bins |
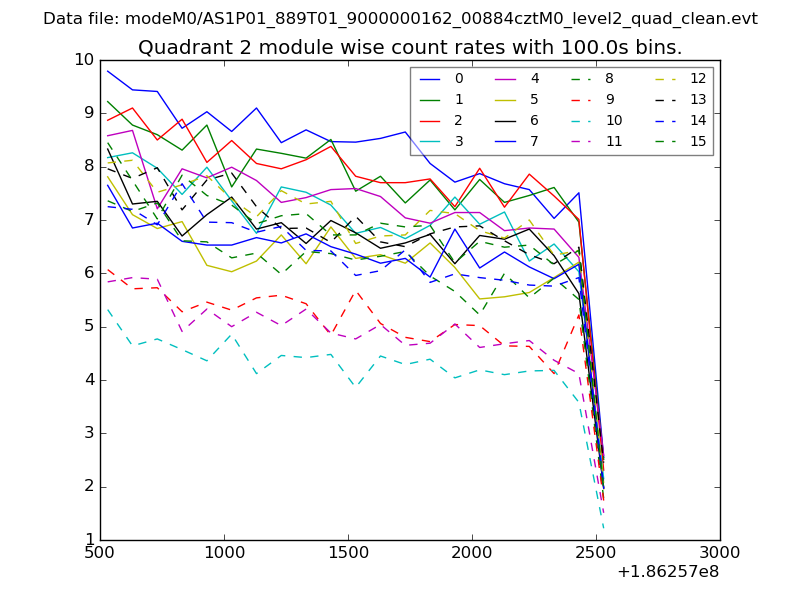 |
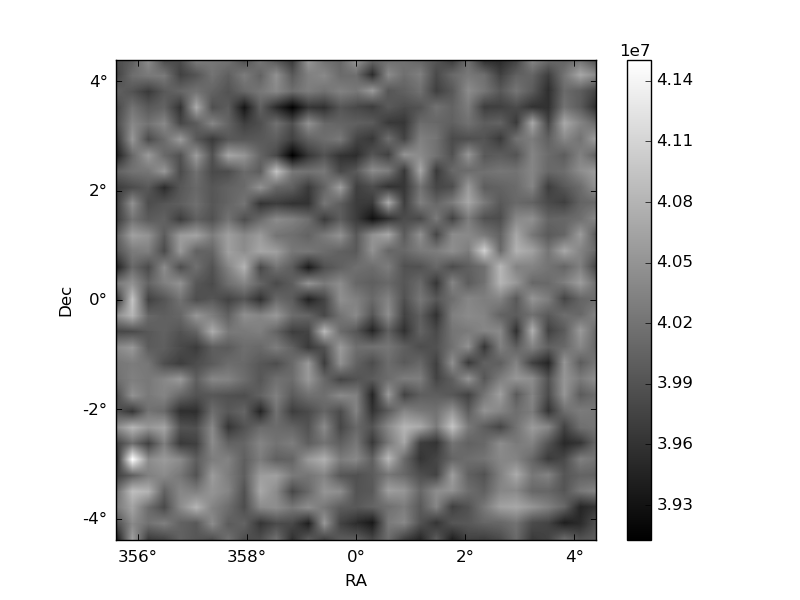 |
| Module-wise count rates for Quadrant D Data is divided into 100 sec bins |
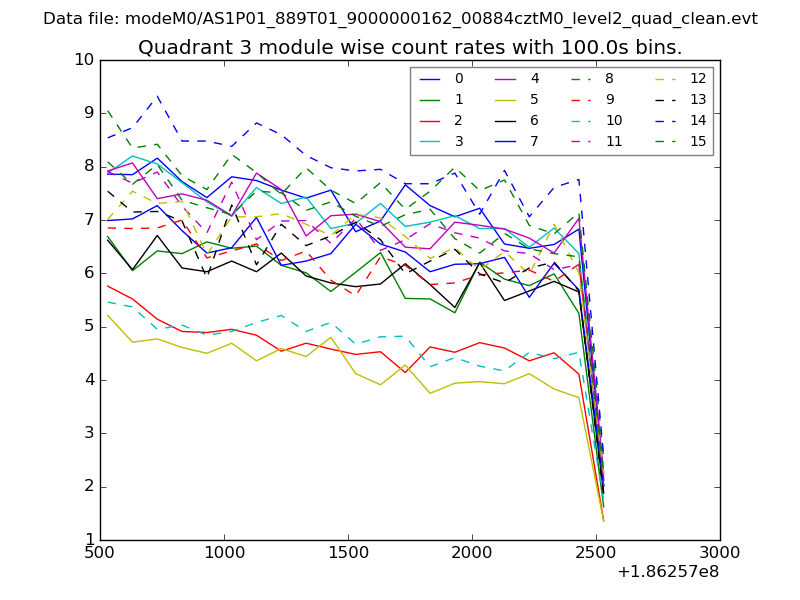 |
 |
| Parameter | Plot |
|---|---|
| CZT HV Monitor | 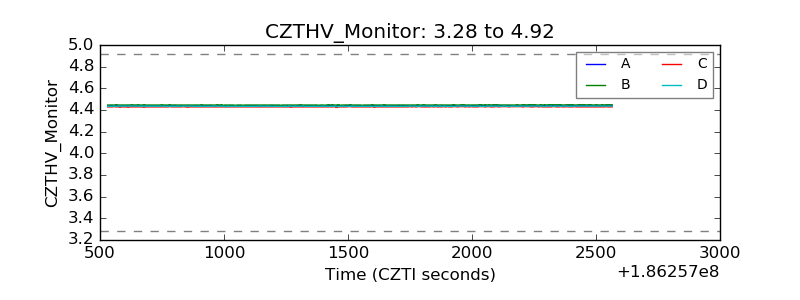 |
| D_VDD | 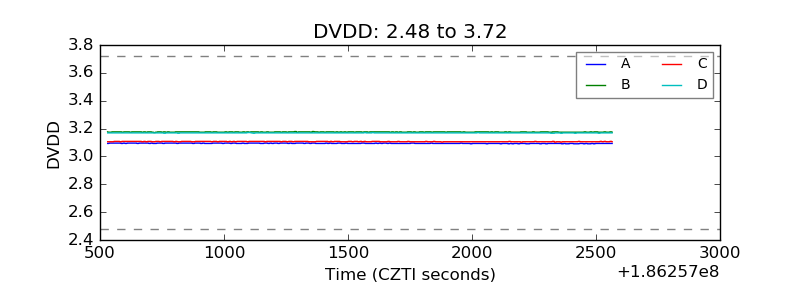 |
| Temperature 1 | 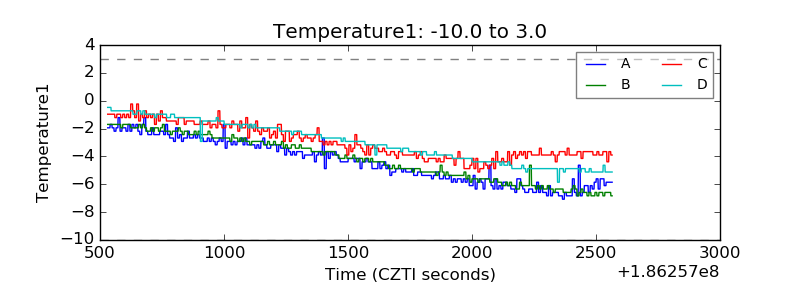 |
| Veto HV Monitor | 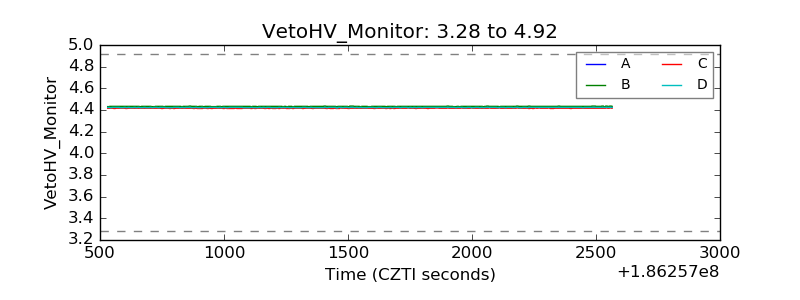 |
| Veto LLD |  |
| Alpha Counter | 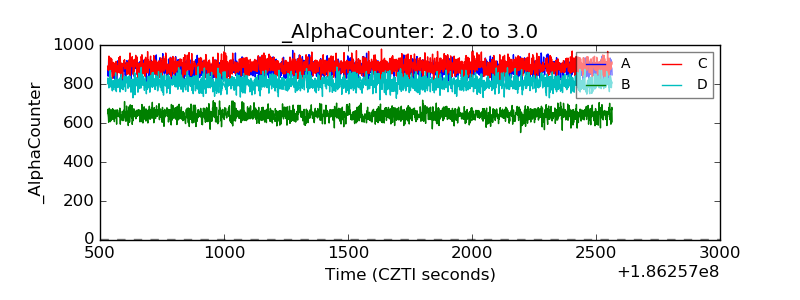 |
| _CPM_Rate | 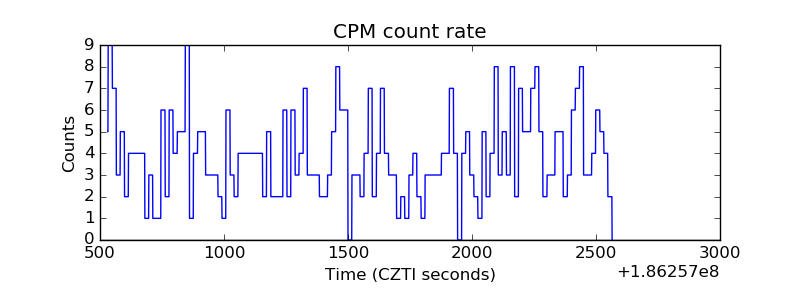 |
| CZT Counter | 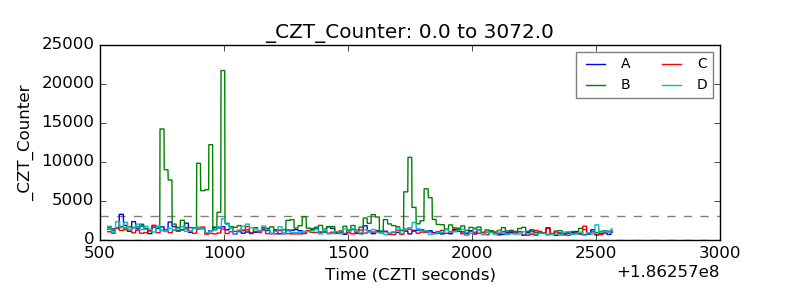 |
| +2.5 Volts monitor |  |
| +5 Volts monitor |  |
| _ROLL_ROT | 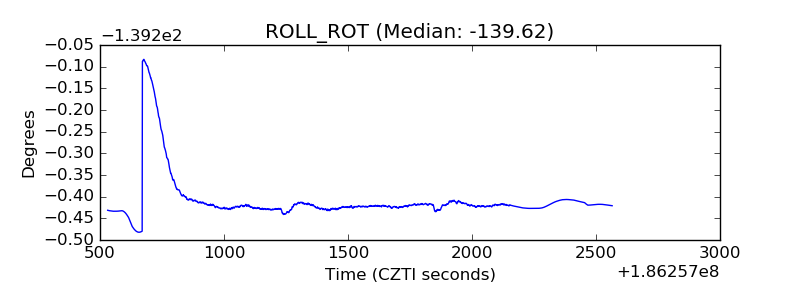 |
| _Roll_DEC | 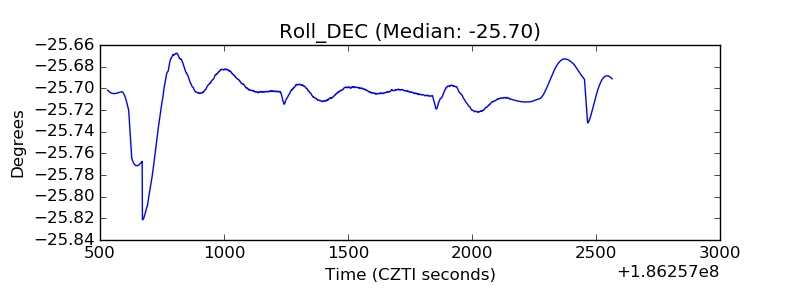 |
| _Roll_RA | 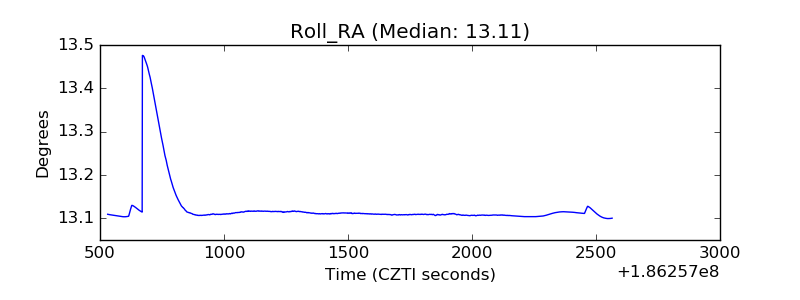 |
| Veto Counter | 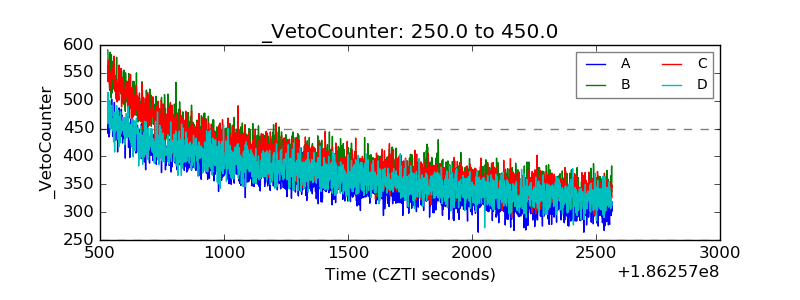 |