| Param | Original file | Final file |
|---|---|---|
| Filename | modeM0/AS1P01_889T01_9000000166cztM0_level2.fits | modeM0/AS1P01_889T01_9000000166cztM0_level2_quad_clean.evt |
| Size (bytes) | 14,037,120 | 5,555,520 |
| Size | 13.4 MB | 5.3 MB |
| Events in quadrant A | 83,774 | 10,914 |
| Events in quadrant B | 61,140 | 10,622 |
| Events in quadrant C | 82,576 | 9,999 |
| Events in quadrant D | 71,284 | 9,253 |
| Mode SS | |||
|---|---|---|---|
| Quadrant | BADHDUFLAG | Total packets | Discarded packets |
| A | 0 | 34 | 0 |
| B | 0 | 34 | 0 |
| C | 0 | 34 | 0 |
| D | 0 | 34 | 0 |
| Mode M9 | |||
|---|---|---|---|
| Quadrant | BADHDUFLAG | Total packets | Discarded packets |
| A | 0 | 3 | 0 |
| B | 0 | 3 | 0 |
| C | 0 | 3 | 0 |
| D | 0 | 3 | 0 |
| Mode M0 | |||
|---|---|---|---|
| Quadrant | BADHDUFLAG | Total packets | Discarded packets |
| A | 0 | 6819 | 0 |
| B | 0 | 12025 | 0 |
| C | 0 | 6402 | 0 |
| D | 0 | 6402 | 0 |
| Quadrant | Total seconds | Saturated seconds | Saturation percentage |
|---|---|---|---|
| A | 1722 | 2 | 0.116144% |
| B | 1722 | 624 | 36.236934% |
| C | 1722 | 1 | 0.058072% |
| D | 1722 | 2 | 0.116144% |
Noise dominated data is calculated using 1-second bins in cleaned event files. If a bin has >2000 counts, and if more than 50% of those come from <1% of pixels, then it is considered to be noise-dominated and hence unusable.
| Quadrant | # 1 sec bins | Bins with >0 counts | Bins with >2000 counts | High rate bins dominated by noise | Noise dominated (total time) | Noise dominated (detector-on time) | Marked lightcurve |
|---|---|---|---|---|---|---|---|
| A | 1720 | 1720 | 0 | 0 | 0.00% | 0.00% |  |
| B | 1720 | 1610 | 0 | 0 | 0.00% | 0.00% |  |
| C | 1720 | 1720 | 0 | 0 | 0.00% | 0.00% |  |
| D | 1721 | 1721 | 0 | 0 | 0.00% | 0.00% |  |
Top three noisy pixels from each quadrant. If the there are fewer than three noisy pixels in the level2.evt file, extra rows are filled as -1
| Pixel properties | Quadrant properties | ||||||
|---|---|---|---|---|---|---|---|
| Quadrant | DetID | PixID | Counts | Sigma | Mean | Median | Sigma |
| A | 7 | 110 | 84 | 9.22 | 21 | 20 | 6.9 |
| A | 0 | 29 | 72 | 7.49 | 21 | 20 | 6.9 |
| A | 12 | 45 | 67 | 6.77 | 21 | 20 | 6.9 |
| B | 14 | 254 | 55 | 8.11 | 16 | 15 | 4.9 |
| B | 5 | 128 | 49 | 6.89 | 16 | 15 | 4.9 |
| B | 2 | 9 | 49 | 6.89 | 16 | 15 | 4.9 |
| C | 3 | 202 | 71 | 7.32 | 21 | 20 | 7.0 |
| C | 12 | 250 | 61 | 5.88 | 21 | 20 | 7.0 |
| C | 3 | 203 | 59 | 5.6 | 21 | 20 | 7.0 |
| D | 15 | 30 | 68 | 7.69 | 20 | 18 | 6.5 |
| D | 15 | 46 | 59 | 6.3 | 20 | 18 | 6.5 |
| D | 4 | 160 | 56 | 5.84 | 20 | 18 | 6.5 |
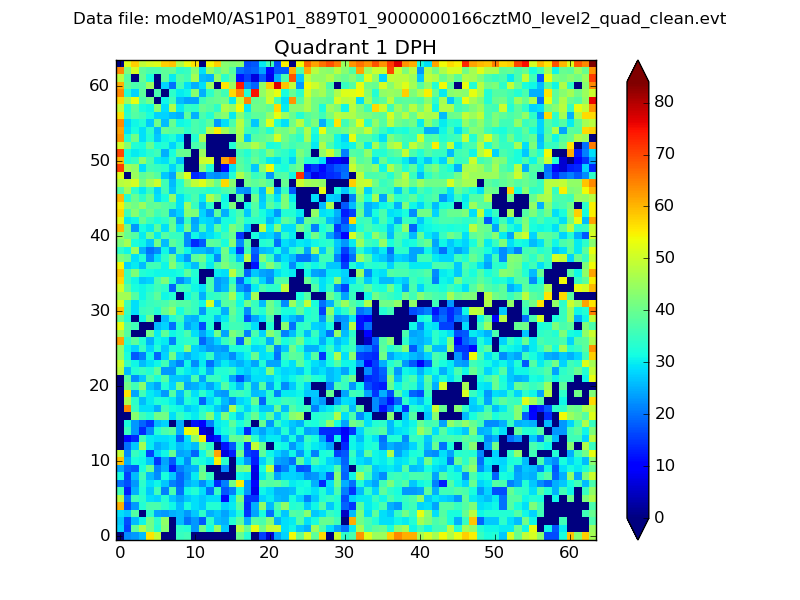
Histogram calculated using DETX and DETY for each event in the final _common_clean file
| Quadrant A |  |
 |
Quadrant B |
|---|---|---|---|
| Quadrant D |  |
 |
Quadrant C |
| Plot type | Count rate plots | Images |
|---|---|---|
| Comparison with Poisson distribution Blue bars denote a histogram of data divided into 1 sec bins. Red curve is a Poisson curve with rate = median count rate of data. |
 |
 |
| Quadrant-wise count rates Data is divided into 100 sec bins |
 |
|
| Module-wise count rates for Quadrant A Data is divided into 100 sec bins |
 |
 |
| Module-wise count rates for Quadrant B Data is divided into 100 sec bins |
 |
 |
| Module-wise count rates for Quadrant C Data is divided into 100 sec bins |
 |
 |
| Module-wise count rates for Quadrant D Data is divided into 100 sec bins |
 |
 |
| Parameter | Plot |
|---|---|
| CZT HV Monitor |  |
| D_VDD |  |
| Temperature 1 |  |
| Veto HV Monitor |  |
| Veto LLD |  |
| Alpha Counter |  |
| _CPM_Rate |  |
| CZT Counter |  |
| +2.5 Volts monitor |  |
| +5 Volts monitor |  |
| _ROLL_ROT |  |
| _Roll_DEC |  |
| _Roll_RA |  |
| Veto Counter |  |