| Param | Original file | Final file |
|---|---|---|
| Filename | modeM0/AS1P01_889T01_9000000174cztM0_level2.fits | modeM0/AS1P01_889T01_9000000174cztM0_level2_quad_clean.evt |
| Size (bytes) | 14,212,800 | 10,990,080 |
| Size | 13.6 MB | 10.5 MB |
| Events in quadrant A | 82,138 | 56,149 |
| Events in quadrant B | 77,560 | 51,704 |
| Events in quadrant C | 80,584 | 53,916 |
| Events in quadrant D | 69,946 | 49,831 |
| Mode M9 | |||
|---|---|---|---|
| Quadrant | BADHDUFLAG | Total packets | Discarded packets |
| A | 0 | 4 | 0 |
| B | 0 | 4 | 0 |
| C | 0 | 4 | 0 |
| D | 0 | 4 | 0 |
| Mode M0 | |||
|---|---|---|---|
| Quadrant | BADHDUFLAG | Total packets | Discarded packets |
| A | 0 | 7406 | 0 |
| B | 0 | 9716 | 0 |
| C | 0 | 7224 | 0 |
| D | 0 | 6956 | 0 |
| Mode SS | |||
|---|---|---|---|
| Quadrant | BADHDUFLAG | Total packets | Discarded packets |
| A | 0 | 34 | 0 |
| B | 0 | 34 | 0 |
| C | 0 | 34 | 0 |
| D | 0 | 34 | 0 |
| Quadrant | Total seconds | Saturated seconds | Saturation percentage |
|---|---|---|---|
| A | 1635 | 1 | 0.061162% |
| B | 1635 | 166 | 10.152905% |
| C | 1634 | 5 | 0.305998% |
| D | 1635 | 3 | 0.183486% |
Noise dominated data is calculated using 1-second bins in cleaned event files. If a bin has >2000 counts, and if more than 50% of those come from <1% of pixels, then it is considered to be noise-dominated and hence unusable.
| Quadrant | # 1 sec bins | Bins with >0 counts | Bins with >2000 counts | High rate bins dominated by noise | Noise dominated (total time) | Noise dominated (detector-on time) | Marked lightcurve |
|---|---|---|---|---|---|---|---|
| A | 2049 | 1634 | 0 | 0 | 0.00% | 0.00% |  |
| B | 2050 | 1634 | 0 | 0 | 0.00% | 0.00% |  |
| C | 2050 | 1635 | 0 | 0 | 0.00% | 0.00% |  |
| D | 2050 | 1635 | 0 | 0 | 0.00% | 0.00% | 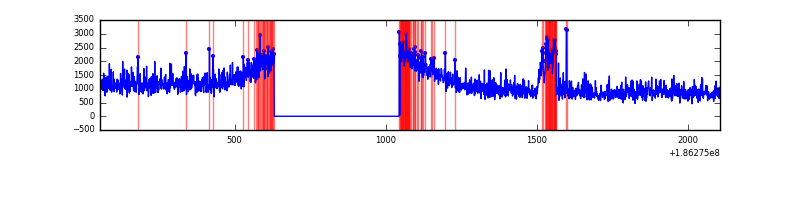 |
Top three noisy pixels from each quadrant. If the there are fewer than three noisy pixels in the level2.evt file, extra rows are filled as -1
| Pixel properties | Quadrant properties | ||||||
|---|---|---|---|---|---|---|---|
| Quadrant | DetID | PixID | Counts | Sigma | Mean | Median | Sigma |
| A | 0 | 29 | 77 | 8.01 | 21 | 20 | 7.1 |
| A | 7 | 110 | 75 | 7.73 | 21 | 20 | 7.1 |
| A | 15 | 47 | 73 | 7.45 | 21 | 20 | 7.1 |
| B | 14 | 253 | 63 | 7.54 | 20 | 19 | 5.8 |
| B | 14 | 254 | 62 | 7.37 | 20 | 19 | 5.8 |
| B | 5 | 225 | 60 | 7.03 | 20 | 19 | 5.8 |
| C | 12 | 241 | 68 | 6.94 | 21 | 20 | 6.9 |
| C | 3 | 202 | 64 | 6.36 | 21 | 20 | 6.9 |
| C | 14 | 225 | 58 | 5.49 | 21 | 20 | 6.9 |
| D | 1 | 3 | 69 | 7.87 | 19 | 18 | 6.5 |
| D | 15 | 30 | 56 | 5.87 | 19 | 18 | 6.5 |
| D | 3 | 22 | 56 | 5.87 | 19 | 18 | 6.5 |
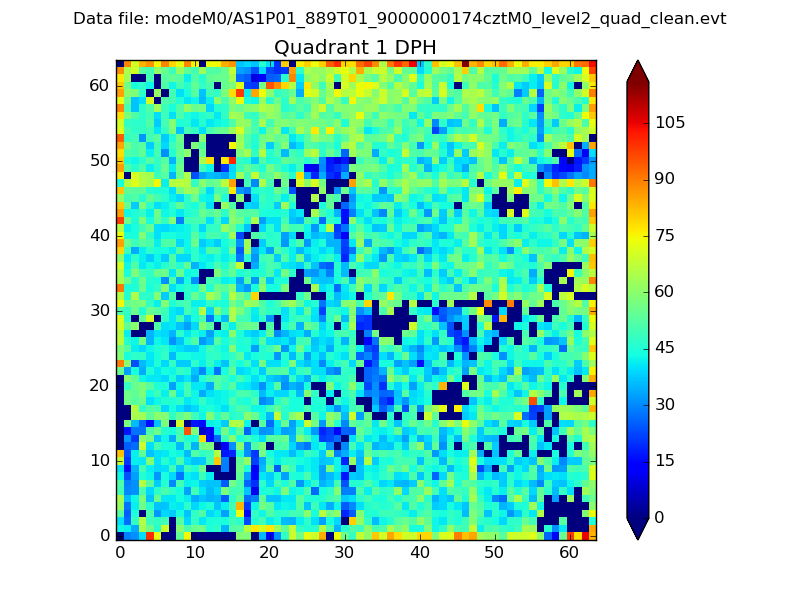
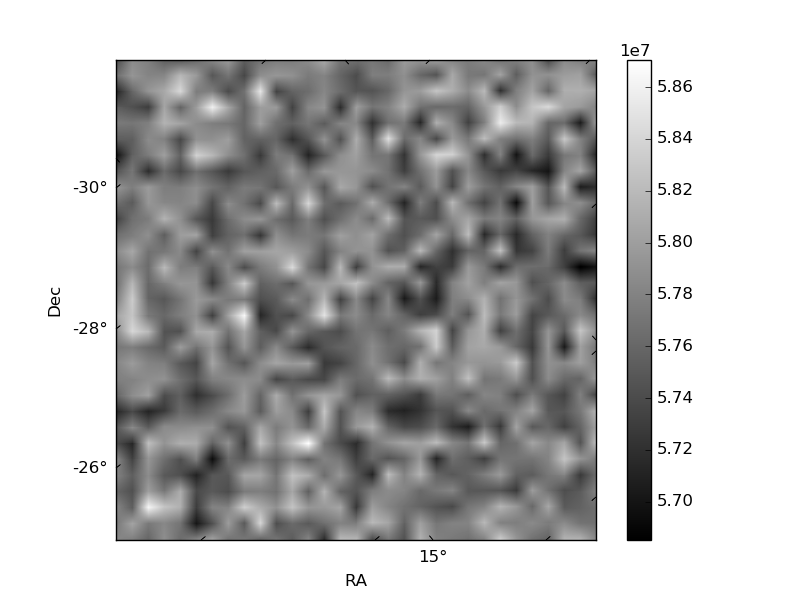
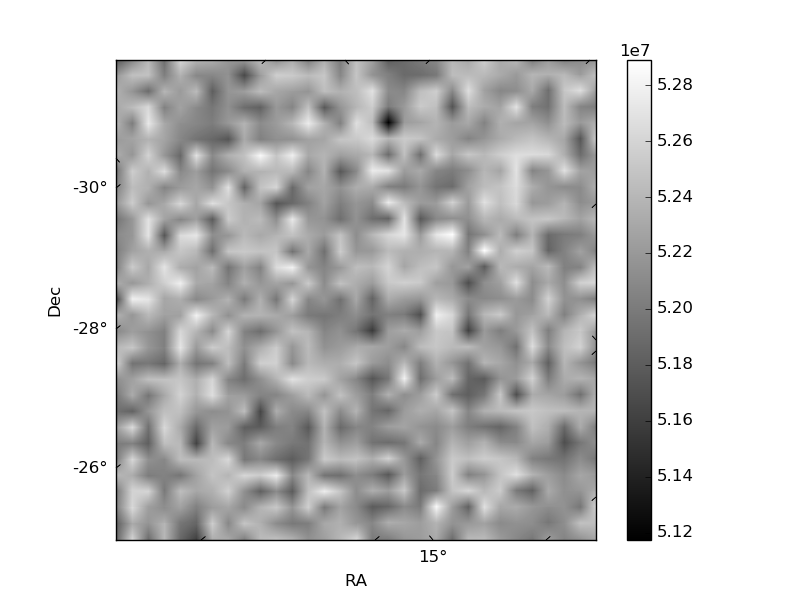
Histogram calculated using DETX and DETY for each event in the final _common_clean file
| Quadrant A |  |
 |
Quadrant B |
|---|---|---|---|
| Quadrant D | 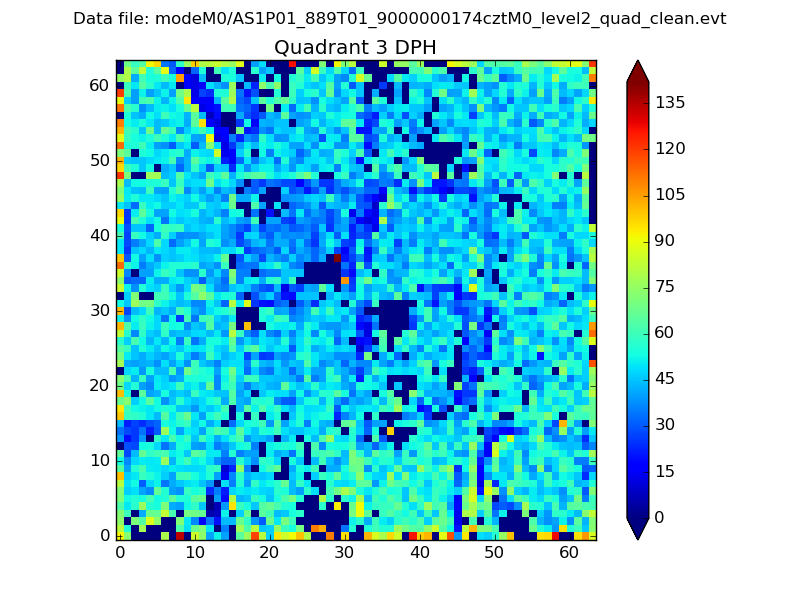 |
 |
Quadrant C |
| Plot type | Count rate plots | Images |
|---|---|---|
| Comparison with Poisson distribution Blue bars denote a histogram of data divided into 1 sec bins. Red curve is a Poisson curve with rate = median count rate of data. |
 |
 |
| Quadrant-wise count rates Data is divided into 100 sec bins |
 |
|
| Module-wise count rates for Quadrant A Data is divided into 100 sec bins |
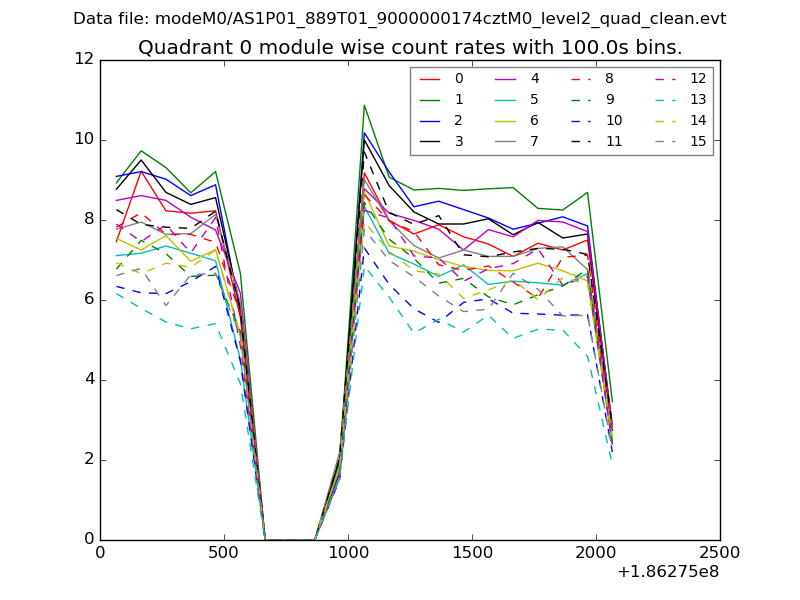 |
 |
| Module-wise count rates for Quadrant B Data is divided into 100 sec bins |
 |
 |
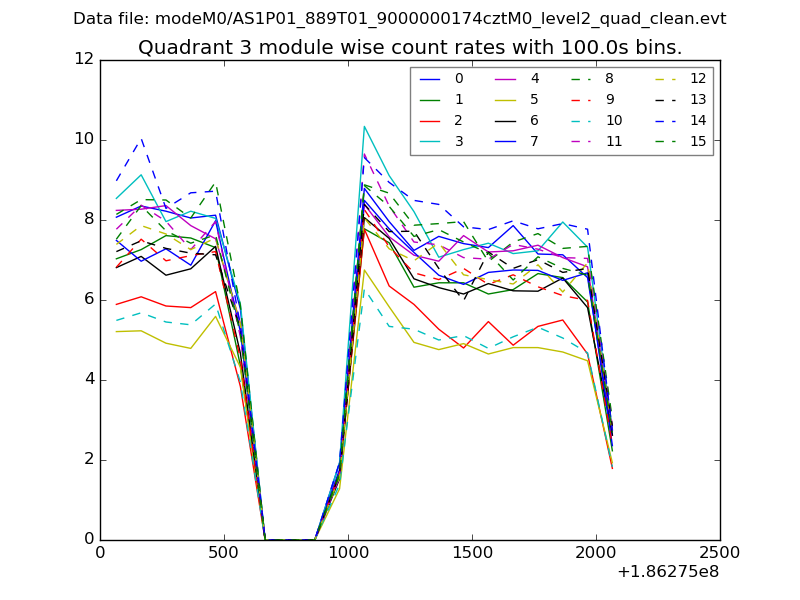
| Module-wise count rates for Quadrant C Data is divided into 100 sec bins |
 |
 |
| Module-wise count rates for Quadrant D Data is divided into 100 sec bins |
 |
 |
| Parameter | Plot |
|---|---|
| CZT HV Monitor |  |
| D_VDD | 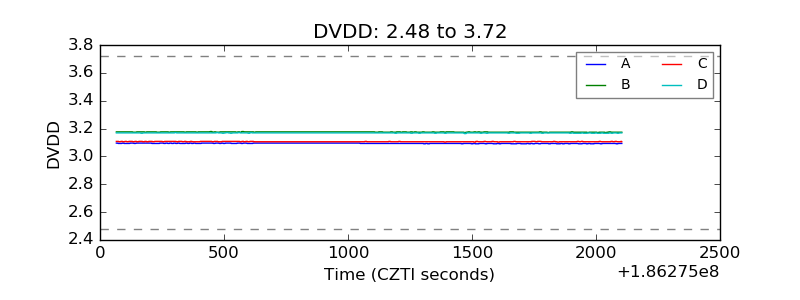 |
| Temperature 1 |  |
| Veto HV Monitor |  |
| Veto LLD |  |
| Alpha Counter |  |
| _CPM_Rate | 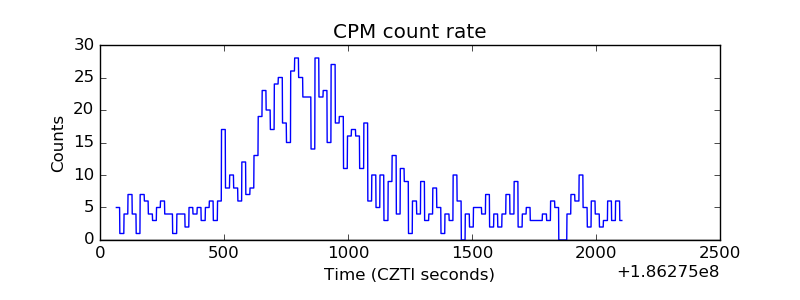 |
| CZT Counter | 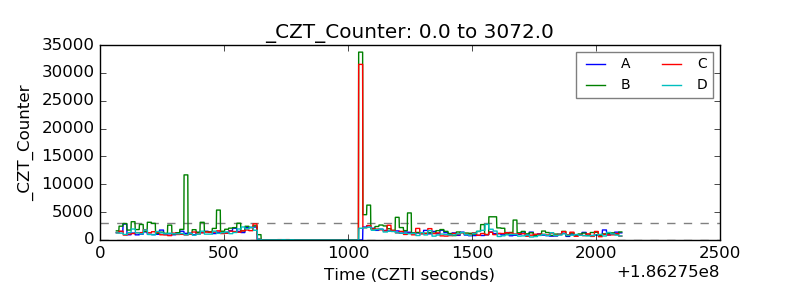 |
| +2.5 Volts monitor |  |
| +5 Volts monitor |  |
| _ROLL_ROT |  |
| _Roll_DEC |  |
| _Roll_RA | 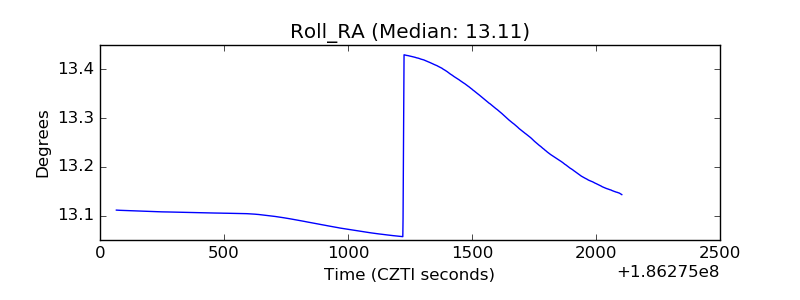 |
| Veto Counter |  |