| Param | Original file | Final file |
|---|---|---|
| Filename | modeM0/AS1P01_999T99_9000000136cztM0_level2.fits | modeM0/AS1P01_999T99_9000000136cztM0_level2_quad_clean.evt |
| Size (bytes) | 13,947,840 | 8,124,480 |
| Size | 13.3 MB | 7.7 MB |
| Events in quadrant A | 79,584 | 31,770 |
| Events in quadrant B | 78,740 | 31,608 |
| Events in quadrant C | 75,482 | 30,639 |
| Events in quadrant D | 66,374 | 28,378 |
| Mode SS | |||
|---|---|---|---|
| Quadrant | BADHDUFLAG | Total packets | Discarded packets |
| A | 0 | 34 | 0 |
| B | 0 | 34 | 0 |
| C | 0 | 34 | 0 |
| D | 0 | 34 | 0 |
| Mode M9 | |||
|---|---|---|---|
| Quadrant | BADHDUFLAG | Total packets | Discarded packets |
| A | 0 | 2 | 0 |
| B | 0 | 2 | 0 |
| C | 0 | 2 | 0 |
| D | 0 | 2 | 0 |
| Mode M0 | |||
|---|---|---|---|
| Quadrant | BADHDUFLAG | Total packets | Discarded packets |
| A | 0 | 7382 | 0 |
| B | 0 | 7556 | 0 |
| C | 0 | 6804 | 0 |
| D | 0 | 6538 | 0 |
| Quadrant | Total seconds | Saturated seconds | Saturation percentage |
|---|---|---|---|
| A | 1663 | 3 | 0.180397% |
| B | 1663 | 3 | 0.180397% |
| C | 1663 | 2 | 0.120265% |
| D | 1663 | 1 | 0.060132% |
Noise dominated data is calculated using 1-second bins in cleaned event files. If a bin has >2000 counts, and if more than 50% of those come from <1% of pixels, then it is considered to be noise-dominated and hence unusable.
| Quadrant | # 1 sec bins | Bins with >0 counts | Bins with >2000 counts | High rate bins dominated by noise | Noise dominated (total time) | Noise dominated (detector-on time) | Marked lightcurve |
|---|---|---|---|---|---|---|---|
| A | 1662 | 1662 | 0 | 0 | 0.00% | 0.00% |  |
| B | 1662 | 1662 | 0 | 0 | 0.00% | 0.00% |  |
| C | 1661 | 1661 | 0 | 0 | 0.00% | 0.00% |  |
| D | 1662 | 1662 | 0 | 0 | 0.00% | 0.00% |  |
Top three noisy pixels from each quadrant. If the there are fewer than three noisy pixels in the level2.evt file, extra rows are filled as -1
| Pixel properties | Quadrant properties | ||||||
|---|---|---|---|---|---|---|---|
| Quadrant | DetID | PixID | Counts | Sigma | Mean | Median | Sigma |
| A | 0 | 29 | 89 | 10.33 | 20 | 19 | 6.8 |
| A | 7 | 110 | 86 | 9.89 | 20 | 19 | 6.8 |
| A | 13 | 253 | 67 | 7.09 | 20 | 19 | 6.8 |
| B | 2 | 9 | 66 | 7.57 | 20 | 20 | 6.1 |
| B | 5 | 128 | 55 | 5.76 | 20 | 20 | 6.1 |
| B | 2 | 8 | 53 | 5.43 | 20 | 20 | 6.1 |
| C | 2 | 191 | 61 | 6.61 | 19 | 18 | 6.5 |
| C | 12 | 241 | 59 | 6.3 | 19 | 18 | 6.5 |
| C | 9 | 233 | 57 | 6.0 | 19 | 18 | 6.5 |
| D | 6 | 67 | 58 | 6.64 | 18 | 17 | 6.2 |
| D | 11 | 82 | 55 | 6.15 | 18 | 17 | 6.2 |
| D | 6 | 114 | 53 | 5.83 | 18 | 17 | 6.2 |
Histogram calculated using DETX and DETY for each event in the final _common_clean file
| Quadrant A |  |
 |
Quadrant B |
|---|---|---|---|
| Quadrant D | 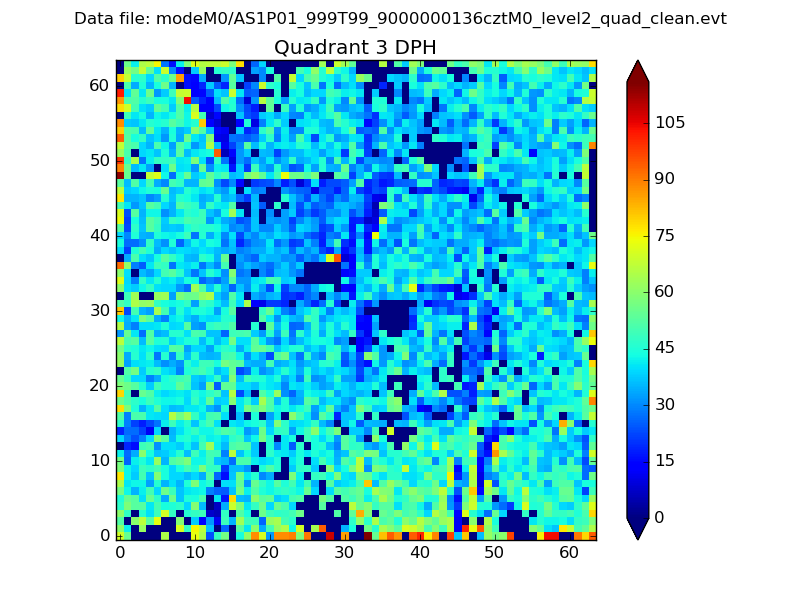 |
 |
Quadrant C |
| Plot type | Count rate plots | Images |
|---|---|---|
| Comparison with Poisson distribution Blue bars denote a histogram of data divided into 1 sec bins. Red curve is a Poisson curve with rate = median count rate of data. |
 |
 |
| Quadrant-wise count rates Data is divided into 100 sec bins |
 |
|
| Module-wise count rates for Quadrant A Data is divided into 100 sec bins |
 |
 |
| Module-wise count rates for Quadrant B Data is divided into 100 sec bins |
 |
 |
| Module-wise count rates for Quadrant C Data is divided into 100 sec bins |
 |
 |
| Module-wise count rates for Quadrant D Data is divided into 100 sec bins |
 |
 |
| Parameter | Plot |
|---|---|
| CZT HV Monitor |  |
| D_VDD | 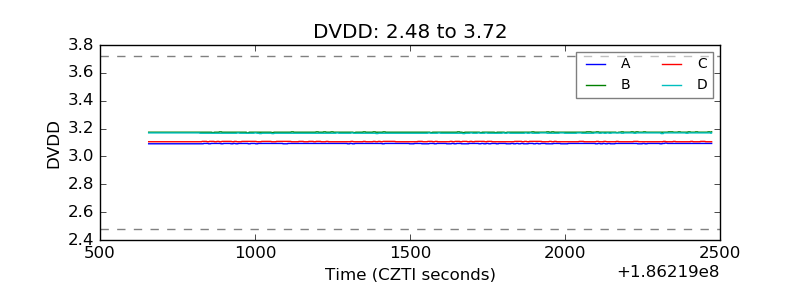 |
| Temperature 1 |  |
| Veto HV Monitor | 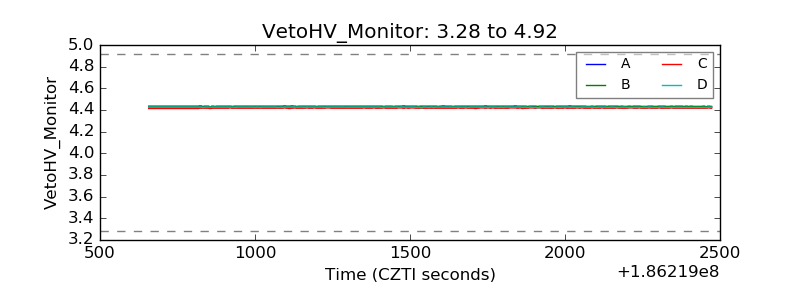 |
| Veto LLD |  |
| Alpha Counter |  |
| _CPM_Rate |  |
| CZT Counter |  |
| +2.5 Volts monitor |  |
| +5 Volts monitor |  |
| _ROLL_ROT |  |
| _Roll_DEC |  |
| _Roll_RA |  |
| Veto Counter |  |