| Param | Original file | Final file |
|---|---|---|
| Filename | modeM0/AS1P01_999T99_9000000144_00880cztM0_level2.evt | modeM0/AS1P01_999T99_9000000144_00880cztM0_level2_quad_clean.evt |
| Size (bytes) | 198,383,040 | 15,016,320 |
| Size | 189.2 MB | 14.3 MB |
| Events in quadrant A | 1,413,538 | 97,781 |
| Events in quadrant B | 1,658,334 | 97,631 |
| Events in quadrant C | 1,613,249 | 95,161 |
| Events in quadrant D | 1,261,438 | 93,936 |
| Mode M9 | |||
|---|---|---|---|
| Quadrant | BADHDUFLAG | Total packets | Discarded packets |
| A | 0 | 9 | 0 |
| B | 0 | 9 | 0 |
| C | 0 | 9 | 0 |
| D | 0 | 9 | 0 |
| Mode SS | |||
|---|---|---|---|
| Quadrant | BADHDUFLAG | Total packets | Discarded packets |
| A | 0 | 22 | 0 |
| B | 0 | 22 | 0 |
| C | 0 | 22 | 0 |
| D | 0 | 22 | 0 |
| Mode M0 | |||
|---|---|---|---|
| Quadrant | BADHDUFLAG | Total packets | Discarded packets |
| A | 0 | 4825 | 1 |
| B | 0 | 5566 | 1 |
| C | 0 | 5431 | 1 |
| D | 0 | 4379 | 1 |
| Quadrant | Total seconds | Saturated seconds | Saturation percentage |
|---|---|---|---|
| A | 884 | 68 | 7.692308% |
| B | 884 | 105 | 11.877828% |
| C | 884 | 77 | 8.710407% |
| D | 884 | 58 | 6.561086% |
Noise dominated data is calculated using 1-second bins in cleaned event files. If a bin has >2000 counts, and if more than 50% of those come from <1% of pixels, then it is considered to be noise-dominated and hence unusable.
| Quadrant | # 1 sec bins | Bins with >0 counts | Bins with >2000 counts | High rate bins dominated by noise | Noise dominated (total time) | Noise dominated (detector-on time) | Marked lightcurve |
|---|---|---|---|---|---|---|---|
| A | 1849 | 884 | 153 | 153 | 8.27% | 17.31% | 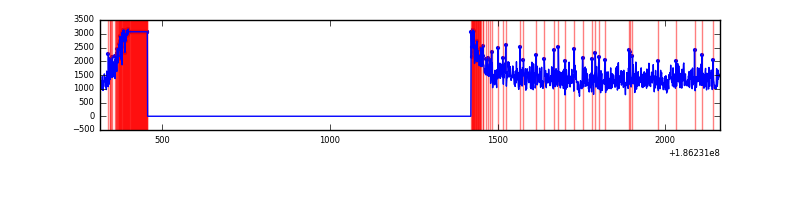 |
| B | 1849 | 884 | 285 | 285 | 15.41% | 32.24% | 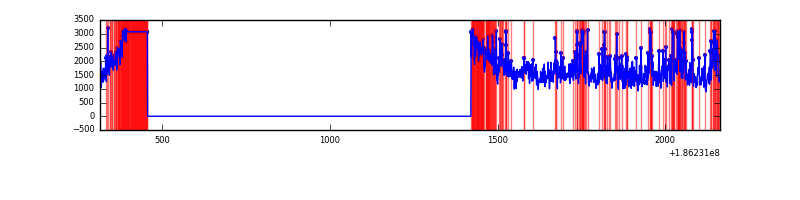 |
| C | 1849 | 884 | 255 | 255 | 13.79% | 28.85% | 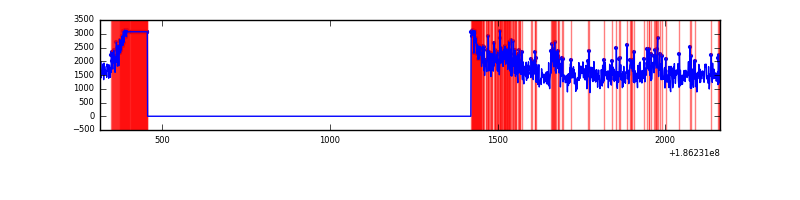 |
| D | 1849 | 884 | 111 | 111 | 6.00% | 12.56% | 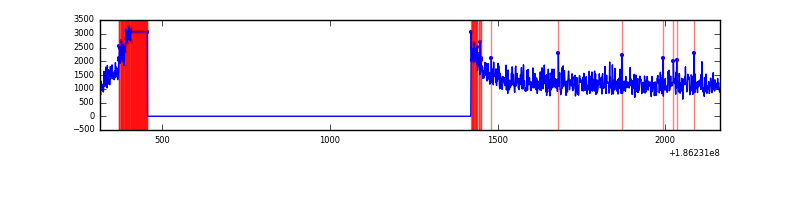 |
Top three noisy pixels from each quadrant. If the there are fewer than three noisy pixels in the level2.evt file, extra rows are filled as -1
| Pixel properties | Quadrant properties | ||||||
|---|---|---|---|---|---|---|---|
| Quadrant | DetID | PixID | Counts | Sigma | Mean | Median | Sigma |
| A | 11 | 79 | 1526 | 12.37 | 368 | 372 | 93.3 |
| A | 3 | 111 | 1323 | 10.19 | 368 | 372 | 93.3 |
| A | 14 | 203 | 945 | 6.14 | 368 | 372 | 93.3 |
| B | 8 | 38 | 257535 | 2909.26 | 355 | 356 | 88.4 |
| B | 0 | 220 | 38031 | 426.19 | 355 | 356 | 88.4 |
| B | 7 | 221 | 6842 | 73.37 | 355 | 356 | 88.4 |
| C | 9 | 83 | 328658 | 3445.75 | 326 | 337 | 95.3 |
| C | 7 | 159 | 4971 | 48.63 | 326 | 337 | 95.3 |
| C | 3 | 111 | 2790 | 25.74 | 326 | 337 | 95.3 |
| D | 1 | 4 | 5283 | 45.89 | 334 | 342 | 107.7 |
| D | 11 | 131 | 4955 | 42.84 | 334 | 342 | 107.7 |
| D | 10 | 125 | 2474 | 19.8 | 334 | 342 | 107.7 |
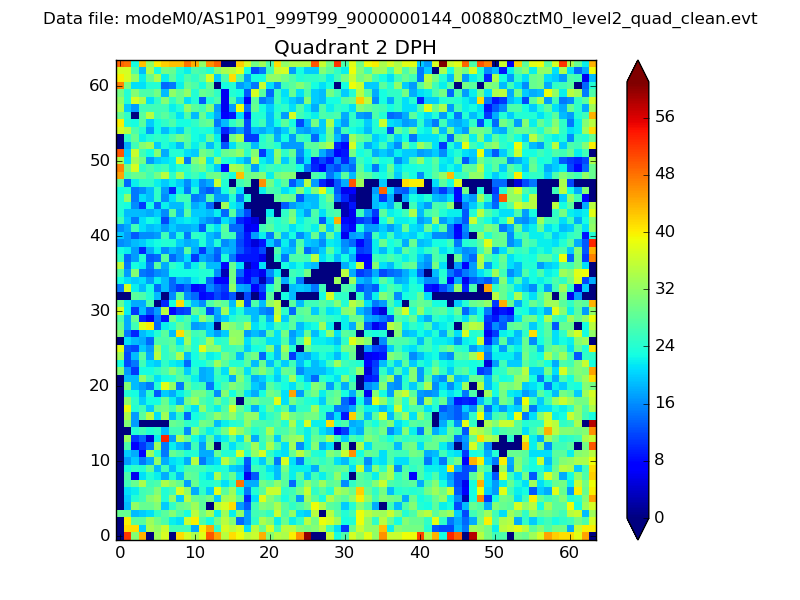
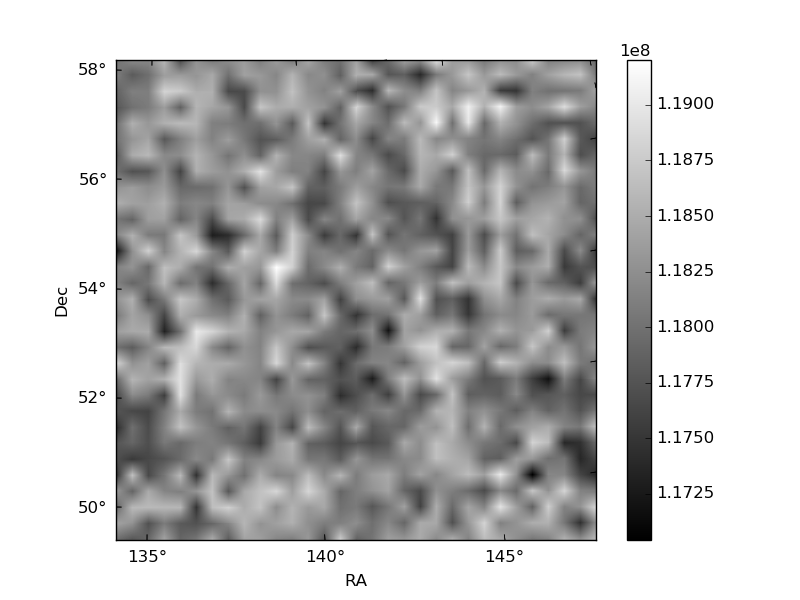
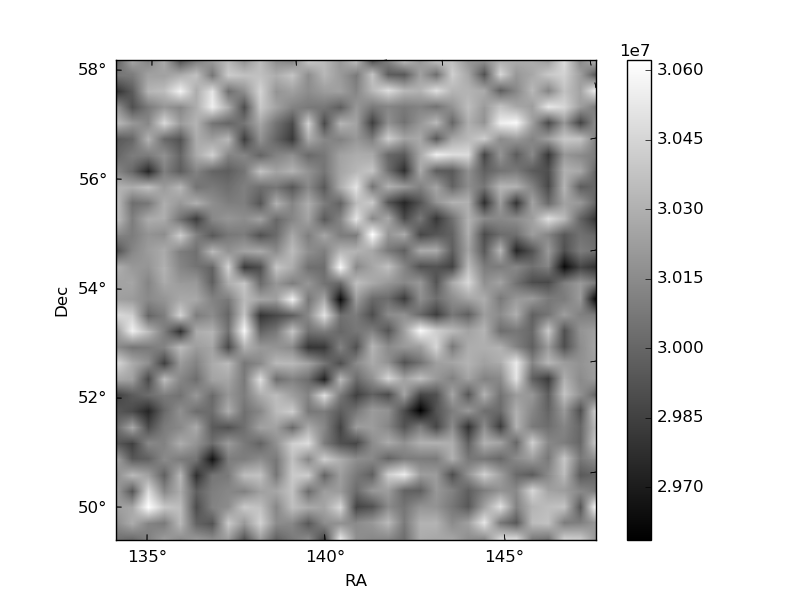
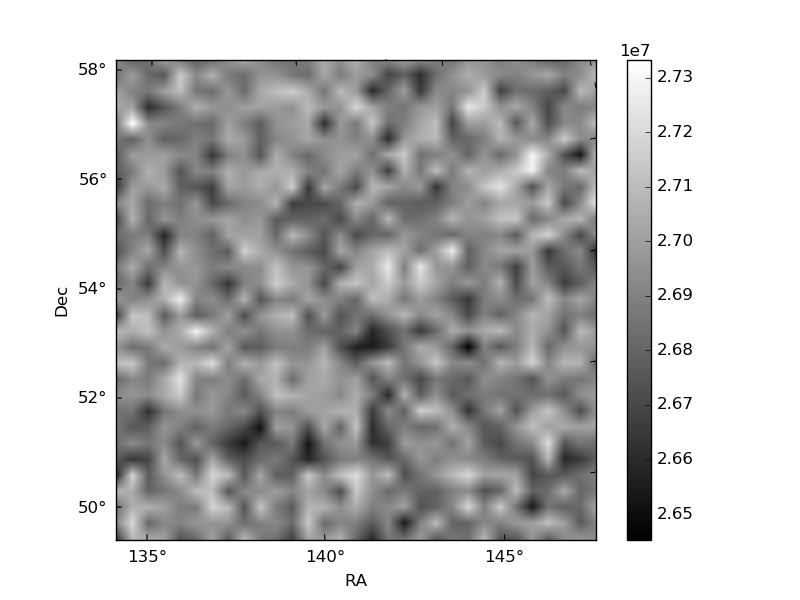
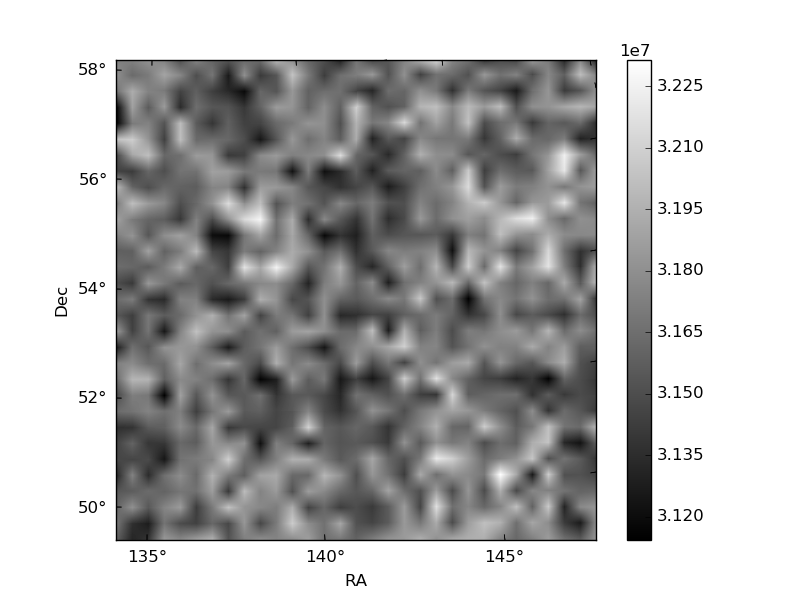
Histogram calculated using DETX and DETY for each event in the final _common_clean file
| Quadrant A | 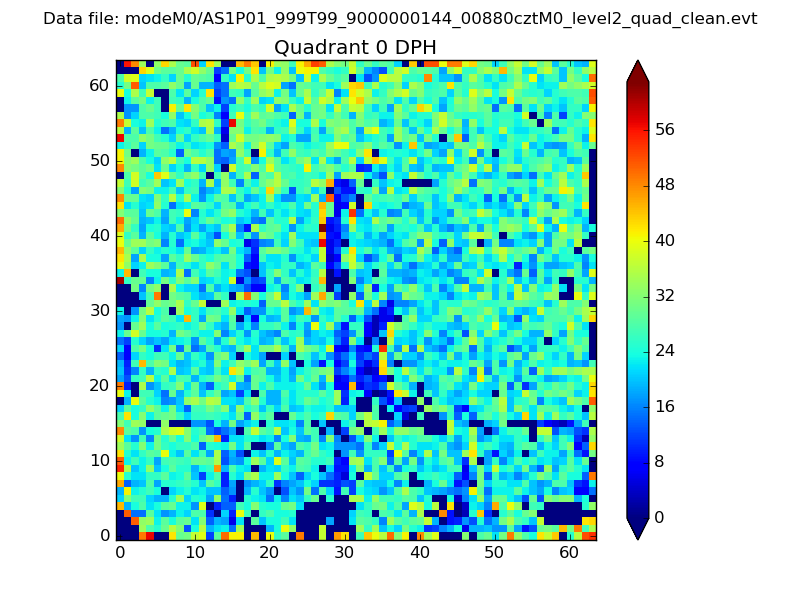 |
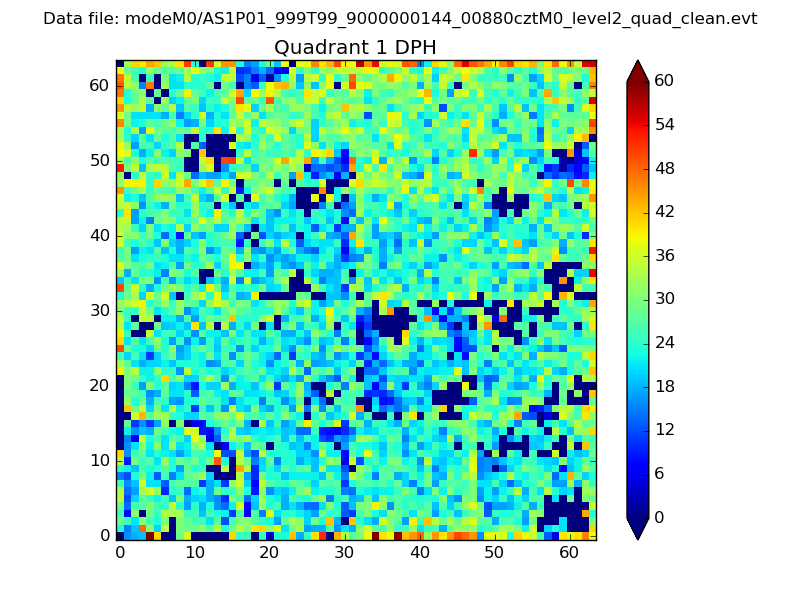 |
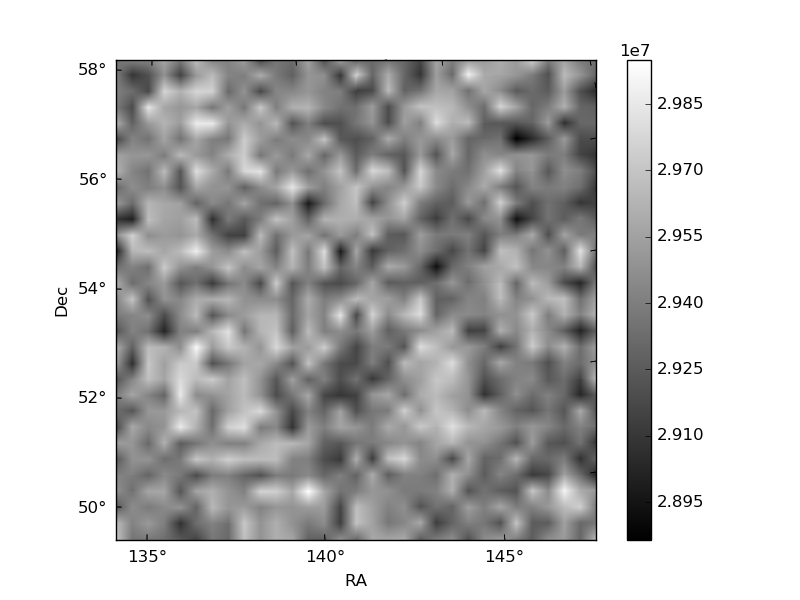
Quadrant B |
|---|---|---|---|
| Quadrant D | 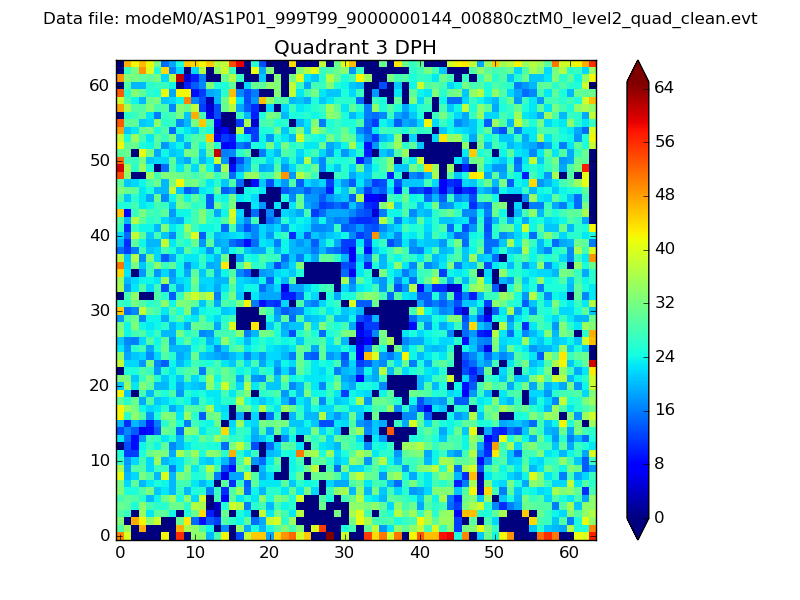 |
 |
Quadrant C |
| Plot type | Count rate plots | Images |
|---|---|---|
| Comparison with Poisson distribution Blue bars denote a histogram of data divided into 1 sec bins. Red curve is a Poisson curve with rate = median count rate of data. |
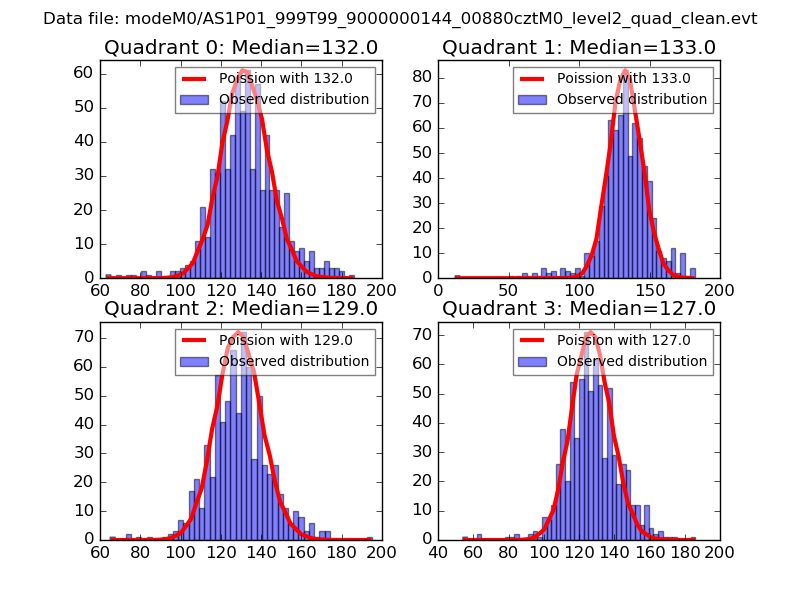 |
 |
| Quadrant-wise count rates Data is divided into 100 sec bins |
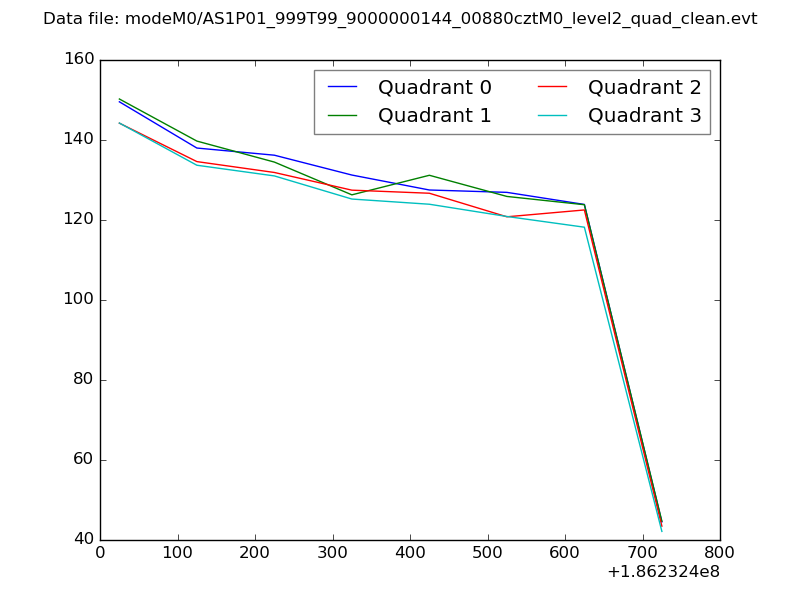 |
|
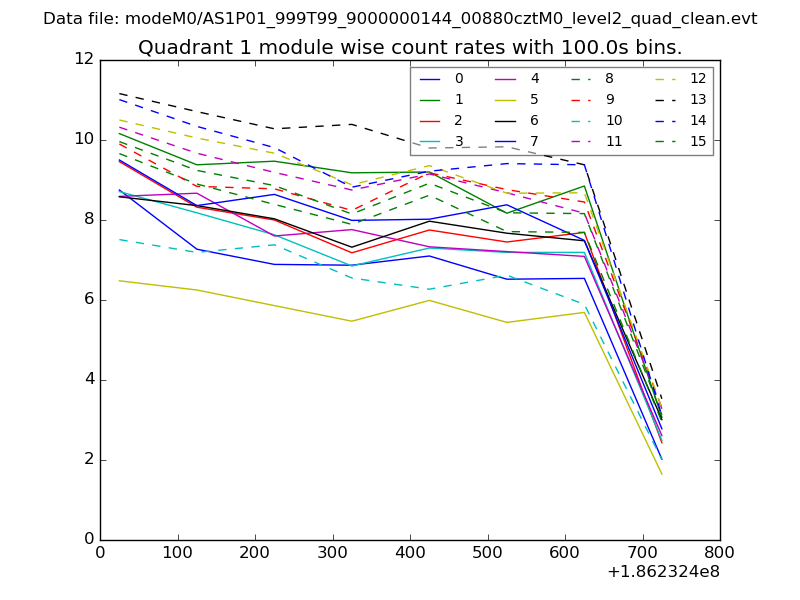
| Module-wise count rates for Quadrant A Data is divided into 100 sec bins |
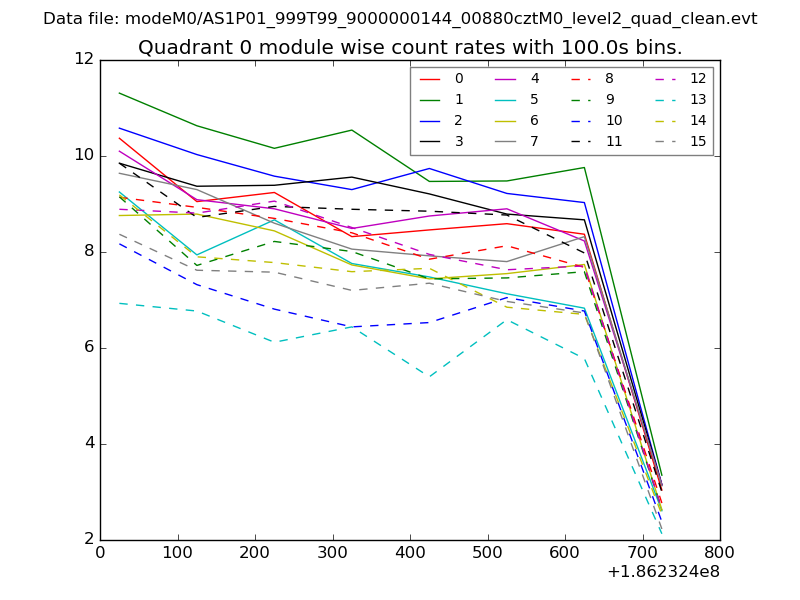 |
 |
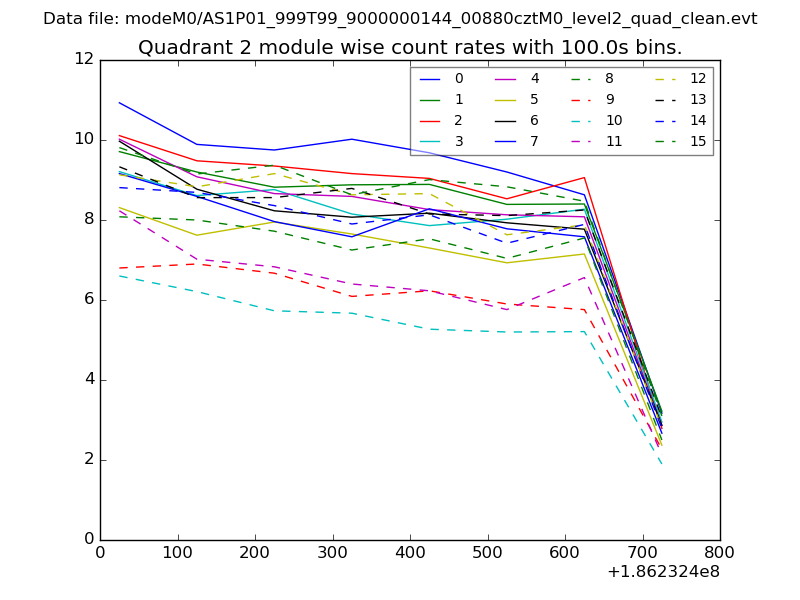
| Module-wise count rates for Quadrant B Data is divided into 100 sec bins |
 |
 |
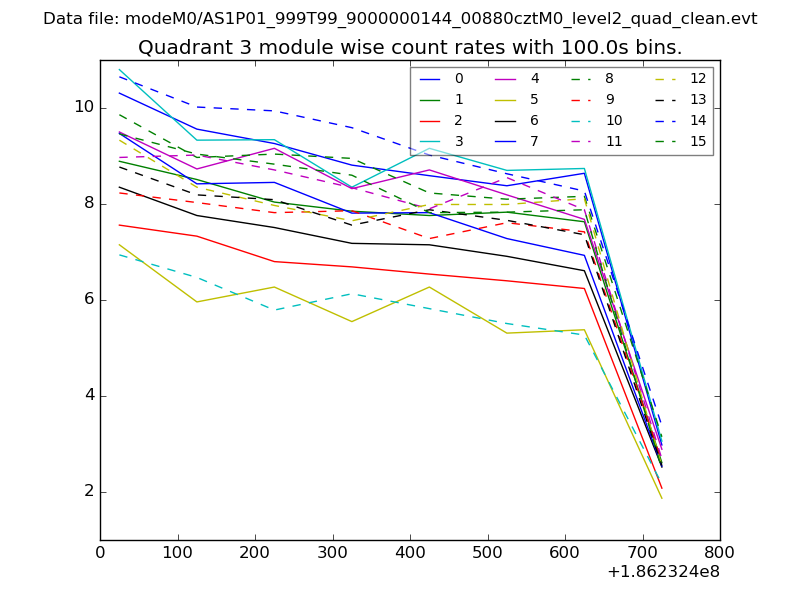
| Module-wise count rates for Quadrant C Data is divided into 100 sec bins |
 |
 |
| Module-wise count rates for Quadrant D Data is divided into 100 sec bins |
 |
 |
| Parameter | Plot |
|---|---|
| CZT HV Monitor | 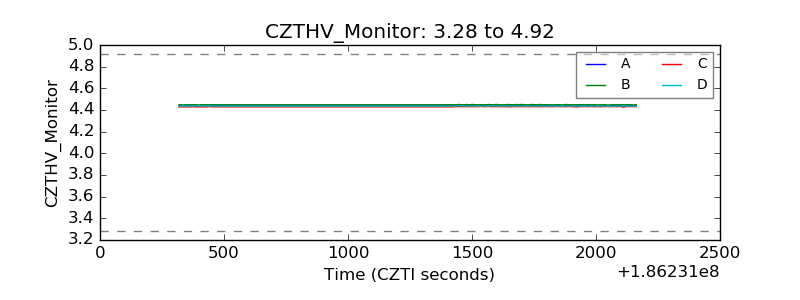 |
| D_VDD | 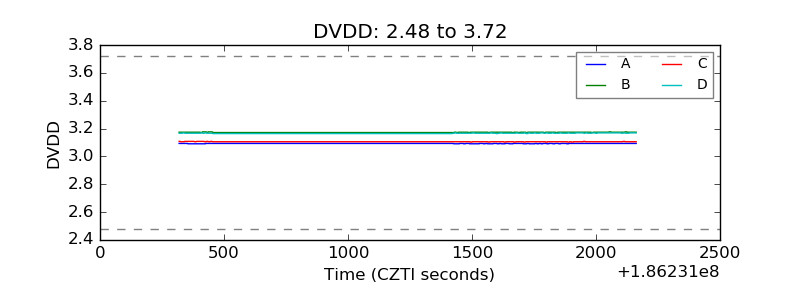 |
| Temperature 1 | 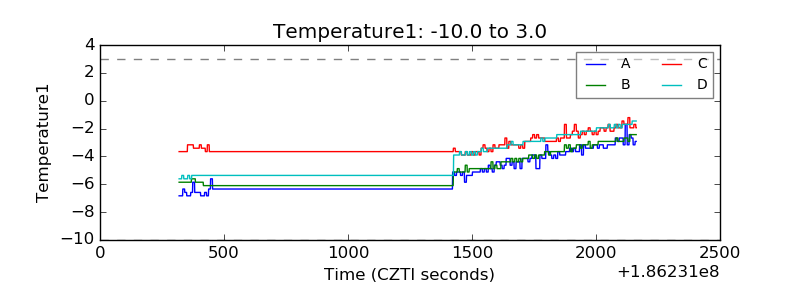 |
| Veto HV Monitor | 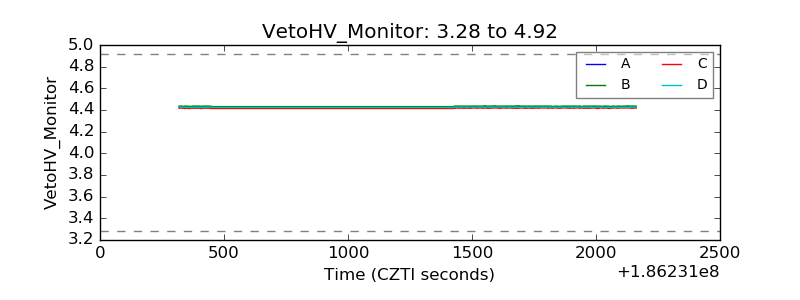 |
| Veto LLD | 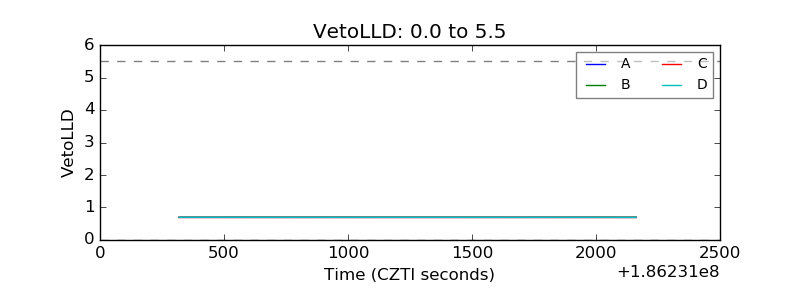 |
| Alpha Counter | 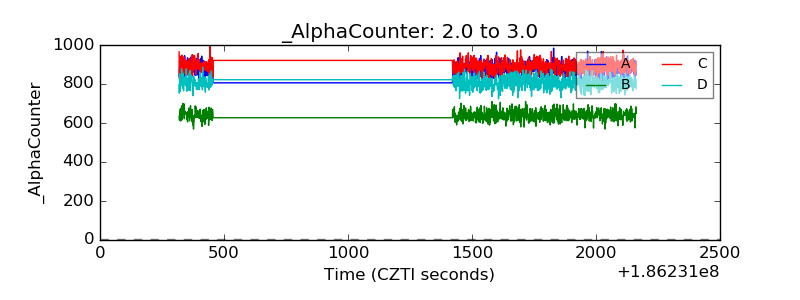 |
| _CPM_Rate | 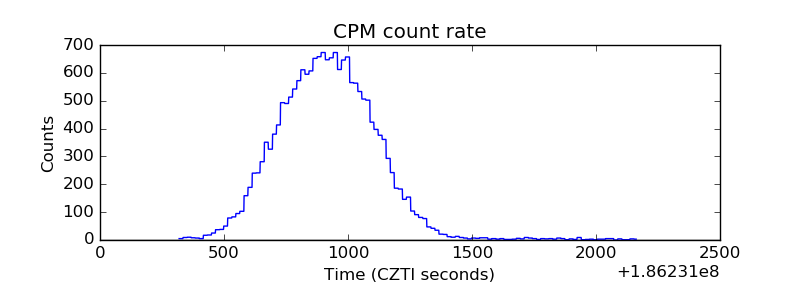 |
| CZT Counter | 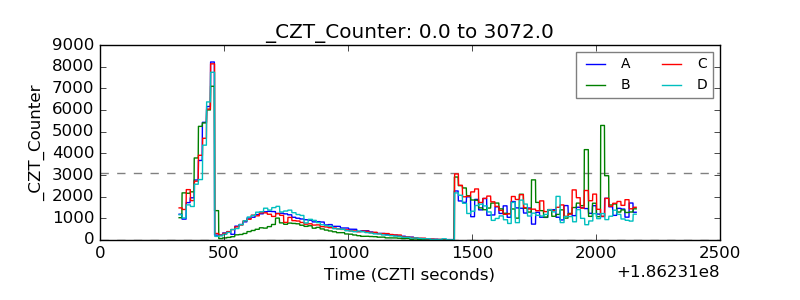 |
| +2.5 Volts monitor | 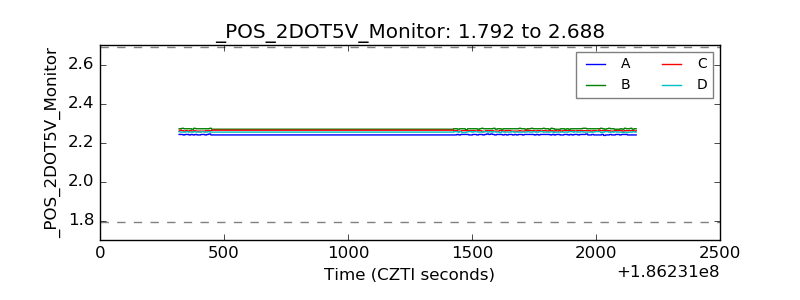 |
| +5 Volts monitor |  |
| _ROLL_ROT | 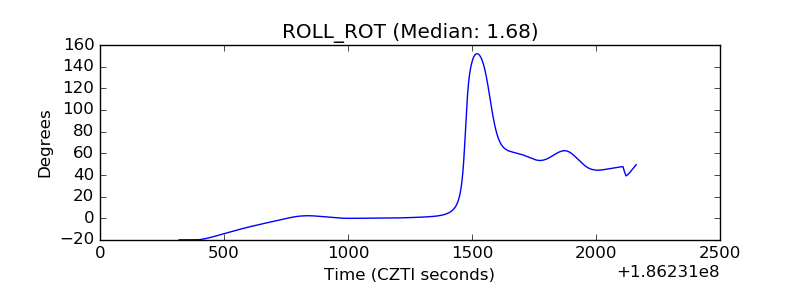 |
| _Roll_DEC | 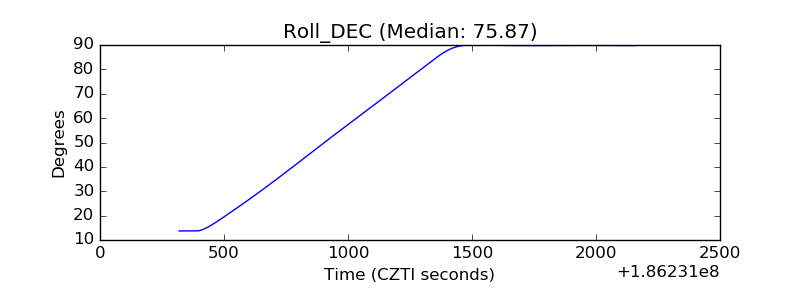 |
| _Roll_RA | 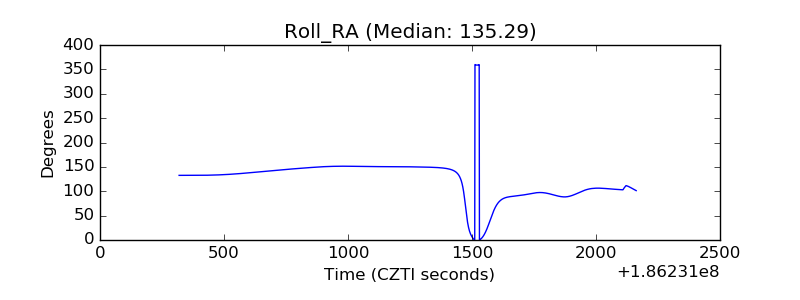 |
| Veto Counter | 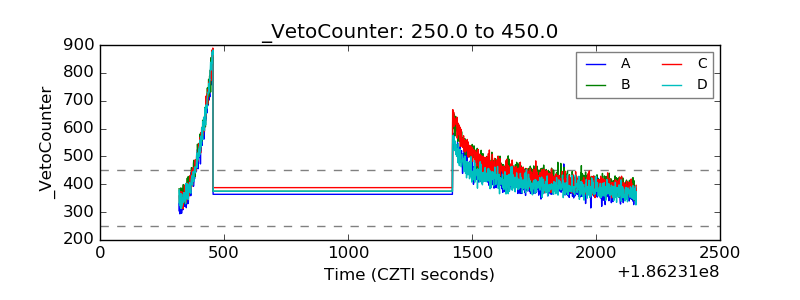 |