| Param | Original file | Final file |
|---|---|---|
| Filename | modeM0/AS1P01_999T99_9000000152cztM0_level2.fits | modeM0/AS1P01_999T99_9000000152cztM0_level2_quad_clean.evt |
| Size (bytes) | 6,575,040 | 10,419,840 |
| Size | 6.3 MB | 9.9 MB |
| Events in quadrant A | 37,516 | 67,303 |
| Events in quadrant B | 36,482 | 64,570 |
| Events in quadrant C | 35,642 | 64,792 |
| Events in quadrant D | 30,952 | 59,308 |
| Mode SS | |||
|---|---|---|---|
| Quadrant | BADHDUFLAG | Total packets | Discarded packets |
| A | 0 | 16 | 0 |
| B | 0 | 16 | 0 |
| C | 0 | 16 | 0 |
| D | 0 | 16 | 0 |
| Mode M9 | |||
|---|---|---|---|
| Quadrant | BADHDUFLAG | Total packets | Discarded packets |
| A | 0 | 12 | 0 |
| B | 0 | 12 | 0 |
| C | 0 | 12 | 0 |
| D | 0 | 12 | 0 |
| Mode M0 | |||
|---|---|---|---|
| Quadrant | BADHDUFLAG | Total packets | Discarded packets |
| A | 0 | 3565 | 0 |
| B | 0 | 4488 | 0 |
| C | 0 | 3708 | 0 |
| D | 0 | 3281 | 0 |
| Quadrant | Total seconds | Saturated seconds | Saturation percentage |
|---|---|---|---|
| A | 736 | 29 | 3.940217% |
| B | 736 | 48 | 6.521739% |
| C | 736 | 33 | 4.483696% |
| D | 736 | 44 | 5.978261% |
Noise dominated data is calculated using 1-second bins in cleaned event files. If a bin has >2000 counts, and if more than 50% of those come from <1% of pixels, then it is considered to be noise-dominated and hence unusable.
| Quadrant | # 1 sec bins | Bins with >0 counts | Bins with >2000 counts | High rate bins dominated by noise | Noise dominated (total time) | Noise dominated (detector-on time) | Marked lightcurve |
|---|---|---|---|---|---|---|---|
| A | 735 | 735 | 0 | 0 | 0.00% | 0.00% | 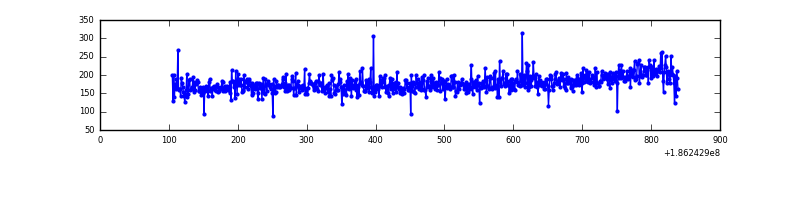 |
| B | 735 | 735 | 0 | 0 | 0.00% | 0.00% |  |
| C | 735 | 735 | 0 | 0 | 0.00% | 0.00% |  |
| D | 735 | 734 | 0 | 0 | 0.00% | 0.00% |  |
Top three noisy pixels from each quadrant. If the there are fewer than three noisy pixels in the level2.evt file, extra rows are filled as -1
| Pixel properties | Quadrant properties | ||||||
|---|---|---|---|---|---|---|---|
| Quadrant | DetID | PixID | Counts | Sigma | Mean | Median | Sigma |
| A | 7 | 110 | 40 | 7.99 | 9 | 9 | 3.9 |
| A | 14 | 172 | 33 | 6.18 | 9 | 9 | 3.9 |
| A | 7 | 94 | 33 | 6.18 | 9 | 9 | 3.9 |
| B | 8 | 17 | 30 | 5.93 | 9 | 9 | 3.5 |
| B | 10 | 15 | 29 | 5.65 | 9 | 9 | 3.5 |
| B | 2 | 9 | 29 | 5.65 | 9 | 9 | 3.5 |
| C | 12 | 241 | 35 | 6.73 | 9 | 9 | 3.9 |
| C | 7 | 140 | 31 | 5.7 | 9 | 9 | 3.9 |
| C | -1 | -1 | -1 | -1.0 | 9 | 9 | 3.9 |
| D | 1 | 19 | 31 | 6.6 | 8 | 8 | 3.5 |
| D | 3 | 30 | 27 | 5.45 | 8 | 8 | 3.5 |
| D | 10 | 189 | 26 | 5.17 | 8 | 8 | 3.5 |
Histogram calculated using DETX and DETY for each event in the final _common_clean file
| Quadrant A | 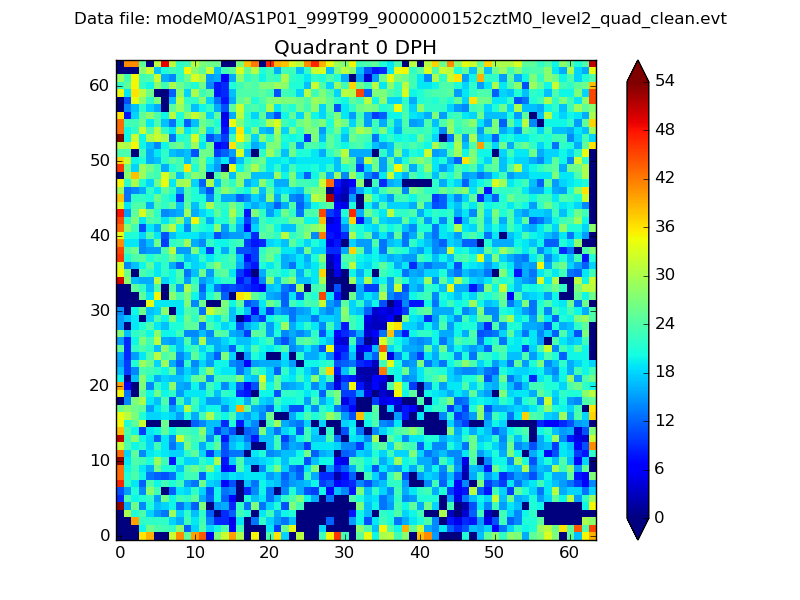 |
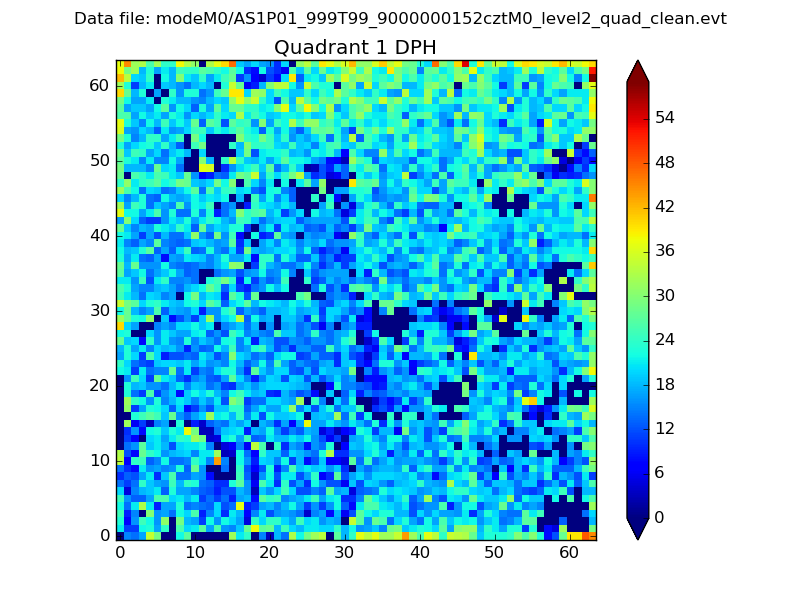 |
Quadrant B |
|---|---|---|---|
| Quadrant D |  |
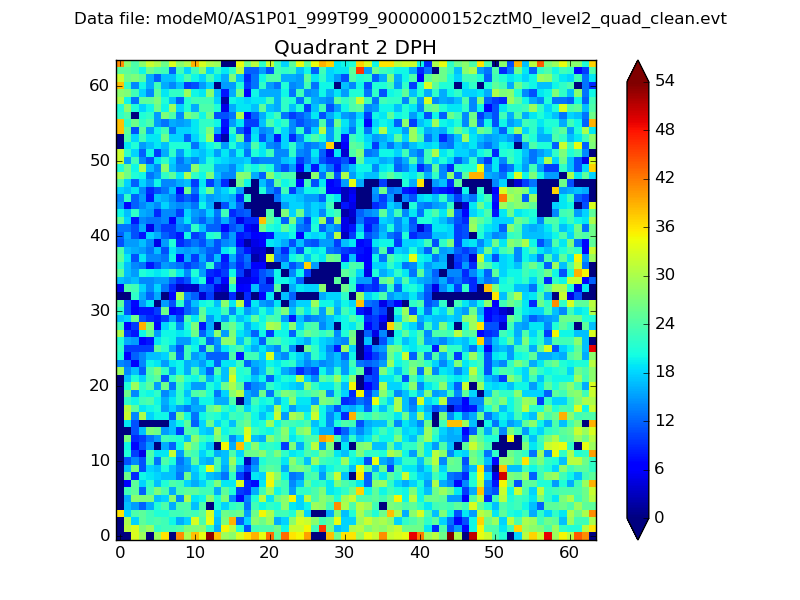 |
Quadrant C |
| Plot type | Count rate plots | Images |
|---|---|---|
| Comparison with Poisson distribution Blue bars denote a histogram of data divided into 1 sec bins. Red curve is a Poisson curve with rate = median count rate of data. |
 |
 |
| Quadrant-wise count rates Data is divided into 100 sec bins |
 |
|
| Module-wise count rates for Quadrant A Data is divided into 100 sec bins |
 |
 |
| Module-wise count rates for Quadrant B Data is divided into 100 sec bins |
 |
 |
| Module-wise count rates for Quadrant C Data is divided into 100 sec bins |
 |
 |
| Module-wise count rates for Quadrant D Data is divided into 100 sec bins |
 |
 |
| Parameter | Plot |
|---|---|
| CZT HV Monitor |  |
| D_VDD | 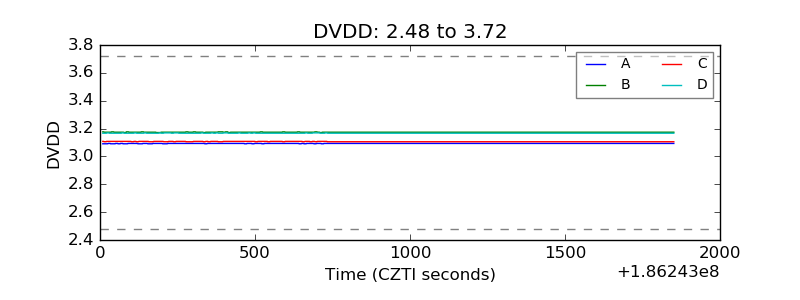 |
| Temperature 1 |  |
| Veto HV Monitor |  |
| Veto LLD |  |
| Alpha Counter |  |
| _CPM_Rate |  |
| CZT Counter |  |
| +2.5 Volts monitor |  |
| +5 Volts monitor |  |
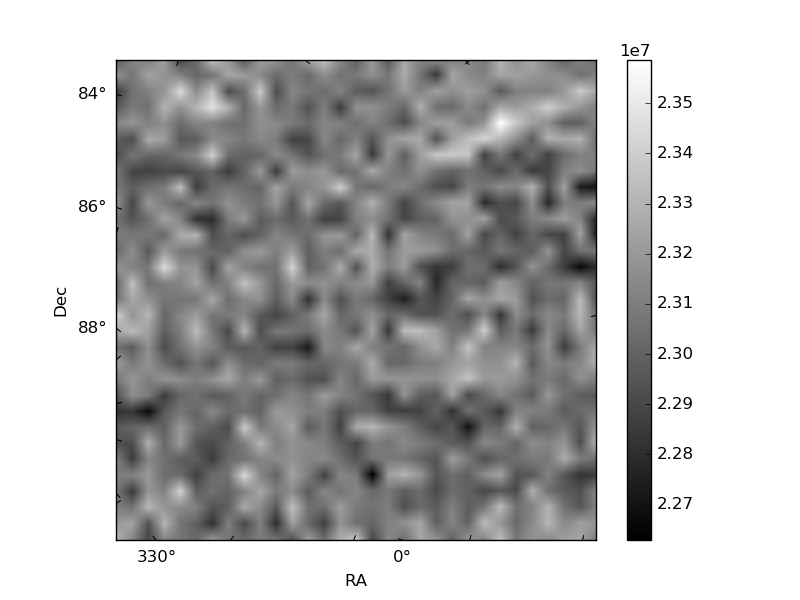
| _ROLL_ROT |  |
| _Roll_DEC |  |
| _Roll_RA | 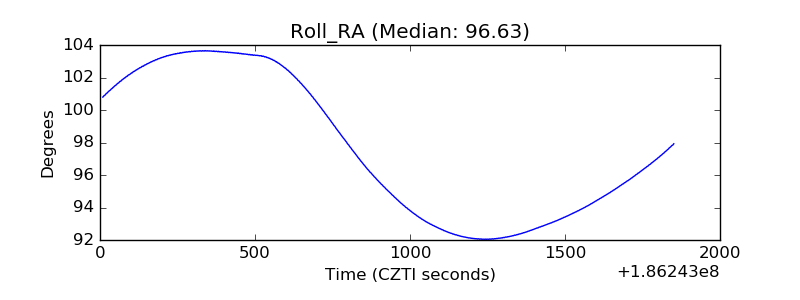 |
| Veto Counter |  |