| Param | Original file | Final file |
|---|---|---|
| Filename | modeM0/AS1P01_999T99_9000000160cztM0_level2.fits | modeM0/AS1P01_999T99_9000000160cztM0_level2_quad_clean.evt |
| Size (bytes) | 12,939,840 | 12,337,920 |
| Size | 12.3 MB | 11.8 MB |
| Events in quadrant A | 74,536 | 67,891 |
| Events in quadrant B | 74,848 | 67,675 |
| Events in quadrant C | 72,430 | 67,526 |
| Events in quadrant D | 62,734 | 62,076 |
| Mode M0 | |||
|---|---|---|---|
| Quadrant | BADHDUFLAG | Total packets | Discarded packets |
| A | 0 | 6680 | 0 |
| B | 0 | 6905 | 0 |
| C | 0 | 6205 | 0 |
| D | 0 | 5888 | 0 |
| Mode M9 | |||
|---|---|---|---|
| Quadrant | BADHDUFLAG | Total packets | Discarded packets |
| A | 0 | 4 | 0 |
| B | 0 | 4 | 0 |
| C | 0 | 4 | 0 |
| D | 0 | 4 | 0 |
| Mode SS | |||
|---|---|---|---|
| Quadrant | BADHDUFLAG | Total packets | Discarded packets |
| A | 0 | 30 | 0 |
| B | 0 | 30 | 0 |
| C | 0 | 30 | 0 |
| D | 0 | 30 | 0 |
| Quadrant | Total seconds | Saturated seconds | Saturation percentage |
|---|---|---|---|
| A | 1450 | 17 | 1.172414% |
| B | 1450 | 7 | 0.482759% |
| C | 1450 | 12 | 0.827586% |
| D | 1450 | 7 | 0.482759% |
Noise dominated data is calculated using 1-second bins in cleaned event files. If a bin has >2000 counts, and if more than 50% of those come from <1% of pixels, then it is considered to be noise-dominated and hence unusable.
| Quadrant | # 1 sec bins | Bins with >0 counts | Bins with >2000 counts | High rate bins dominated by noise | Noise dominated (total time) | Noise dominated (detector-on time) | Marked lightcurve |
|---|---|---|---|---|---|---|---|
| A | 1449 | 1449 | 0 | 0 | 0.00% | 0.00% |  |
| B | 1449 | 1449 | 0 | 0 | 0.00% | 0.00% | 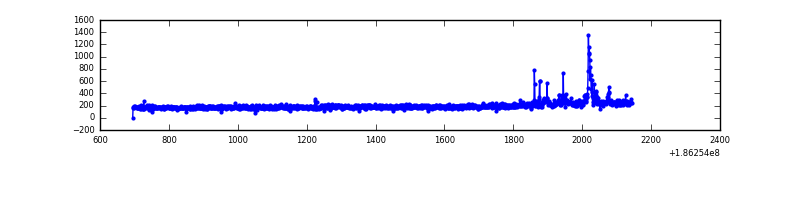 |
| C | 1449 | 1449 | 0 | 0 | 0.00% | 0.00% | 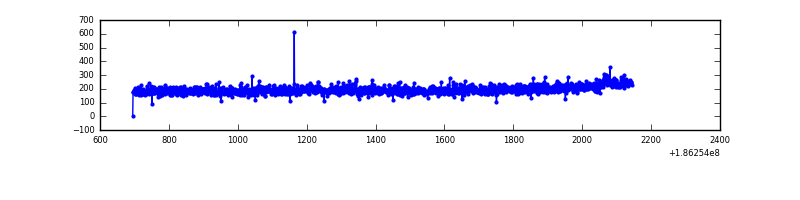 |
| D | 1449 | 1449 | 0 | 0 | 0.00% | 0.00% | 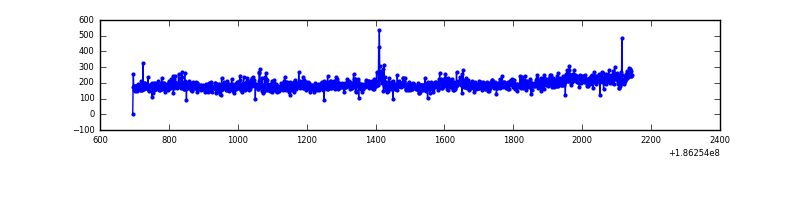 |
Top three noisy pixels from each quadrant. If the there are fewer than three noisy pixels in the level2.evt file, extra rows are filled as -1
| Pixel properties | Quadrant properties | ||||||
|---|---|---|---|---|---|---|---|
| Quadrant | DetID | PixID | Counts | Sigma | Mean | Median | Sigma |
| A | 0 | 29 | 71 | 8.52 | 19 | 18 | 6.2 |
| A | 7 | 110 | 63 | 7.24 | 19 | 18 | 6.2 |
| A | 9 | 19 | 56 | 6.11 | 19 | 18 | 6.2 |
| B | 2 | 9 | 59 | 7.14 | 19 | 19 | 5.6 |
| B | 10 | 225 | 55 | 6.42 | 19 | 19 | 5.6 |
| B | 5 | 128 | 54 | 6.25 | 19 | 19 | 5.6 |
| C | 12 | 250 | 61 | 6.63 | 19 | 18 | 6.5 |
| C | 2 | 17 | 56 | 5.86 | 19 | 18 | 6.5 |
| C | 12 | 249 | 54 | 5.55 | 19 | 18 | 6.5 |
| D | 3 | 14 | 51 | 5.87 | 17 | 16 | 6.0 |
| D | 15 | 30 | 50 | 5.7 | 17 | 16 | 6.0 |
| D | 11 | 82 | 49 | 5.53 | 17 | 16 | 6.0 |
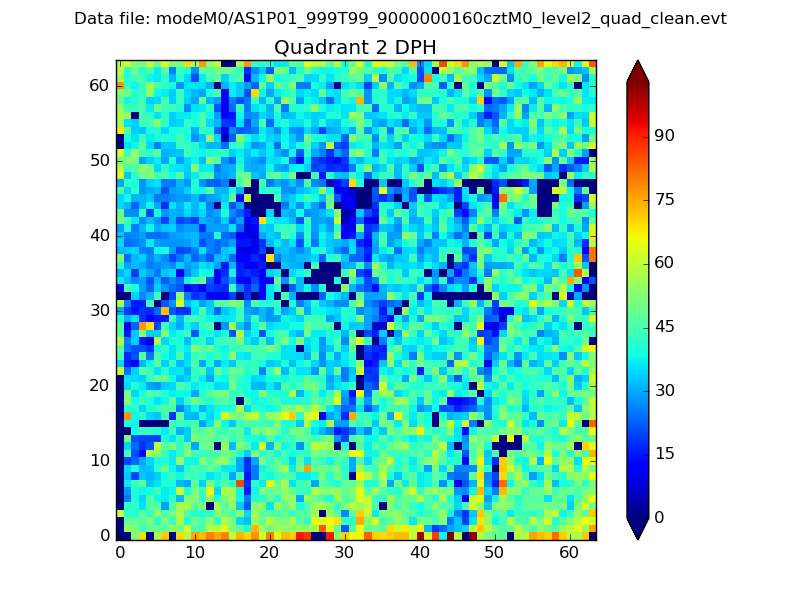
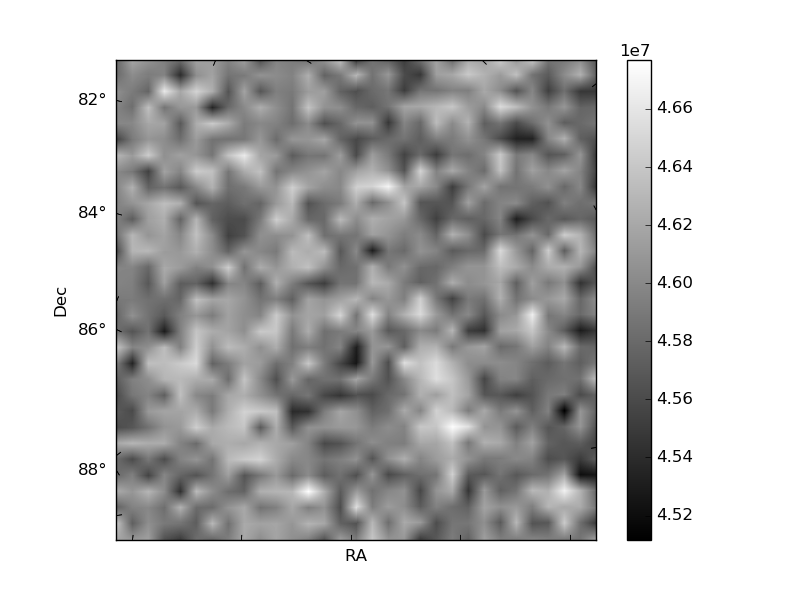
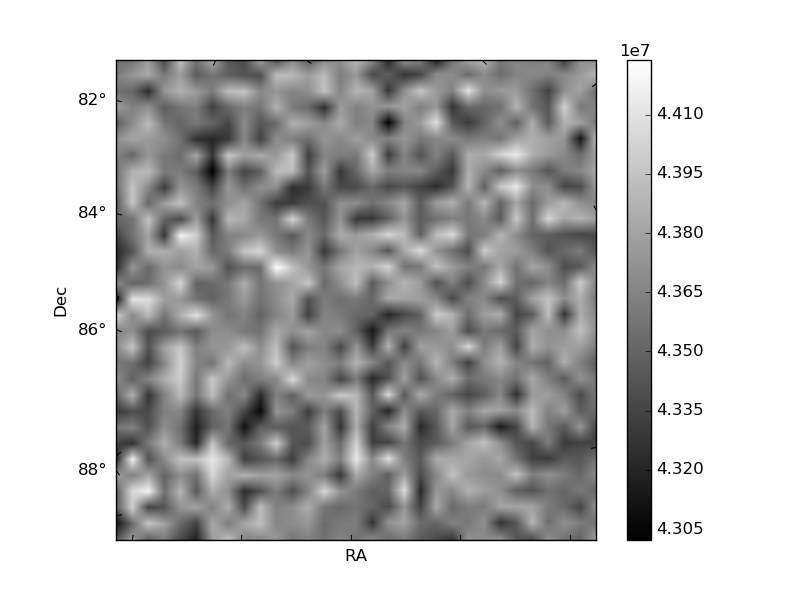
Histogram calculated using DETX and DETY for each event in the final _common_clean file
| Quadrant A | 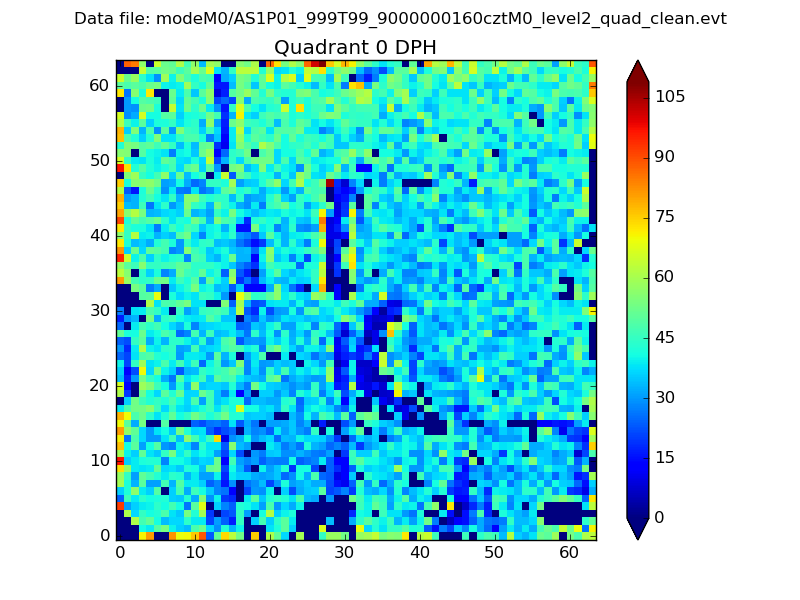 |
 |
Quadrant B |
|---|---|---|---|
| Quadrant D | 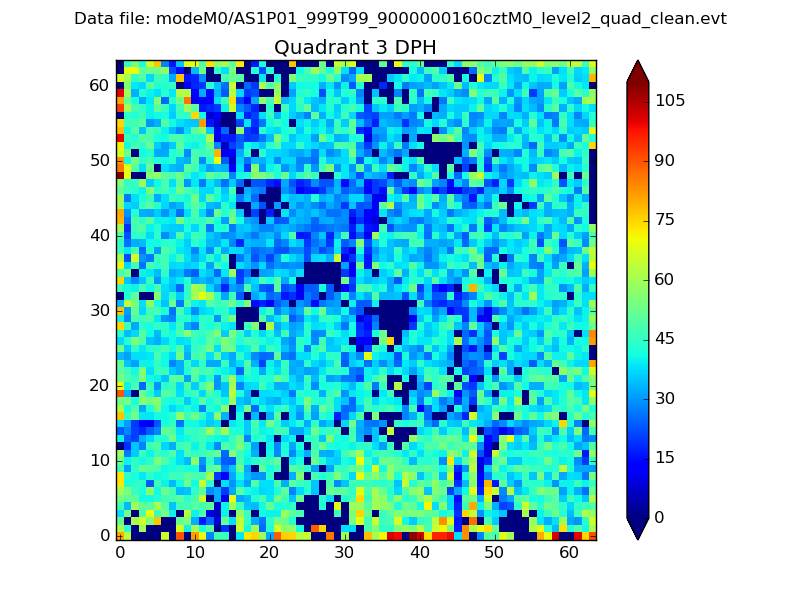 |
 |
Quadrant C |
| Plot type | Count rate plots | Images |
|---|---|---|
| Comparison with Poisson distribution Blue bars denote a histogram of data divided into 1 sec bins. Red curve is a Poisson curve with rate = median count rate of data. |
 |
 |
| Quadrant-wise count rates Data is divided into 100 sec bins |
 |
|
| Module-wise count rates for Quadrant A Data is divided into 100 sec bins |
 |
 |
| Module-wise count rates for Quadrant B Data is divided into 100 sec bins |
 |
 |
| Module-wise count rates for Quadrant C Data is divided into 100 sec bins |
 |
 |
| Module-wise count rates for Quadrant D Data is divided into 100 sec bins |
 |
 |
| Parameter | Plot |
|---|---|
| CZT HV Monitor |  |
| D_VDD | 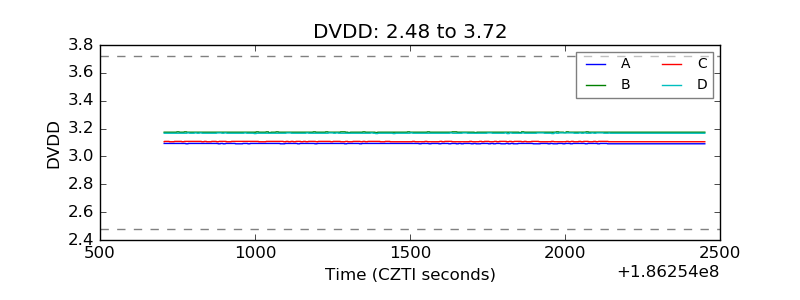 |
| Temperature 1 | 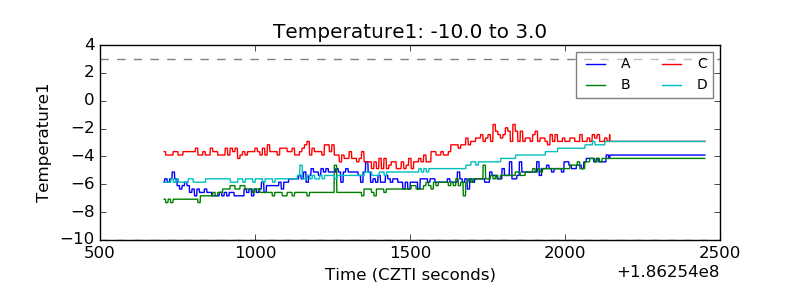 |
| Veto HV Monitor | 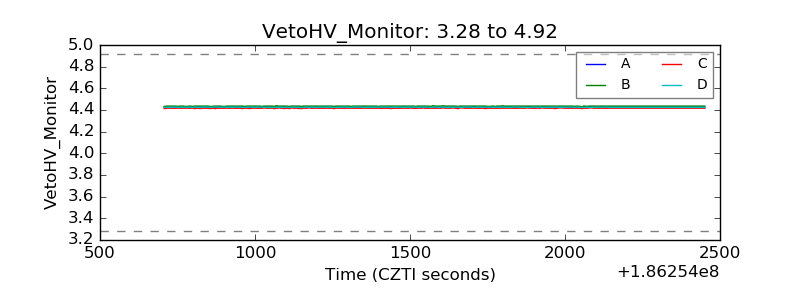 |
| Veto LLD |  |
| Alpha Counter |  |
| _CPM_Rate |  |
| CZT Counter |  |
| +2.5 Volts monitor |  |
| +5 Volts monitor |  |
| _ROLL_ROT | 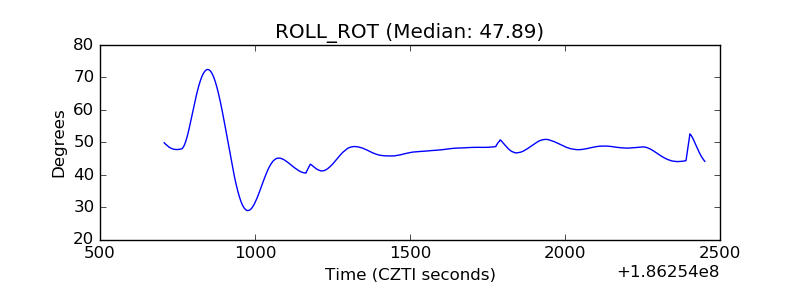 |
| _Roll_DEC |  |
| _Roll_RA | 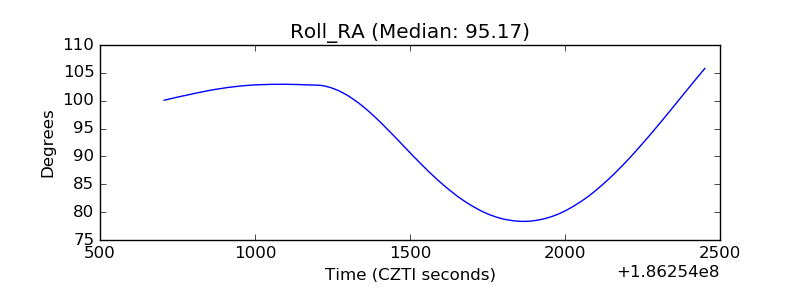 |
| Veto Counter |  |