| Param | Original file | Final file |
|---|---|---|
| Filename | modeM0/AS1P01_999T99_9000000164cztM0_level2.fits | modeM0/AS1P01_999T99_9000000164cztM0_level2_quad_clean.evt |
| Size (bytes) | 15,998,400 | 15,744,960 |
| Size | 15.3 MB | 15.0 MB |
| Events in quadrant A | 91,876 | 87,121 |
| Events in quadrant B | 91,018 | 87,780 |
| Events in quadrant C | 88,520 | 86,658 |
| Events in quadrant D | 78,108 | 79,076 |
| Mode SS | |||
|---|---|---|---|
| Quadrant | BADHDUFLAG | Total packets | Discarded packets |
| A | 0 | 38 | 0 |
| B | 0 | 38 | 0 |
| C | 0 | 38 | 0 |
| D | 0 | 38 | 0 |
| Mode M0 | |||
|---|---|---|---|
| Quadrant | BADHDUFLAG | Total packets | Discarded packets |
| A | 0 | 8003 | 0 |
| B | 0 | 8287 | 0 |
| C | 0 | 7401 | 0 |
| D | 0 | 7028 | 0 |
| Quadrant | Total seconds | Saturated seconds | Saturation percentage |
|---|---|---|---|
| A | 1848 | 1 | 0.054113% |
| B | 1848 | 0 | 0.000000% |
| C | 1848 | 1 | 0.054113% |
| D | 1848 | 0 | 0.000000% |
Noise dominated data is calculated using 1-second bins in cleaned event files. If a bin has >2000 counts, and if more than 50% of those come from <1% of pixels, then it is considered to be noise-dominated and hence unusable.
| Quadrant | # 1 sec bins | Bins with >0 counts | Bins with >2000 counts | High rate bins dominated by noise | Noise dominated (total time) | Noise dominated (detector-on time) | Marked lightcurve |
|---|---|---|---|---|---|---|---|
| A | 1847 | 1847 | 0 | 0 | 0.00% | 0.00% |  |
| B | 1847 | 1847 | 0 | 0 | 0.00% | 0.00% |  |
| C | 1847 | 1847 | 0 | 0 | 0.00% | 0.00% | 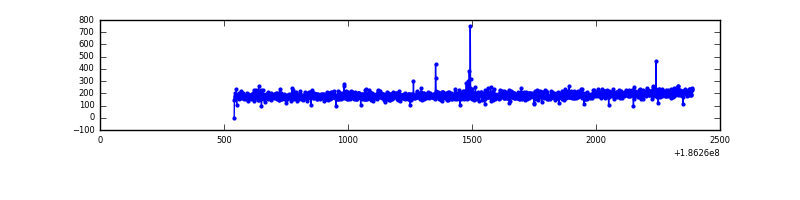 |
| D | 1847 | 1847 | 0 | 0 | 0.00% | 0.00% |  |
Top three noisy pixels from each quadrant. If the there are fewer than three noisy pixels in the level2.evt file, extra rows are filled as -1
| Pixel properties | Quadrant properties | ||||||
|---|---|---|---|---|---|---|---|
| Quadrant | DetID | PixID | Counts | Sigma | Mean | Median | Sigma |
| A | 0 | 29 | 92 | 9.12 | 23 | 22 | 7.7 |
| A | 7 | 110 | 86 | 8.34 | 23 | 22 | 7.7 |
| A | 14 | 233 | 71 | 6.39 | 23 | 22 | 7.7 |
| B | 2 | 9 | 90 | 10.21 | 24 | 23 | 6.6 |
| B | 5 | 128 | 72 | 7.47 | 24 | 23 | 6.6 |
| B | 14 | 254 | 68 | 6.86 | 24 | 23 | 6.6 |
| C | 12 | 241 | 66 | 5.88 | 23 | 22 | 7.5 |
| C | 2 | 191 | 65 | 5.75 | 23 | 22 | 7.5 |
| C | 12 | 16 | 61 | 5.21 | 23 | 22 | 7.5 |
| D | 3 | 31 | 66 | 6.75 | 22 | 20 | 6.8 |
| D | 15 | 30 | 60 | 5.87 | 22 | 20 | 6.8 |
| D | 6 | 51 | 60 | 5.87 | 22 | 20 | 6.8 |
Histogram calculated using DETX and DETY for each event in the final _common_clean file
| Quadrant A | 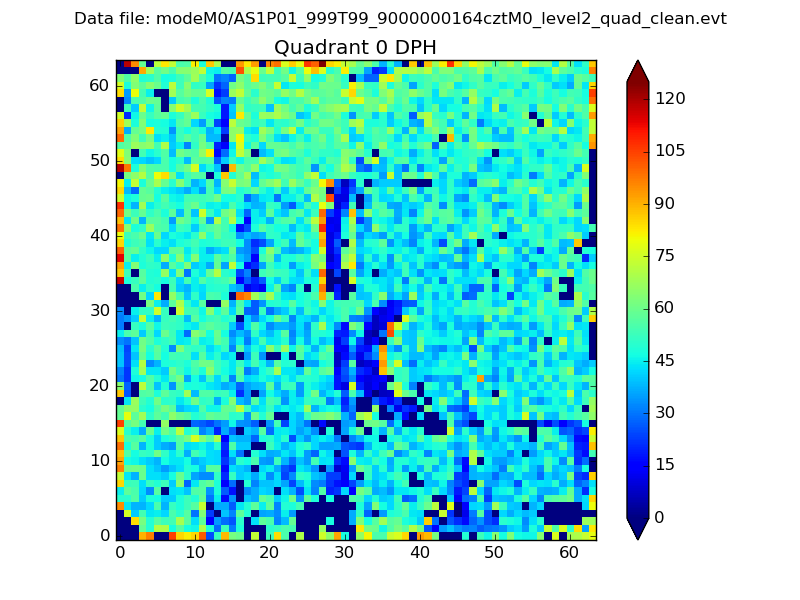 |
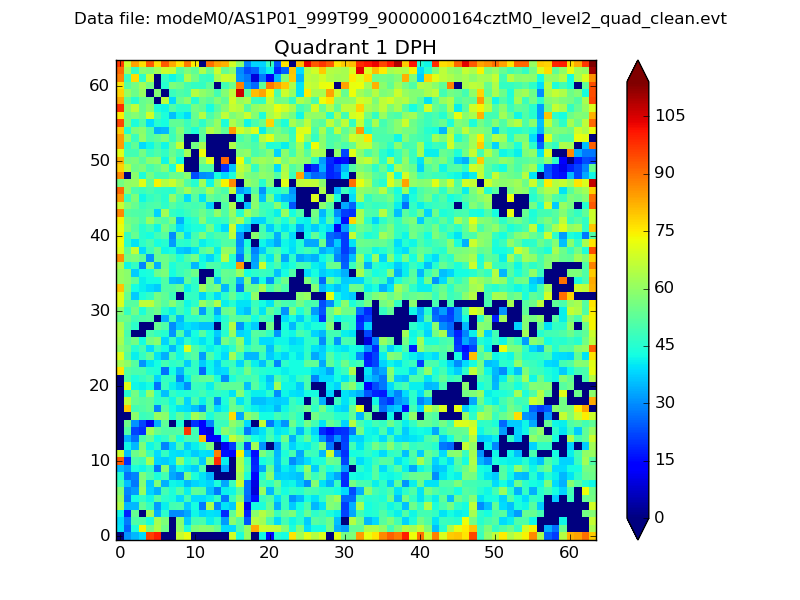 |
Quadrant B |
|---|---|---|---|
| Quadrant D | 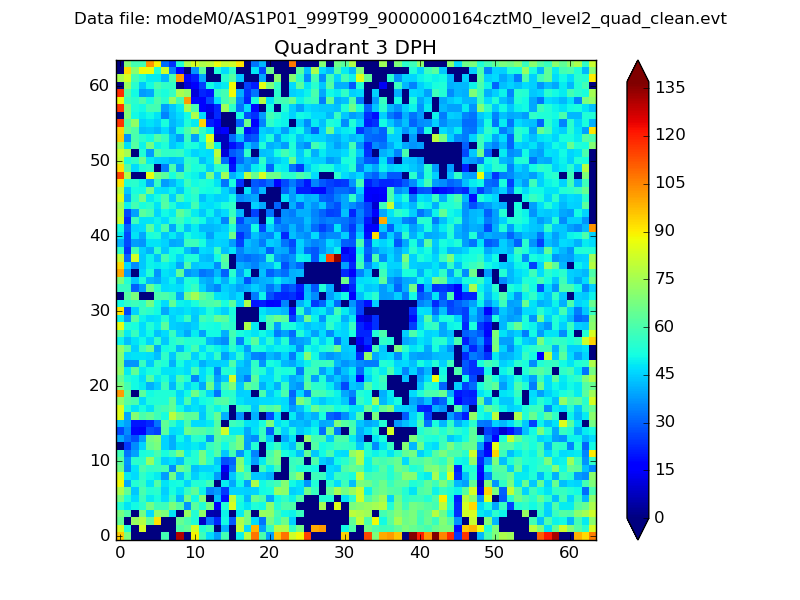 |
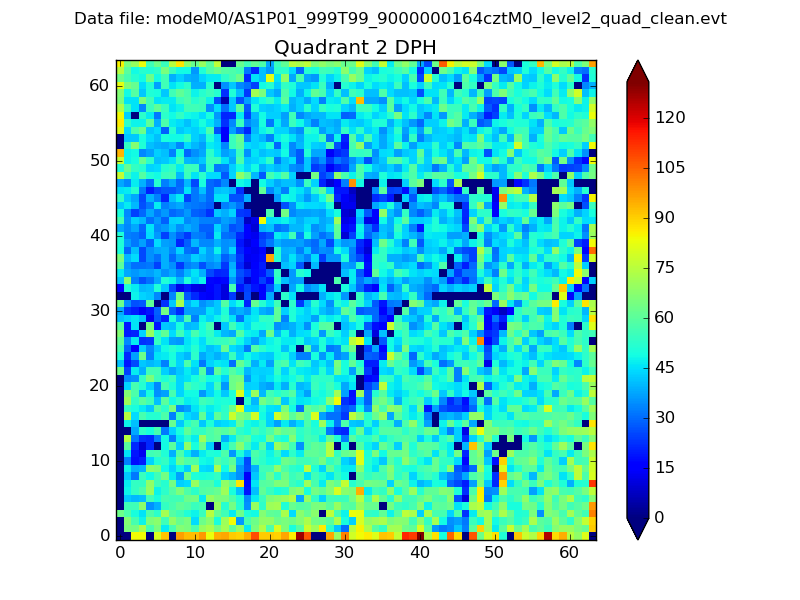 |
Quadrant C |
| Plot type | Count rate plots | Images |
|---|---|---|
| Comparison with Poisson distribution Blue bars denote a histogram of data divided into 1 sec bins. Red curve is a Poisson curve with rate = median count rate of data. |
 |
 |
| Quadrant-wise count rates Data is divided into 100 sec bins |
 |
|
| Module-wise count rates for Quadrant A Data is divided into 100 sec bins |
 |
 |
| Module-wise count rates for Quadrant B Data is divided into 100 sec bins |
 |
 |
| Module-wise count rates for Quadrant C Data is divided into 100 sec bins |
 |
 |
| Module-wise count rates for Quadrant D Data is divided into 100 sec bins |
 |
 |
| Parameter | Plot |
|---|---|
| CZT HV Monitor |  |
| D_VDD |  |
| Temperature 1 |  |
| Veto HV Monitor |  |
| Veto LLD |  |
| Alpha Counter |  |
| _CPM_Rate |  |
| CZT Counter | 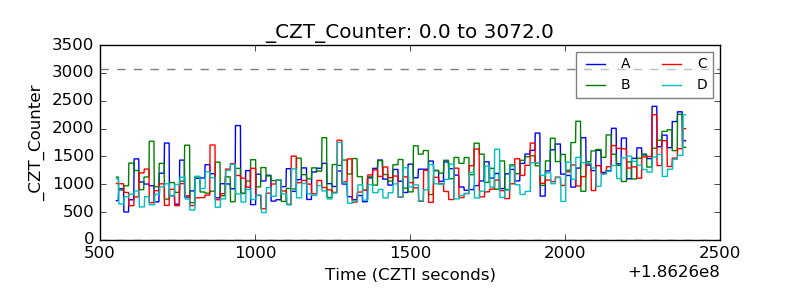 |
| +2.5 Volts monitor |  |
| +5 Volts monitor |  |
| _ROLL_ROT |  |
| _Roll_DEC | 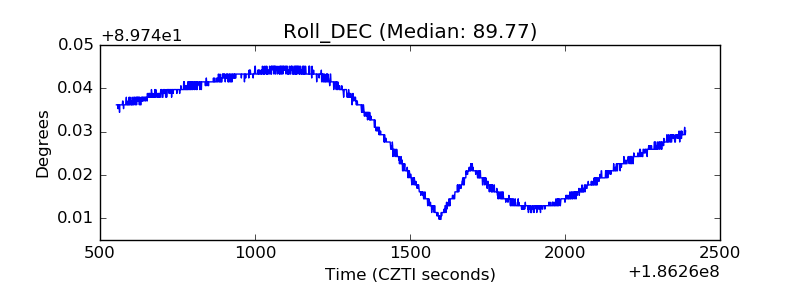 |
| _Roll_RA | 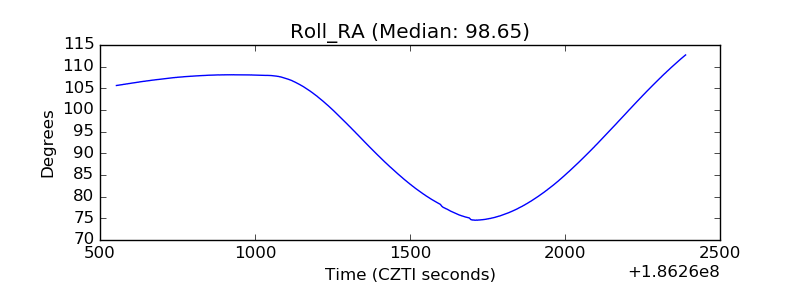 |
| Veto Counter |  |