| Param | Original file | Final file |
|---|---|---|
| Filename | modeM0/AS1P01_999T99_9000000168cztM0_level2.fits | modeM0/AS1P01_999T99_9000000168cztM0_level2_quad_clean.evt |
| Size (bytes) | 15,114,240 | 14,319,360 |
| Size | 14.4 MB | 13.7 MB |
| Events in quadrant A | 85,586 | 76,221 |
| Events in quadrant B | 83,754 | 76,764 |
| Events in quadrant C | 82,072 | 75,336 |
| Events in quadrant D | 71,676 | 69,490 |
| Mode M0 | |||
|---|---|---|---|
| Quadrant | BADHDUFLAG | Total packets | Discarded packets |
| A | 0 | 7436 | 0 |
| B | 0 | 7546 | 0 |
| C | 0 | 6813 | 0 |
| D | 0 | 6469 | 0 |
| Mode SS | |||
|---|---|---|---|
| Quadrant | BADHDUFLAG | Total packets | Discarded packets |
| A | 0 | 36 | 0 |
| B | 0 | 36 | 0 |
| C | 0 | 36 | 0 |
| D | 0 | 36 | 0 |
| Quadrant | Total seconds | Saturated seconds | Saturation percentage |
|---|---|---|---|
| A | 1848 | 0 | 0.000000% |
| B | 1848 | 0 | 0.000000% |
| C | 1848 | 0 | 0.000000% |
| D | 1848 | 0 | 0.000000% |
Noise dominated data is calculated using 1-second bins in cleaned event files. If a bin has >2000 counts, and if more than 50% of those come from <1% of pixels, then it is considered to be noise-dominated and hence unusable.
| Quadrant | # 1 sec bins | Bins with >0 counts | Bins with >2000 counts | High rate bins dominated by noise | Noise dominated (total time) | Noise dominated (detector-on time) | Marked lightcurve |
|---|---|---|---|---|---|---|---|
| A | 1848 | 1848 | 0 | 0 | 0.00% | 0.00% |  |
| B | 1847 | 1847 | 0 | 0 | 0.00% | 0.00% |  |
| C | 1847 | 1847 | 0 | 0 | 0.00% | 0.00% |  |
| D | 1847 | 1847 | 0 | 0 | 0.00% | 0.00% |  |
Top three noisy pixels from each quadrant. If the there are fewer than three noisy pixels in the level2.evt file, extra rows are filled as -1
| Pixel properties | Quadrant properties | ||||||
|---|---|---|---|---|---|---|---|
| Quadrant | DetID | PixID | Counts | Sigma | Mean | Median | Sigma |
| A | 7 | 110 | 84 | 8.9 | 22 | 21 | 7.1 |
| A | 10 | 83 | 72 | 7.2 | 22 | 21 | 7.1 |
| A | 15 | 236 | 66 | 6.36 | 22 | 21 | 7.1 |
| B | 2 | 9 | 71 | 8.18 | 22 | 21 | 6.1 |
| B | 14 | 254 | 59 | 6.21 | 22 | 21 | 6.1 |
| B | 5 | 225 | 57 | 5.89 | 22 | 21 | 6.1 |
| C | 12 | 241 | 59 | 5.5 | 21 | 20 | 7.1 |
| C | 9 | 242 | 59 | 5.5 | 21 | 20 | 7.1 |
| C | 12 | 18 | 56 | 5.08 | 21 | 20 | 7.1 |
| D | 7 | 5 | 62 | 6.66 | 20 | 18 | 6.6 |
| D | 6 | 114 | 55 | 5.6 | 20 | 18 | 6.6 |
| D | 10 | 189 | 53 | 5.3 | 20 | 18 | 6.6 |
Histogram calculated using DETX and DETY for each event in the final _common_clean file
| Quadrant A | 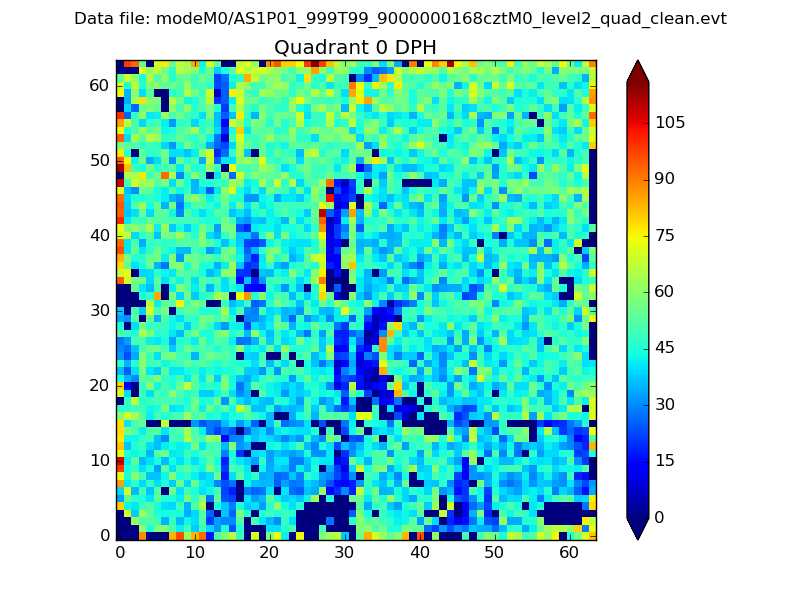 |
 |
Quadrant B |
|---|---|---|---|
| Quadrant D | 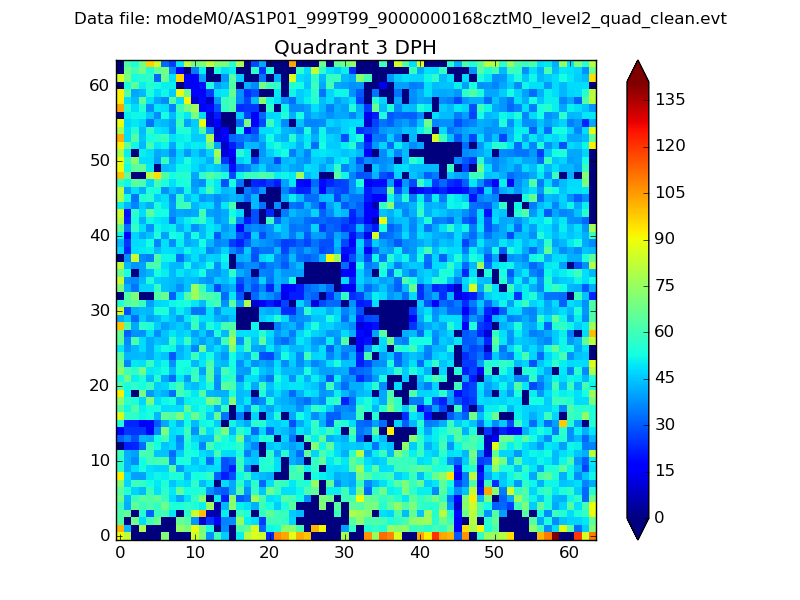 |
 |
Quadrant C |
| Plot type | Count rate plots | Images |
|---|---|---|
| Comparison with Poisson distribution Blue bars denote a histogram of data divided into 1 sec bins. Red curve is a Poisson curve with rate = median count rate of data. |
 |
 |
| Quadrant-wise count rates Data is divided into 100 sec bins |
 |
|
| Module-wise count rates for Quadrant A Data is divided into 100 sec bins |
 |
 |
| Module-wise count rates for Quadrant B Data is divided into 100 sec bins |
 |
 |
| Module-wise count rates for Quadrant C Data is divided into 100 sec bins |
 |
 |
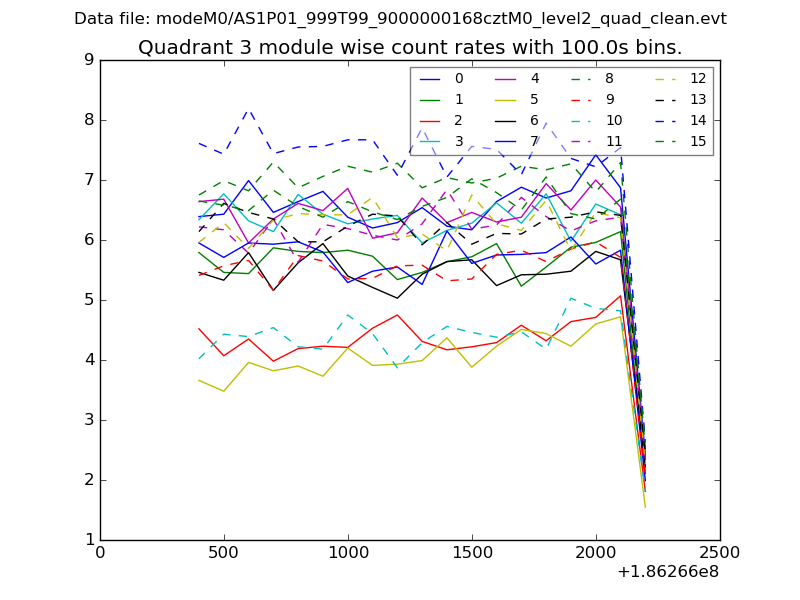
| Module-wise count rates for Quadrant D Data is divided into 100 sec bins |
 |
 |
| Parameter | Plot |
|---|---|
| CZT HV Monitor |  |
| D_VDD | 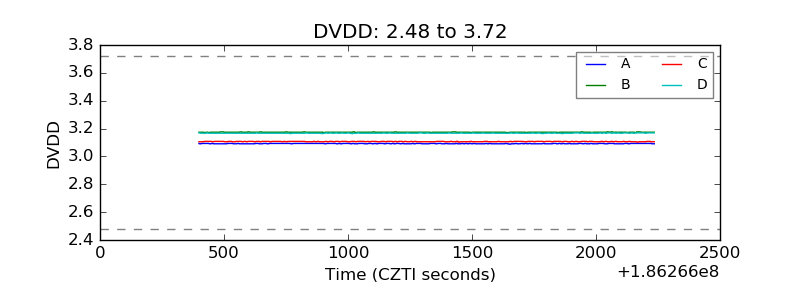 |
| Temperature 1 |  |
| Veto HV Monitor |  |
| Veto LLD | 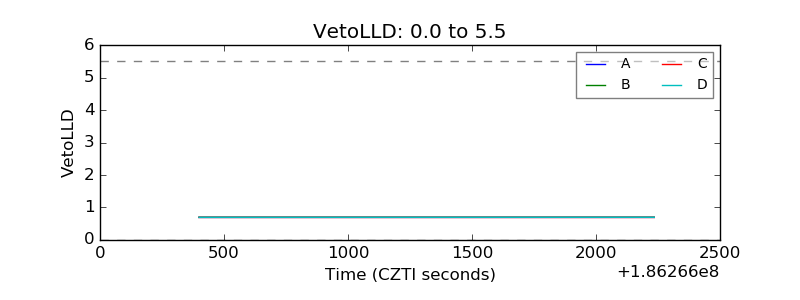 |
| Alpha Counter |  |
| _CPM_Rate |  |
| CZT Counter |  |
| +2.5 Volts monitor |  |
| +5 Volts monitor |  |
| _ROLL_ROT |  |
| _Roll_DEC |  |
| _Roll_RA |  |
| Veto Counter |  |