| Param | Original file | Final file |
|---|---|---|
| Filename | modeM0/AS1P01_999T99_9000000172cztM0_level2.fits | modeM0/AS1P01_999T99_9000000172cztM0_level2_quad_clean.evt |
| Size (bytes) | 14,610,240 | 15,310,080 |
| Size | 13.9 MB | 14.6 MB |
| Events in quadrant A | 80,890 | 85,081 |
| Events in quadrant B | 78,380 | 81,396 |
| Events in quadrant C | 78,562 | 83,787 |
| Events in quadrant D | 69,498 | 77,166 |
| Mode M0 | |||
|---|---|---|---|
| Quadrant | BADHDUFLAG | Total packets | Discarded packets |
| A | 0 | 7156 | 0 |
| B | 0 | 8723 | 0 |
| C | 0 | 6834 | 0 |
| D | 0 | 6258 | 0 |
| Mode SS | |||
|---|---|---|---|
| Quadrant | BADHDUFLAG | Total packets | Discarded packets |
| A | 0 | 38 | 0 |
| B | 0 | 38 | 0 |
| C | 0 | 38 | 0 |
| D | 0 | 38 | 0 |
| Quadrant | Total seconds | Saturated seconds | Saturation percentage |
|---|---|---|---|
| A | 1848 | 0 | 0.000000% |
| B | 1848 | 72 | 3.896104% |
| C | 1848 | 0 | 0.000000% |
| D | 1848 | 0 | 0.000000% |
Noise dominated data is calculated using 1-second bins in cleaned event files. If a bin has >2000 counts, and if more than 50% of those come from <1% of pixels, then it is considered to be noise-dominated and hence unusable.
| Quadrant | # 1 sec bins | Bins with >0 counts | Bins with >2000 counts | High rate bins dominated by noise | Noise dominated (total time) | Noise dominated (detector-on time) | Marked lightcurve |
|---|---|---|---|---|---|---|---|
| A | 1847 | 1847 | 0 | 0 | 0.00% | 0.00% | 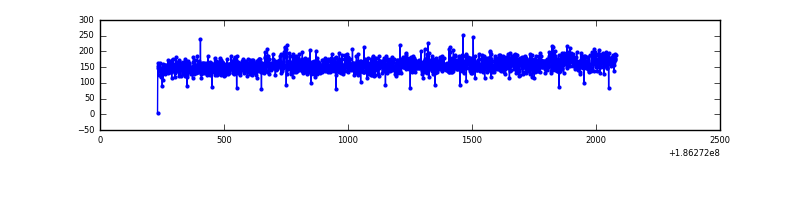 |
| B | 1848 | 1848 | 0 | 0 | 0.00% | 0.00% | 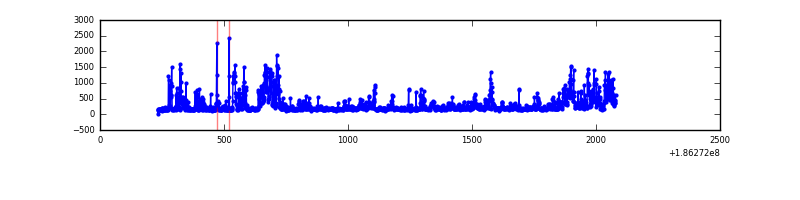 |
| C | 1847 | 1847 | 0 | 0 | 0.00% | 0.00% | 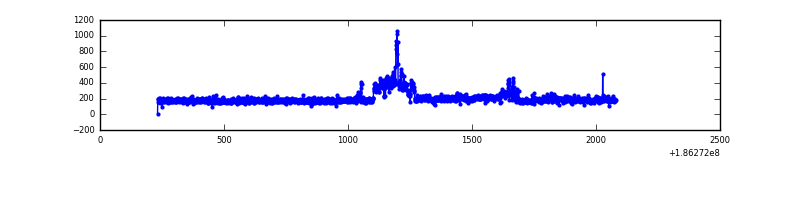 |
| D | 1848 | 1848 | 0 | 0 | 0.00% | 0.00% | 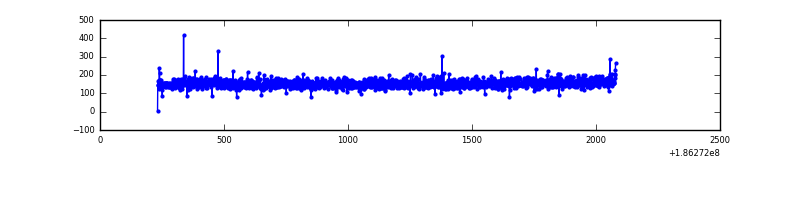 |
Top three noisy pixels from each quadrant. If the there are fewer than three noisy pixels in the level2.evt file, extra rows are filled as -1
| Pixel properties | Quadrant properties | ||||||
|---|---|---|---|---|---|---|---|
| Quadrant | DetID | PixID | Counts | Sigma | Mean | Median | Sigma |
| A | 0 | 30 | 65 | 6.75 | 21 | 20 | 6.7 |
| A | 15 | 47 | 64 | 6.6 | 21 | 20 | 6.7 |
| A | 0 | 29 | 63 | 6.45 | 21 | 20 | 6.7 |
| B | 2 | 9 | 63 | 7.24 | 20 | 20 | 5.9 |
| B | 8 | 225 | 51 | 5.22 | 20 | 20 | 5.9 |
| B | -1 | -1 | -1 | -1.0 | 20 | 20 | 5.9 |
| C | 3 | 202 | 65 | 6.66 | 20 | 19 | 6.9 |
| C | 15 | 65 | 61 | 6.08 | 20 | 19 | 6.9 |
| C | 7 | 219 | 59 | 5.79 | 20 | 19 | 6.9 |
| D | 6 | 44 | 59 | 6.35 | 19 | 18 | 6.5 |
| D | 1 | 19 | 57 | 6.04 | 19 | 18 | 6.5 |
| D | 6 | 232 | 52 | 5.27 | 19 | 18 | 6.5 |
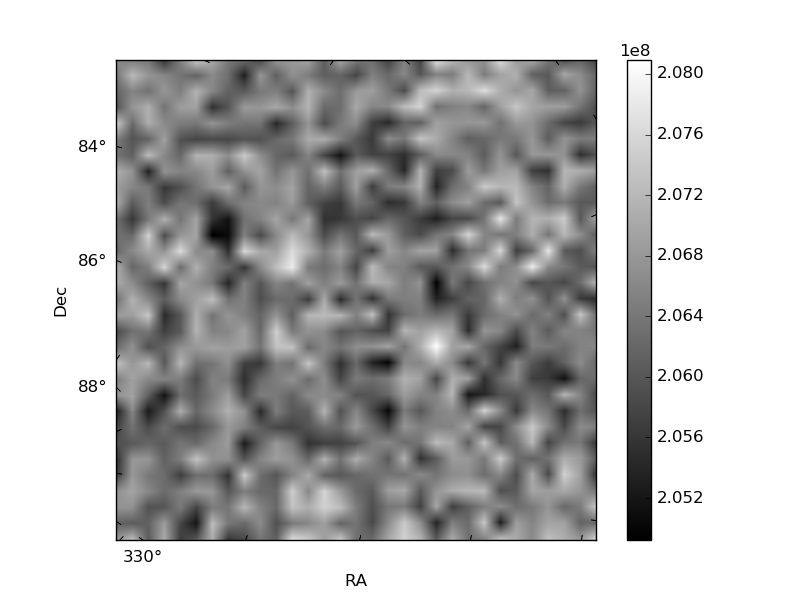
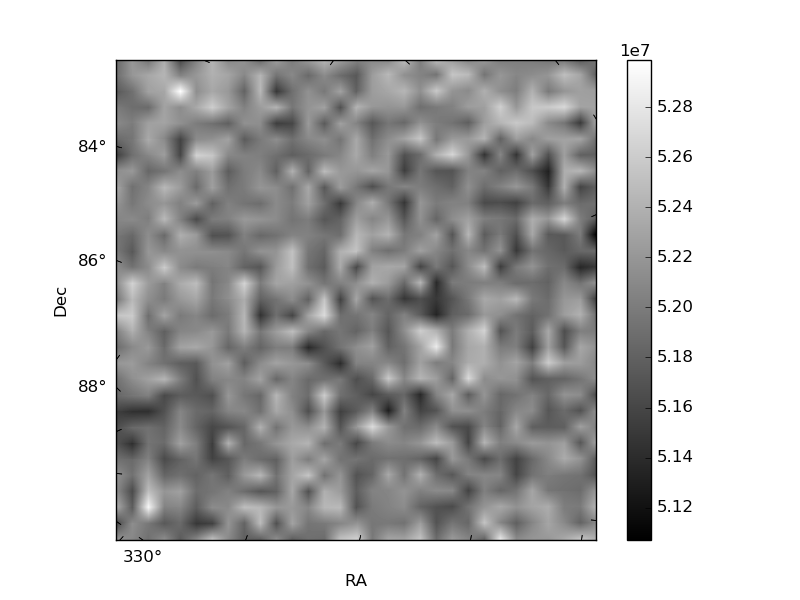
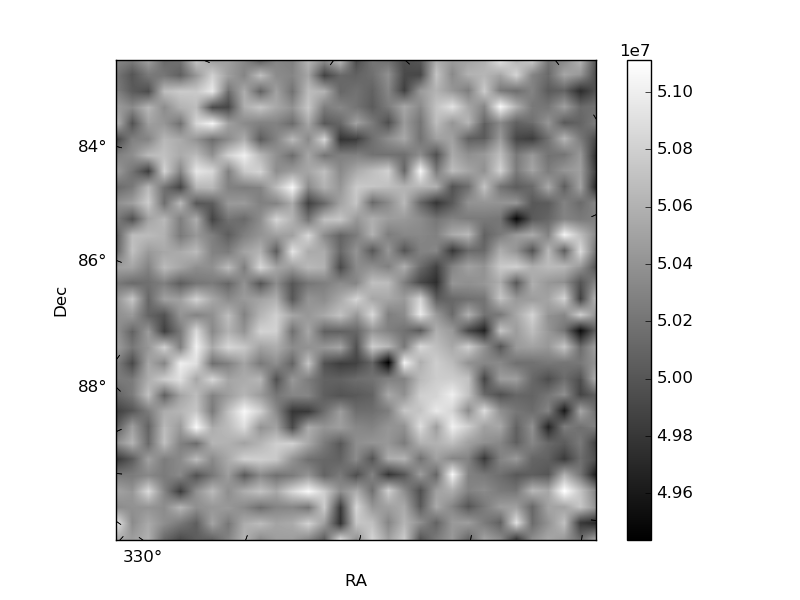
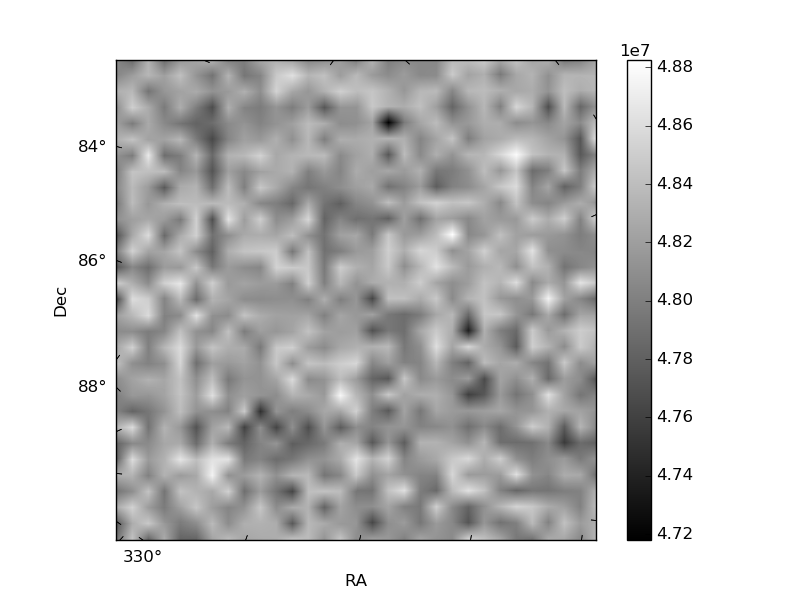
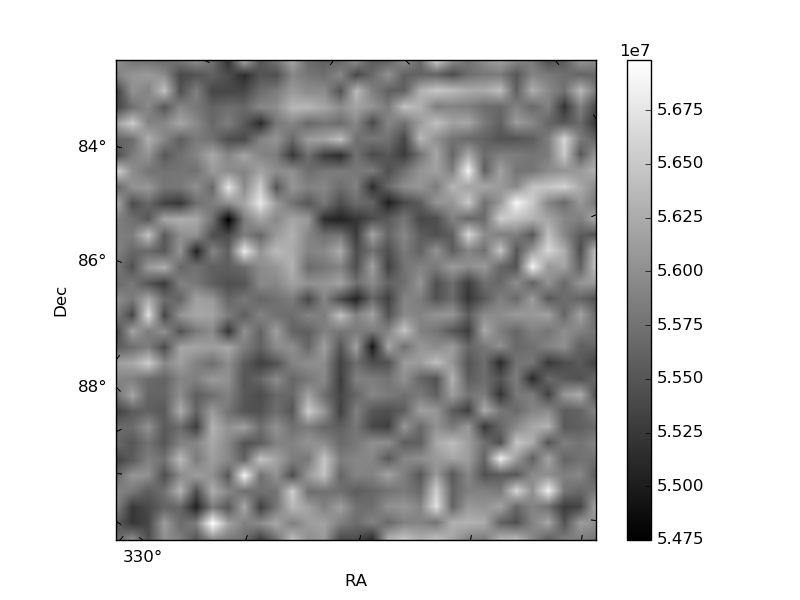
Histogram calculated using DETX and DETY for each event in the final _common_clean file
| Quadrant A | 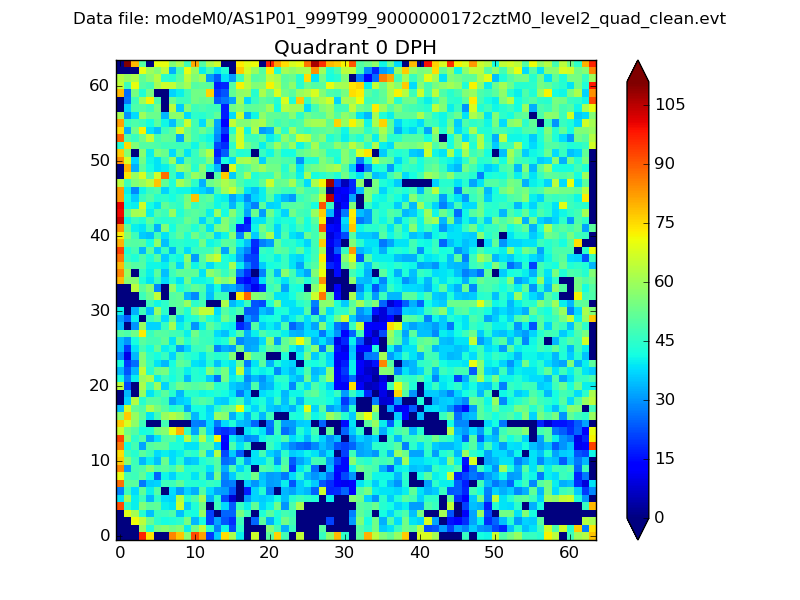 |
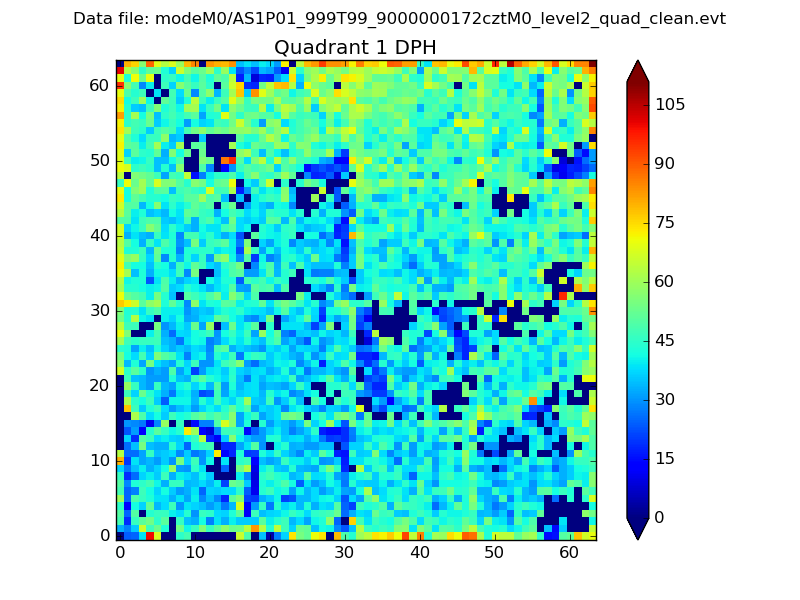 |
Quadrant B |
|---|---|---|---|
| Quadrant D | 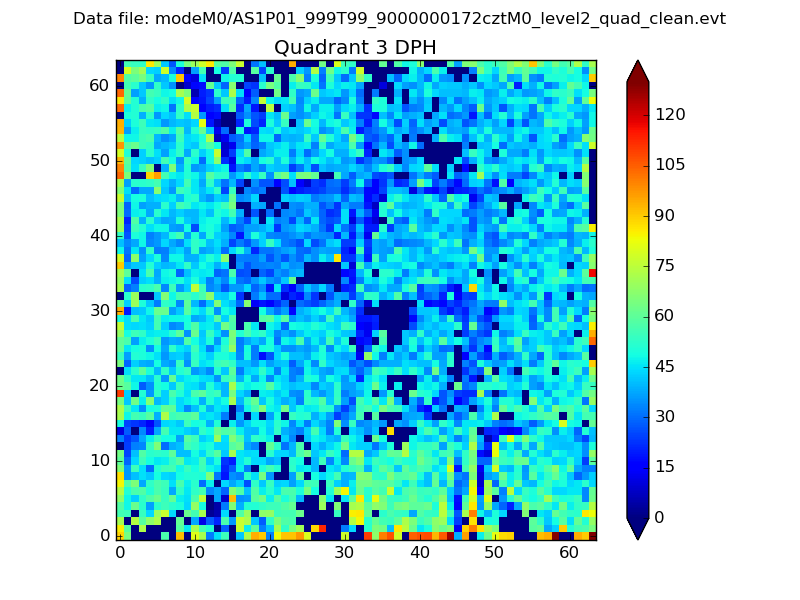 |
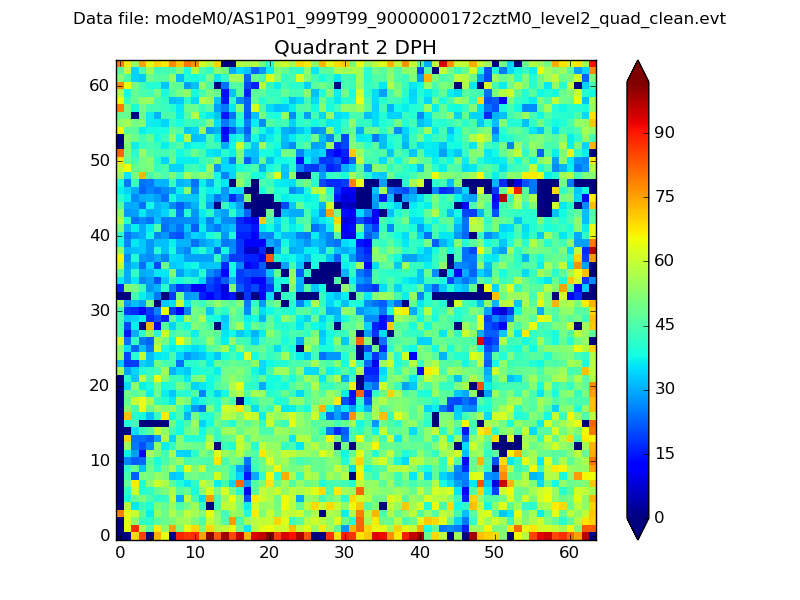 |
Quadrant C |
| Plot type | Count rate plots | Images |
|---|---|---|
| Comparison with Poisson distribution Blue bars denote a histogram of data divided into 1 sec bins. Red curve is a Poisson curve with rate = median count rate of data. |
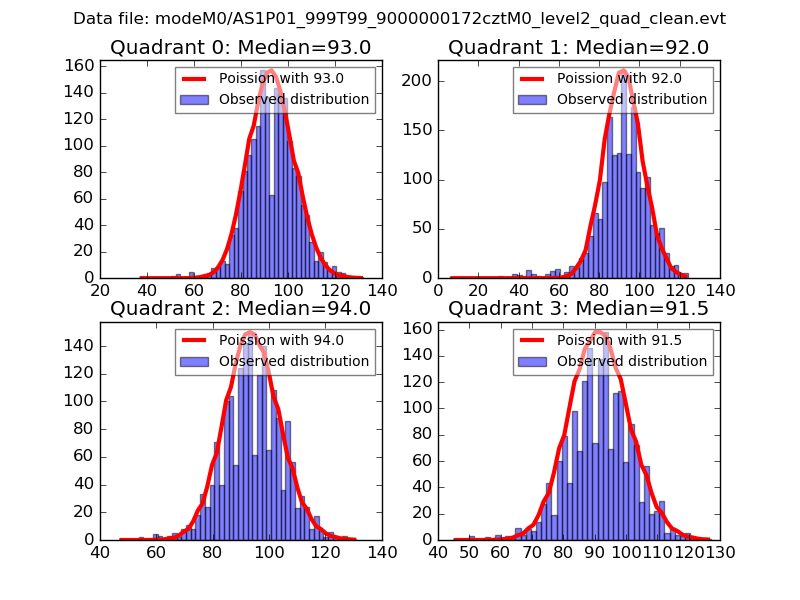 |
 |
| Quadrant-wise count rates Data is divided into 100 sec bins |
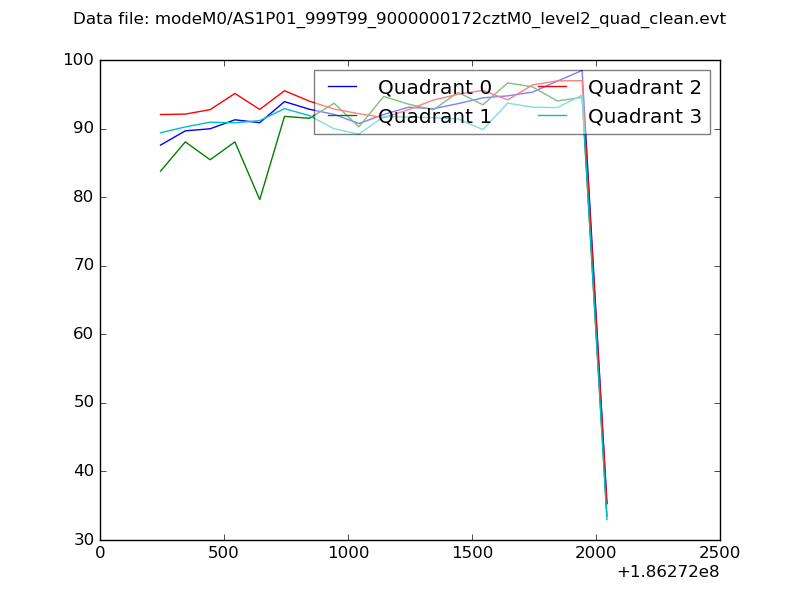 |
|
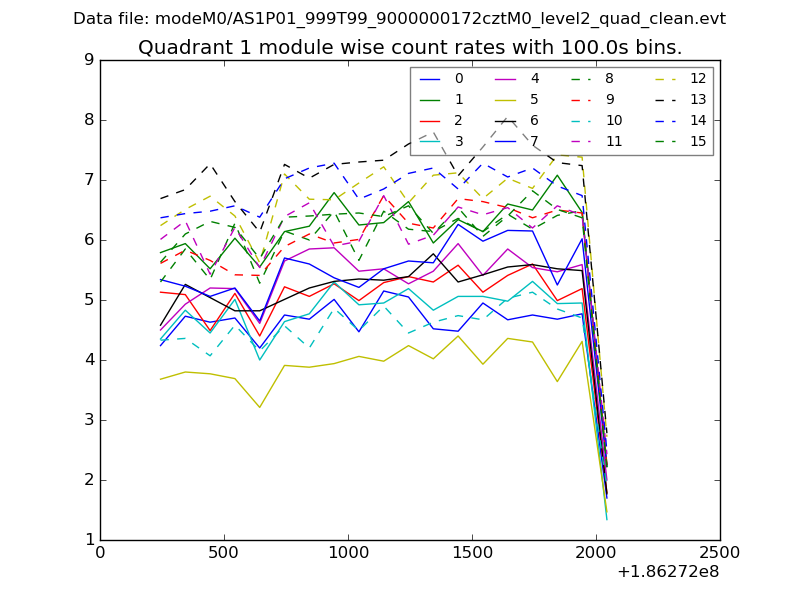
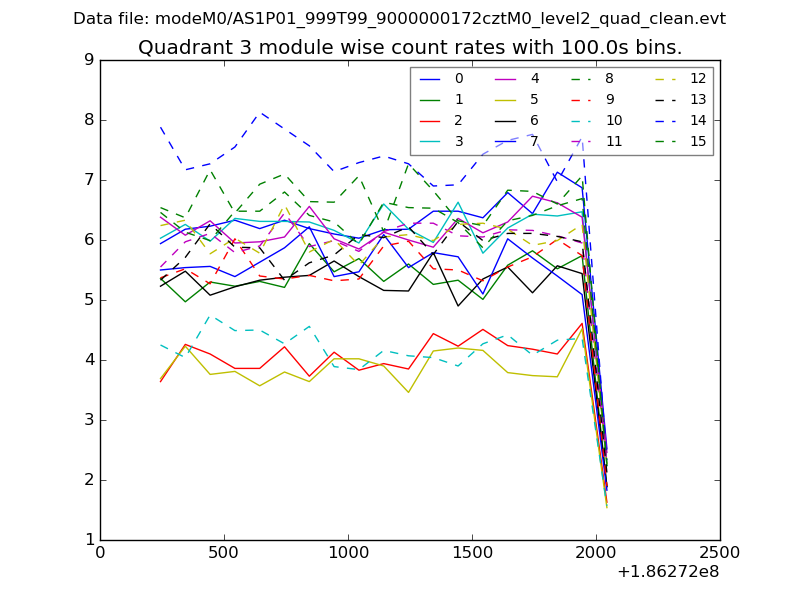
| Module-wise count rates for Quadrant A Data is divided into 100 sec bins |
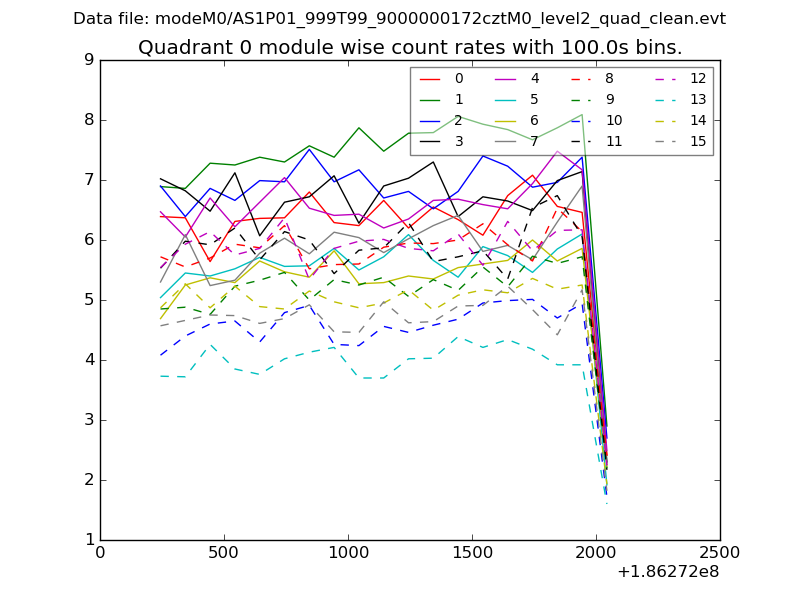 |
 |
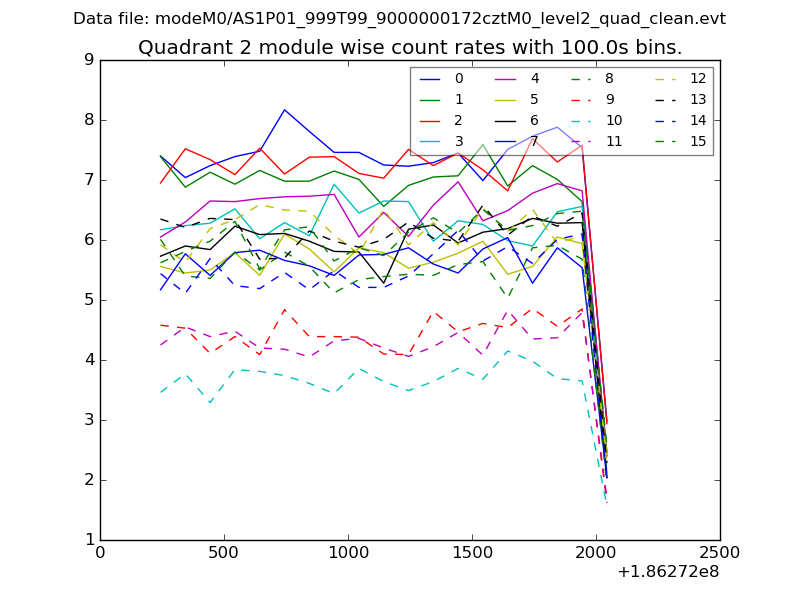
| Module-wise count rates for Quadrant B Data is divided into 100 sec bins |
 |
 |
| Module-wise count rates for Quadrant C Data is divided into 100 sec bins |
 |
 |
| Module-wise count rates for Quadrant D Data is divided into 100 sec bins |
 |
 |
| Parameter | Plot |
|---|---|
| CZT HV Monitor | 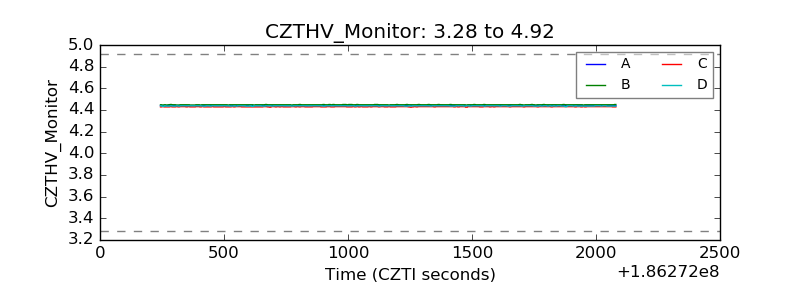 |
| D_VDD | 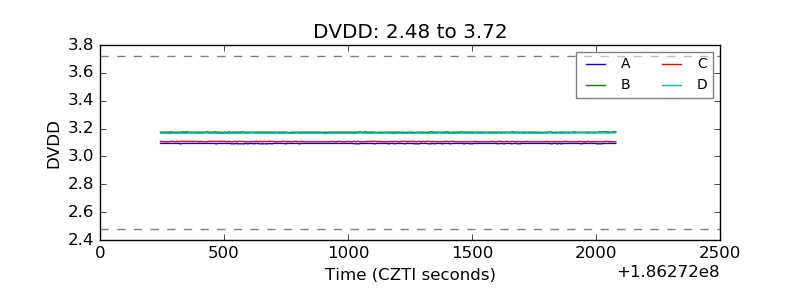 |
| Temperature 1 | 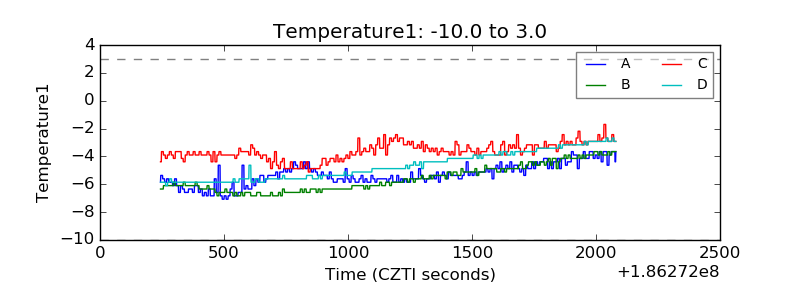 |
| Veto HV Monitor |  |
| Veto LLD | 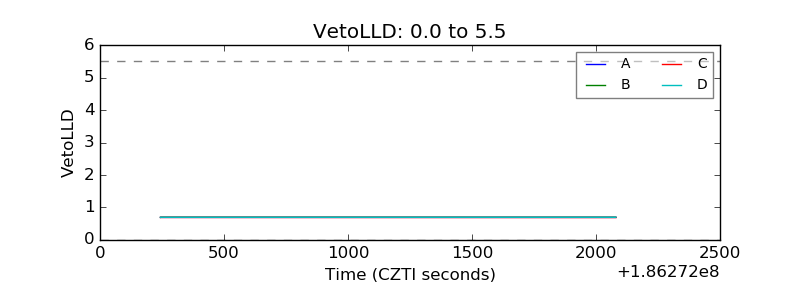 |
| Alpha Counter | 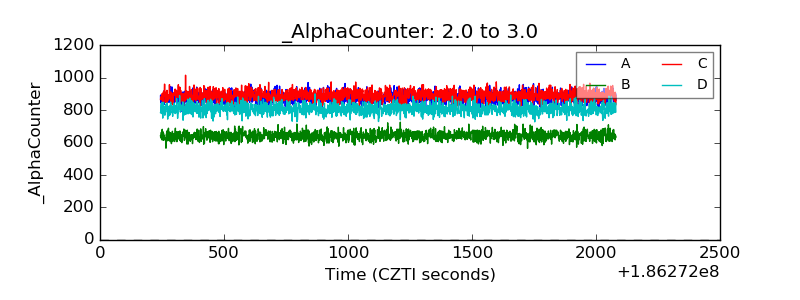 |
| _CPM_Rate | 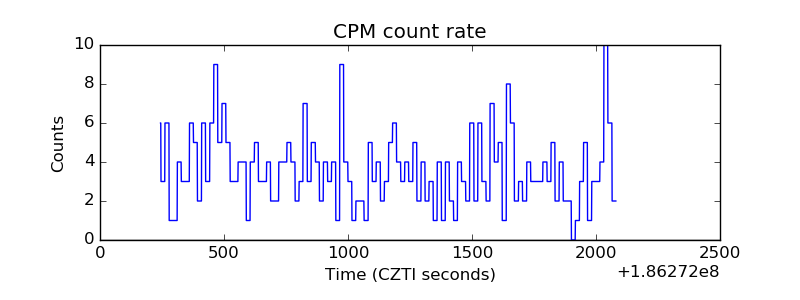 |
| CZT Counter | 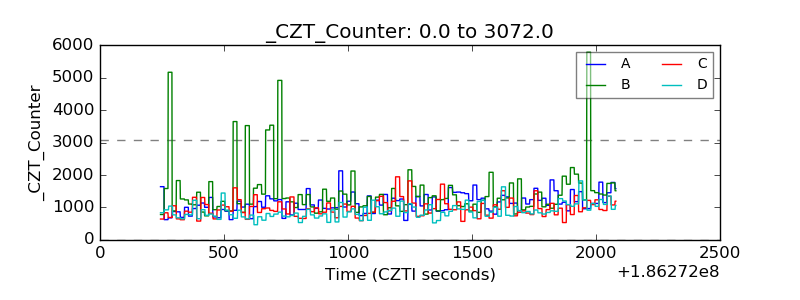 |
| +2.5 Volts monitor | 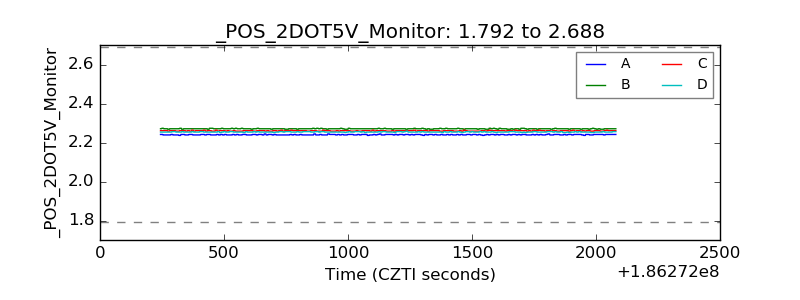 |
| +5 Volts monitor | 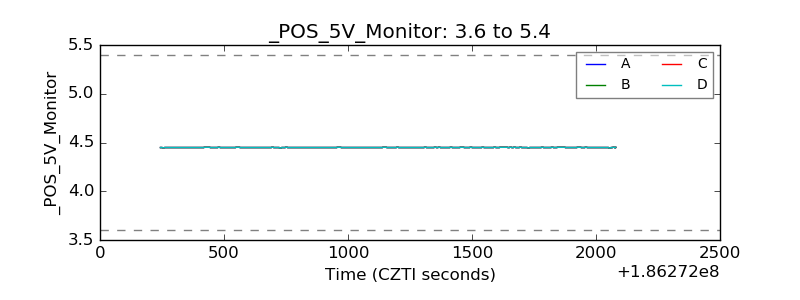 |
| _ROLL_ROT | 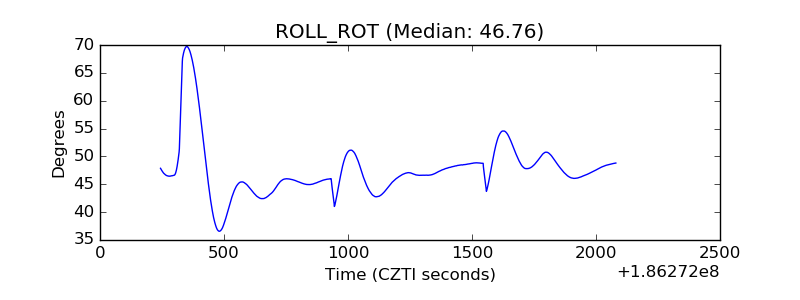 |
| _Roll_DEC | 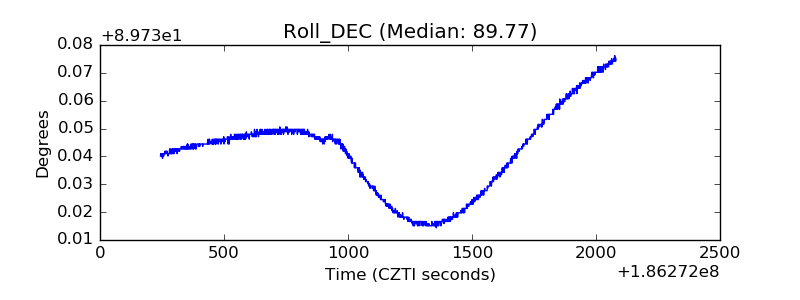 |
| _Roll_RA | 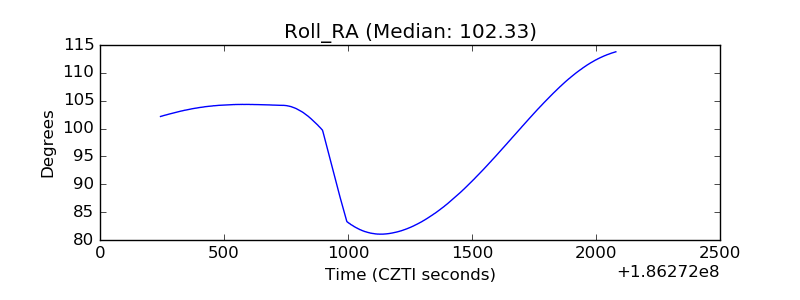 |
| Veto Counter | 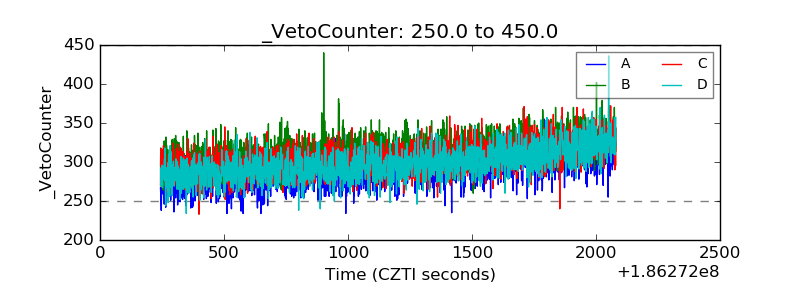 |