| Param | Original file | Final file |
|---|---|---|
| Filename | modeM0/AS1P01_999T99_9000000176cztM0_level2.fits | modeM0/AS1P01_999T99_9000000176cztM0_level2_quad_clean.evt |
| Size (bytes) | 14,423,040 | 16,511,040 |
| Size | 13.8 MB | 15.7 MB |
| Events in quadrant A | 79,698 | 92,280 |
| Events in quadrant B | 78,452 | 94,092 |
| Events in quadrant C | 76,580 | 92,667 |
| Events in quadrant D | 67,404 | 85,187 |
| Mode M0 | |||
|---|---|---|---|
| Quadrant | BADHDUFLAG | Total packets | Discarded packets |
| A | 0 | 7170 | 0 |
| B | 0 | 7316 | 0 |
| C | 0 | 6590 | 0 |
| D | 0 | 6228 | 0 |
| Mode SS | |||
|---|---|---|---|
| Quadrant | BADHDUFLAG | Total packets | Discarded packets |
| A | 0 | 36 | 0 |
| B | 0 | 36 | 0 |
| C | 0 | 36 | 0 |
| D | 0 | 36 | 0 |
| Quadrant | Total seconds | Saturated seconds | Saturation percentage |
|---|---|---|---|
| A | 1848 | 0 | 0.000000% |
| B | 1848 | 0 | 0.000000% |
| C | 1848 | 0 | 0.000000% |
| D | 1848 | 0 | 0.000000% |
Noise dominated data is calculated using 1-second bins in cleaned event files. If a bin has >2000 counts, and if more than 50% of those come from <1% of pixels, then it is considered to be noise-dominated and hence unusable.
| Quadrant | # 1 sec bins | Bins with >0 counts | Bins with >2000 counts | High rate bins dominated by noise | Noise dominated (total time) | Noise dominated (detector-on time) | Marked lightcurve |
|---|---|---|---|---|---|---|---|
| A | 1847 | 1847 | 0 | 0 | 0.00% | 0.00% |  |
| B | 1847 | 1847 | 0 | 0 | 0.00% | 0.00% |  |
| C | 1847 | 1847 | 0 | 0 | 0.00% | 0.00% | 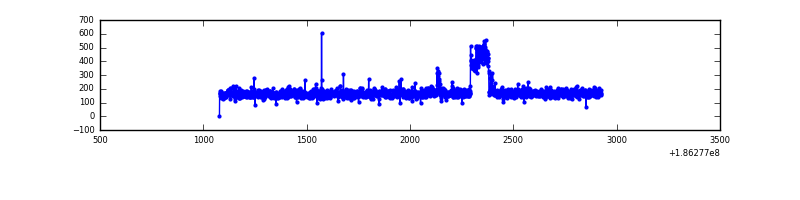 |
| D | 1847 | 1847 | 0 | 0 | 0.00% | 0.00% |  |
Top three noisy pixels from each quadrant. If the there are fewer than three noisy pixels in the level2.evt file, extra rows are filled as -1
| Pixel properties | Quadrant properties | ||||||
|---|---|---|---|---|---|---|---|
| Quadrant | DetID | PixID | Counts | Sigma | Mean | Median | Sigma |
| A | 0 | 29 | 85 | 9.8 | 20 | 19 | 6.7 |
| A | 0 | 28 | 75 | 8.32 | 20 | 19 | 6.7 |
| A | 7 | 110 | 71 | 7.72 | 20 | 19 | 6.7 |
| B | 2 | 9 | 62 | 7.22 | 20 | 19 | 6.0 |
| B | 2 | 18 | 60 | 6.89 | 20 | 19 | 6.0 |
| B | 5 | 128 | 56 | 6.21 | 20 | 19 | 6.0 |
| C | 15 | 177 | 54 | 5.32 | 20 | 18 | 6.8 |
| C | 2 | 191 | 54 | 5.32 | 20 | 18 | 6.8 |
| C | 14 | 66 | 52 | 5.02 | 20 | 18 | 6.8 |
| D | 11 | 82 | 57 | 6.38 | 19 | 17 | 6.3 |
| D | 6 | 114 | 52 | 5.58 | 19 | 17 | 6.3 |
| D | 3 | 246 | 51 | 5.42 | 19 | 17 | 6.3 |
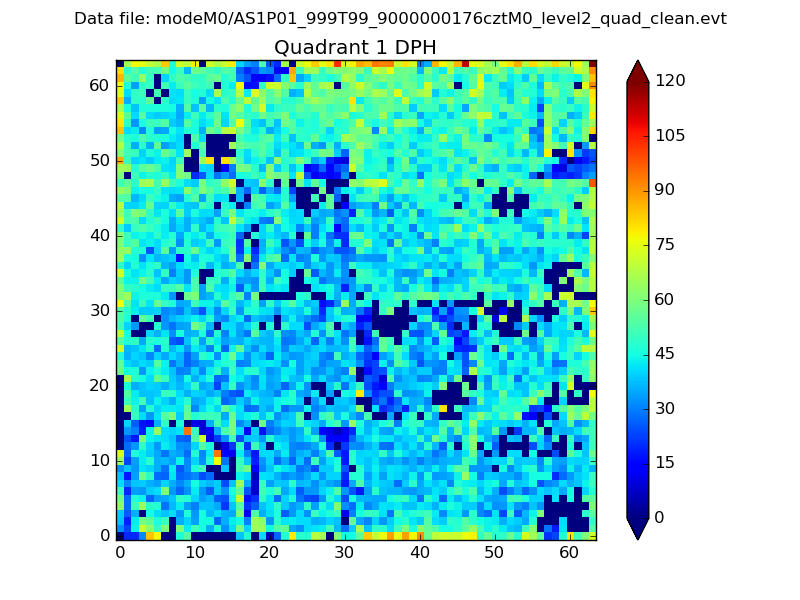
Histogram calculated using DETX and DETY for each event in the final _common_clean file
| Quadrant A |  |
 |
Quadrant B |
|---|---|---|---|
| Quadrant D | 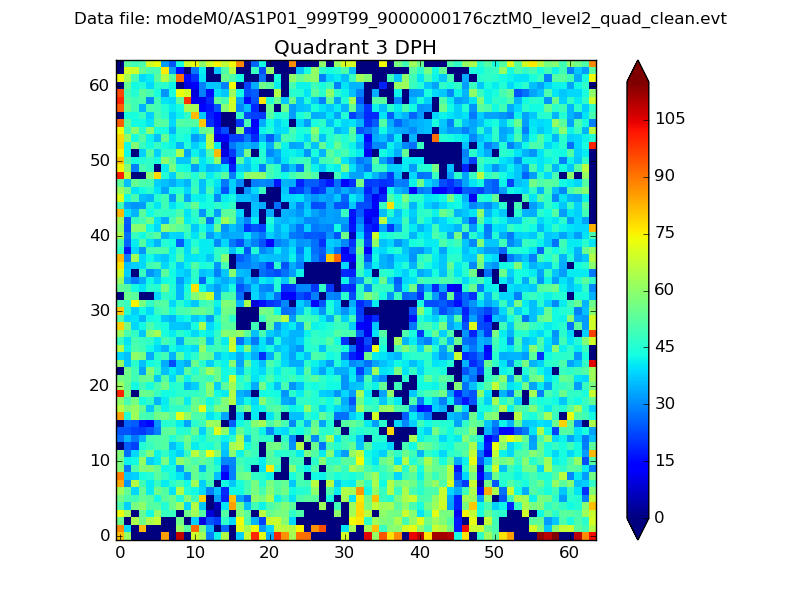 |
 |
Quadrant C |
| Plot type | Count rate plots | Images |
|---|---|---|
| Comparison with Poisson distribution Blue bars denote a histogram of data divided into 1 sec bins. Red curve is a Poisson curve with rate = median count rate of data. |
 |
 |
| Quadrant-wise count rates Data is divided into 100 sec bins |
 |
|
| Module-wise count rates for Quadrant A Data is divided into 100 sec bins |
 |
 |
| Module-wise count rates for Quadrant B Data is divided into 100 sec bins |
 |
 |
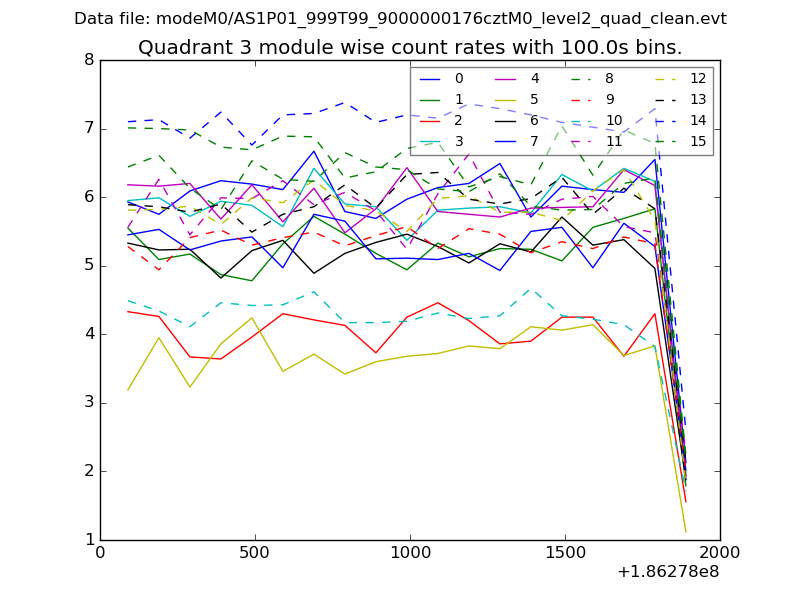
| Module-wise count rates for Quadrant C Data is divided into 100 sec bins |
 |
 |
| Module-wise count rates for Quadrant D Data is divided into 100 sec bins |
 |
 |
| Parameter | Plot |
|---|---|
| CZT HV Monitor |  |
| D_VDD |  |
| Temperature 1 |  |
| Veto HV Monitor |  |
| Veto LLD |  |
| Alpha Counter | 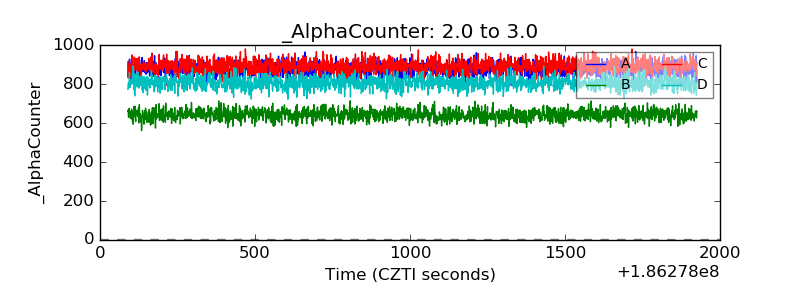 |
| _CPM_Rate |  |
| CZT Counter |  |
| +2.5 Volts monitor |  |
| +5 Volts monitor |  |
| _ROLL_ROT |  |
| _Roll_DEC |  |
| _Roll_RA |  |
| Veto Counter | 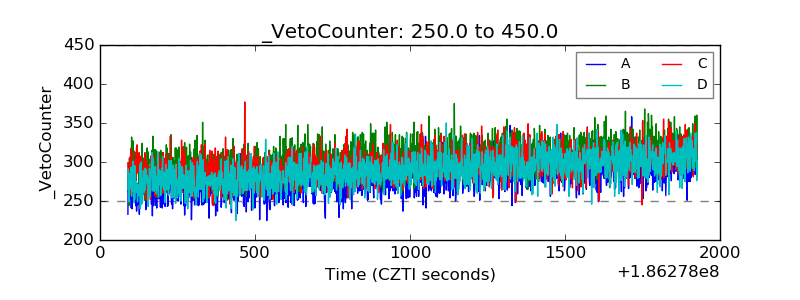 |