| Param | Original file | Final file |
|---|---|---|
| Filename | modeM0/AS1P01_161T03_9000000178_00888cztM0_level2.evt | modeM0/AS1P01_161T03_9000000178_00888cztM0_level2_quad_clean.evt |
| Size (bytes) | 1,269,408,960 | 68,184,000 |
| Size | 1.2 GB | 65.0 MB |
| Events in quadrant A | 9,011,513 | 401,506 |
| Events in quadrant B | 11,567,525 | 371,907 |
| Events in quadrant C | 8,819,332 | 398,199 |
| Events in quadrant D | 8,554,709 | 375,650 |
| Mode SS | |||
|---|---|---|---|
| Quadrant | BADHDUFLAG | Total packets | Discarded packets |
| A | 0 | 150 | 0 |
| B | 0 | 150 | 0 |
| C | 0 | 150 | 0 |
| D | 0 | 150 | 0 |
| Mode M0 | |||
|---|---|---|---|
| Quadrant | BADHDUFLAG | Total packets | Discarded packets |
| A | 0 | 32018 | 0 |
| B | 0 | 39625 | 0 |
| C | 0 | 31481 | 0 |
| D | 0 | 30690 | 0 |
| Quadrant | Total seconds | Saturated seconds | Saturation percentage |
|---|---|---|---|
| A | 7421 | 21 | 0.282981% |
| B | 7421 | 586 | 7.896510% |
| C | 7422 | 18 | 0.242522% |
| D | 7422 | 164 | 2.209647% |
Noise dominated data is calculated using 1-second bins in cleaned event files. If a bin has >2000 counts, and if more than 50% of those come from <1% of pixels, then it is considered to be noise-dominated and hence unusable.
| Quadrant | # 1 sec bins | Bins with >0 counts | Bins with >2000 counts | High rate bins dominated by noise | Noise dominated (total time) | Noise dominated (detector-on time) | Marked lightcurve |
|---|---|---|---|---|---|---|---|
| A | 7461 | 7422 | 350 | 350 | 4.69% | 4.72% | 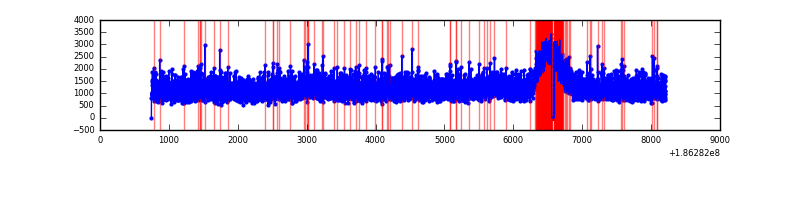 |
| B | 7461 | 7422 | 1422 | 1422 | 19.06% | 19.16% | 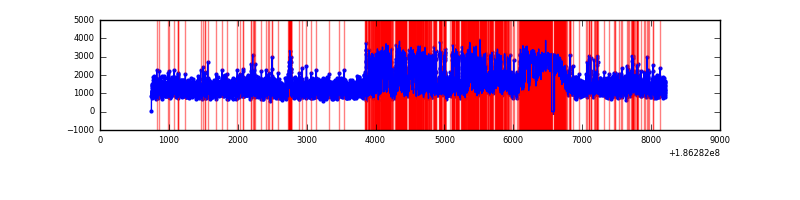 |
| C | 7462 | 7423 | 308 | 308 | 4.13% | 4.15% | 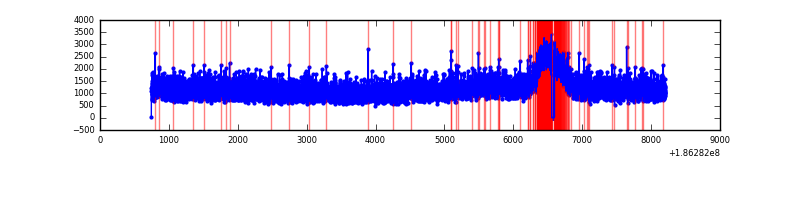 |
| D | 7462 | 7423 | 394 | 394 | 5.28% | 5.31% | 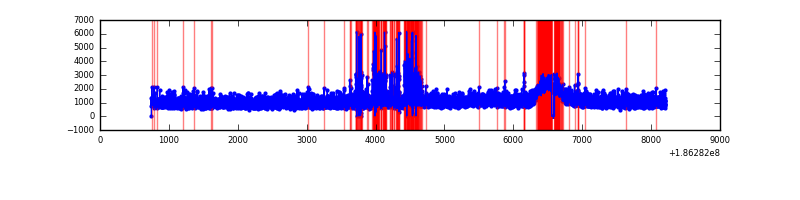 |
Top three noisy pixels from each quadrant. If the there are fewer than three noisy pixels in the level2.evt file, extra rows are filled as -1
| Pixel properties | Quadrant properties | ||||||
|---|---|---|---|---|---|---|---|
| Quadrant | DetID | PixID | Counts | Sigma | Mean | Median | Sigma |
| A | 3 | 80 | 20109 | 31.38 | 2342 | 2359 | 565.6 |
| A | 11 | 79 | 9287 | 12.25 | 2342 | 2359 | 565.6 |
| A | 15 | 127 | 8638 | 11.1 | 2342 | 2359 | 565.6 |
| B | 3 | 0 | 2216319 | 3938.05 | 2377 | 2394 | 562.2 |
| B | 8 | 38 | 158079 | 276.93 | 2377 | 2394 | 562.2 |
| B | 0 | 220 | 41645 | 69.82 | 2377 | 2394 | 562.2 |
| C | 15 | 241 | 38032 | 57.14 | 2232 | 2319 | 625.0 |
| C | 3 | 111 | 29597 | 43.65 | 2232 | 2319 | 625.0 |
| C | 3 | 79 | 14977 | 20.25 | 2232 | 2319 | 625.0 |
| D | 1 | 4 | 36363 | 50.98 | 2222 | 2244 | 669.2 |
| D | 13 | 169 | 21566 | 28.87 | 2222 | 2244 | 669.2 |
| D | 12 | 188 | 18763 | 24.68 | 2222 | 2244 | 669.2 |
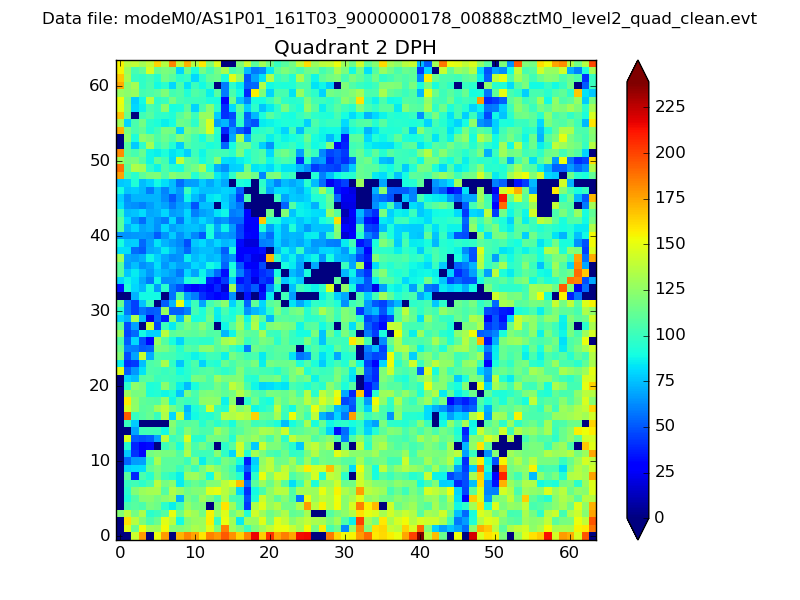
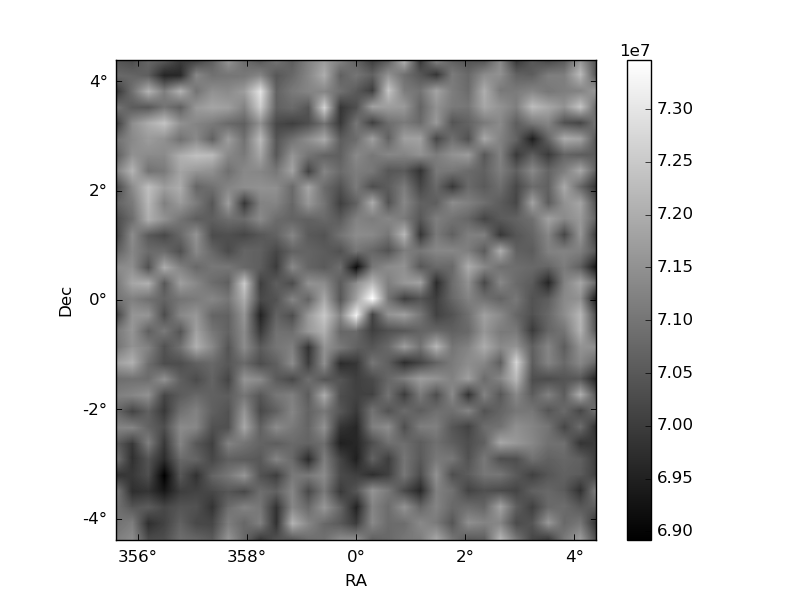
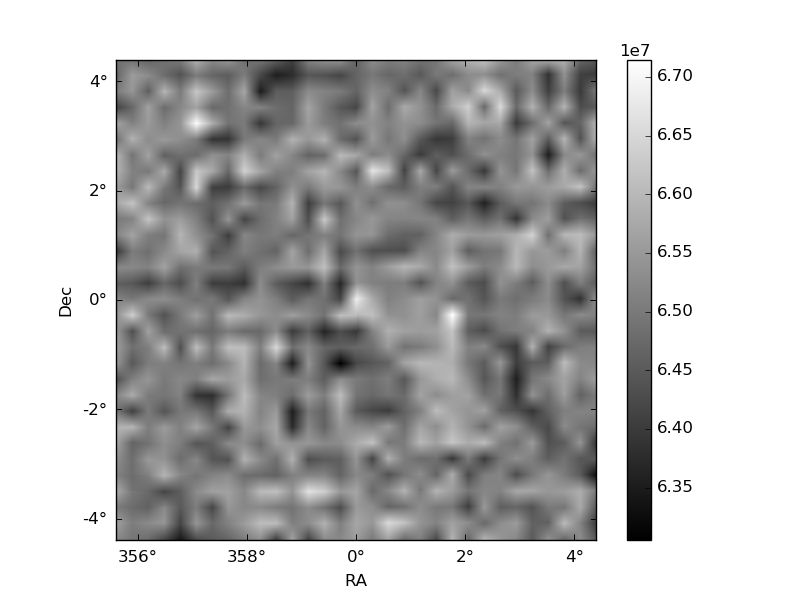
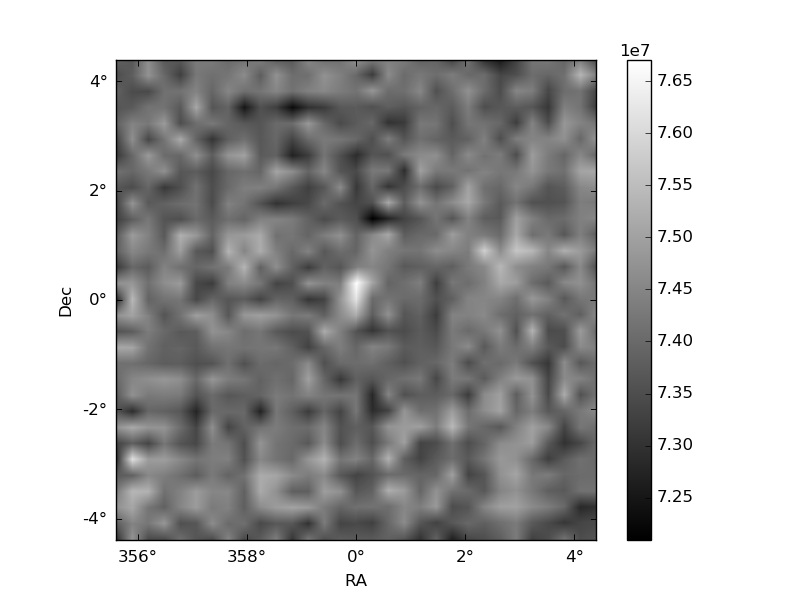
Histogram calculated using DETX and DETY for each event in the final _common_clean file
| Quadrant A |  |
 |
Quadrant B |
|---|---|---|---|
| Quadrant D | 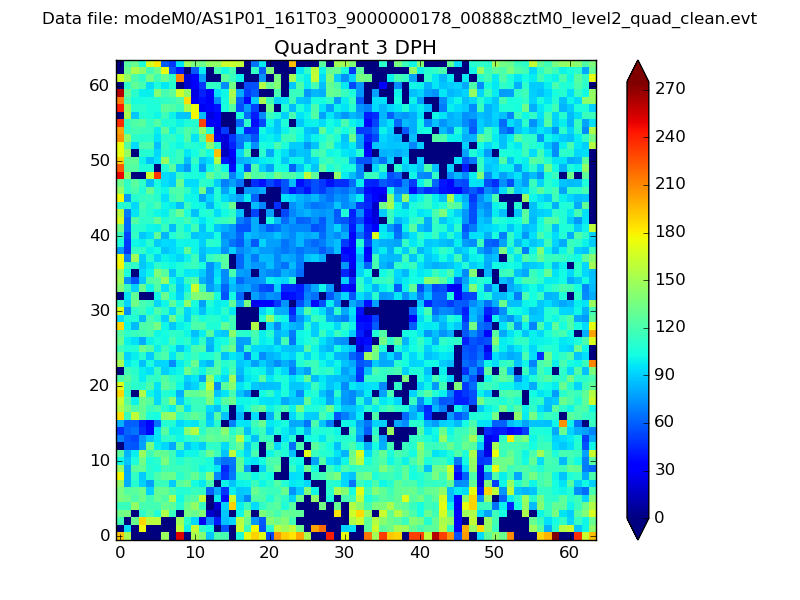 |
 |
Quadrant C |
| Plot type | Count rate plots | Images |
|---|---|---|
| Comparison with Poisson distribution Blue bars denote a histogram of data divided into 1 sec bins. Red curve is a Poisson curve with rate = median count rate of data. |
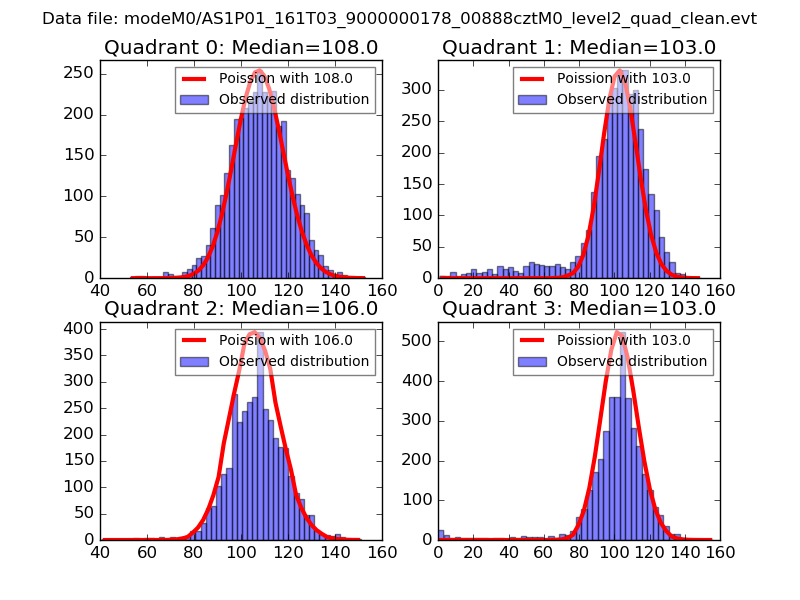 |
 |
| Quadrant-wise count rates Data is divided into 100 sec bins |
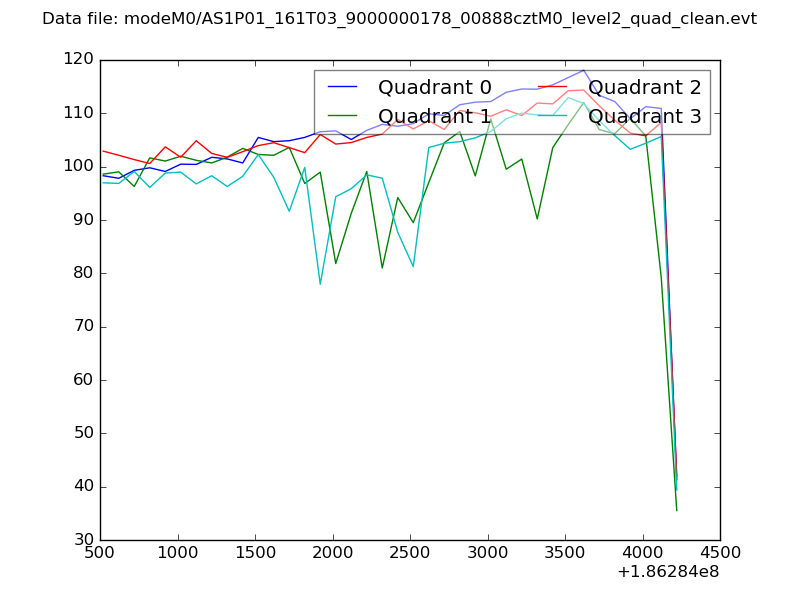 |
|
| Module-wise count rates for Quadrant A Data is divided into 100 sec bins |
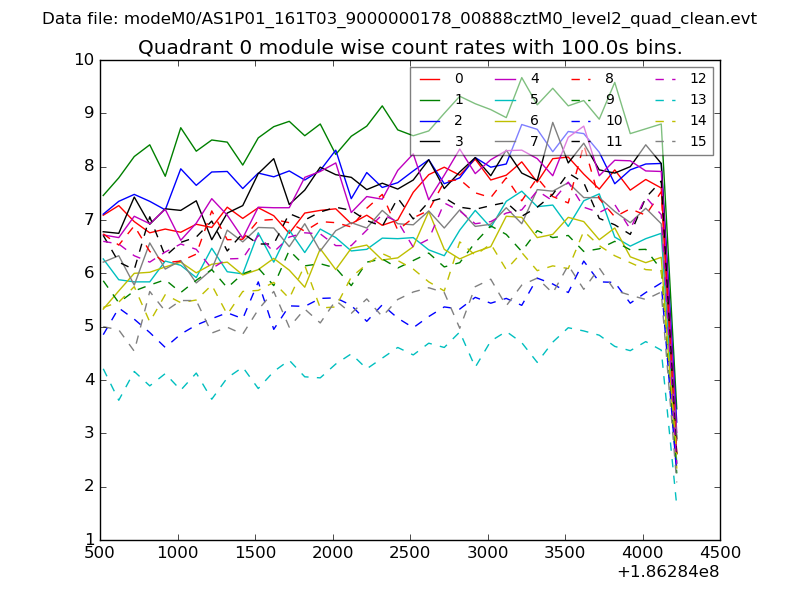 |
 |
| Module-wise count rates for Quadrant B Data is divided into 100 sec bins |
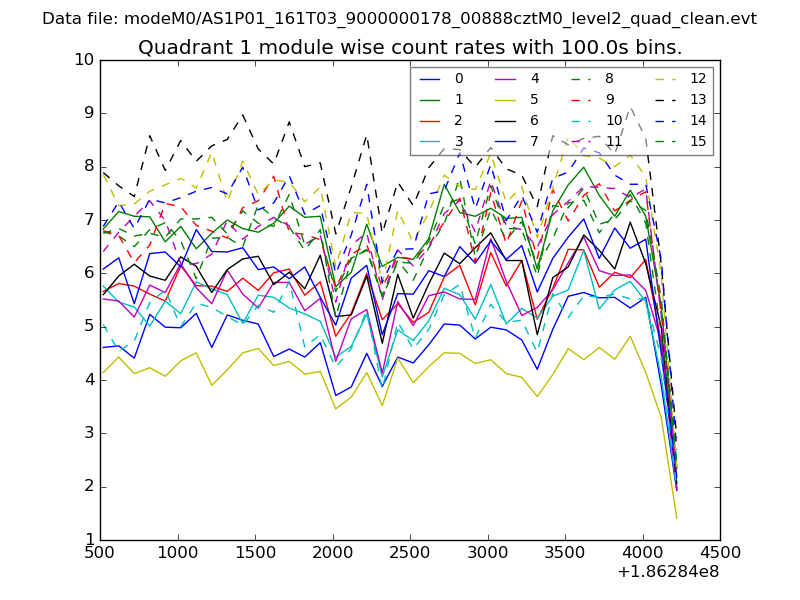 |
 |
| Module-wise count rates for Quadrant C Data is divided into 100 sec bins |
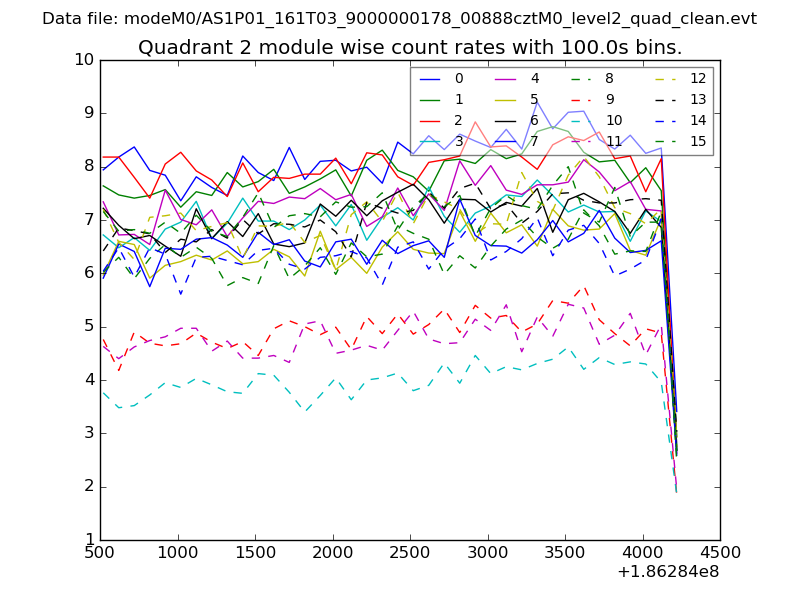 |
 |
| Module-wise count rates for Quadrant D Data is divided into 100 sec bins |
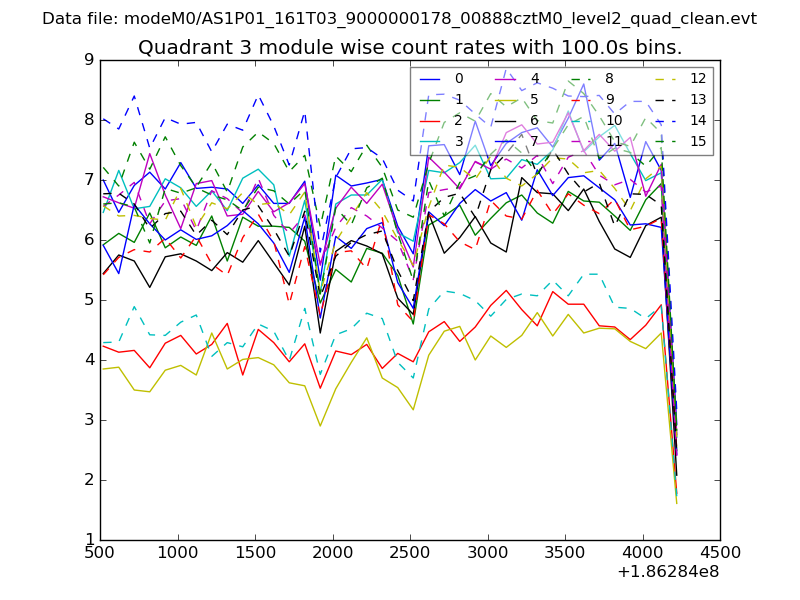 |
 |
| Parameter | Plot |
|---|---|
| CZT HV Monitor | 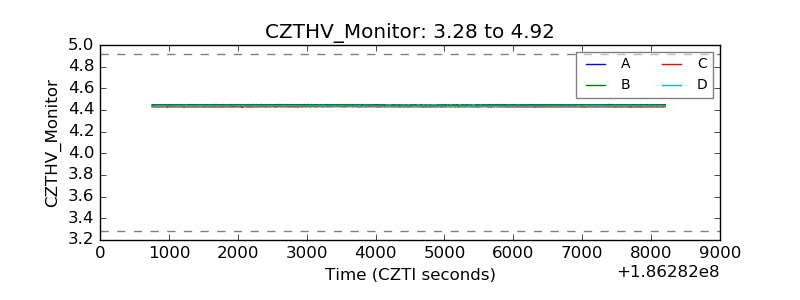 |
| D_VDD | 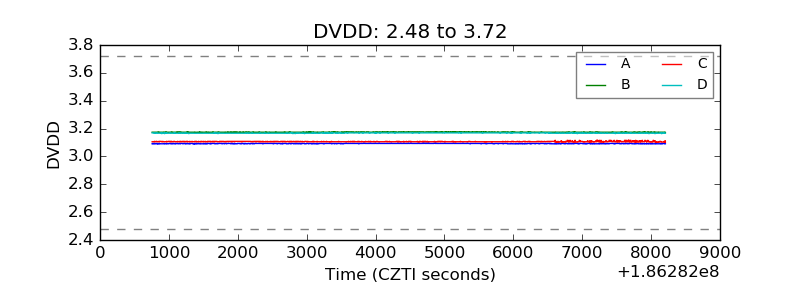 |
| Temperature 1 | 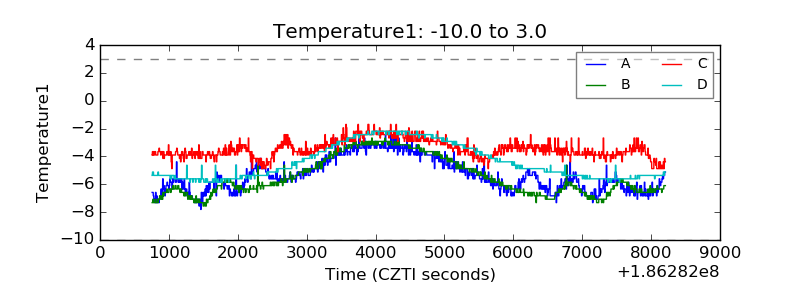 |
| Veto HV Monitor | 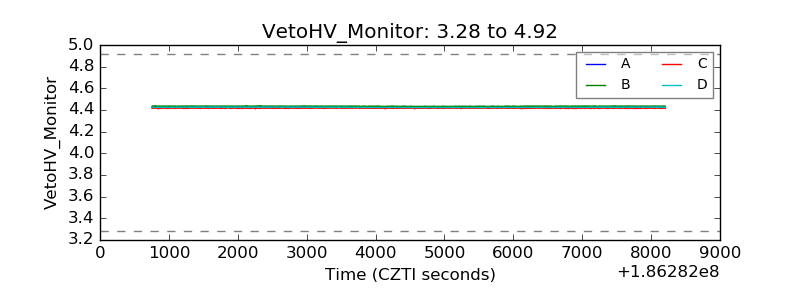 |
| Veto LLD | 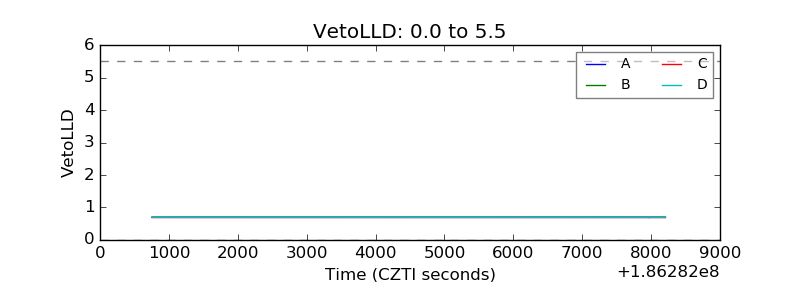 |
| Alpha Counter | 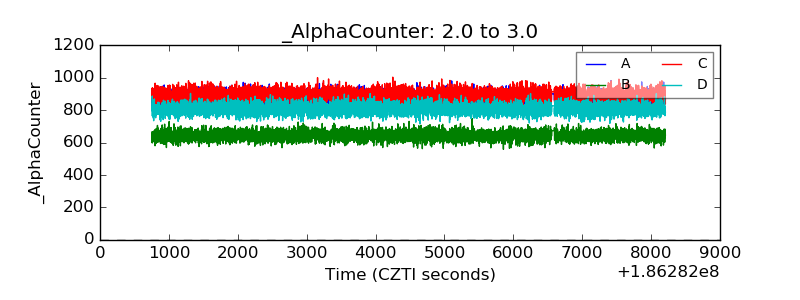 |
| _CPM_Rate | 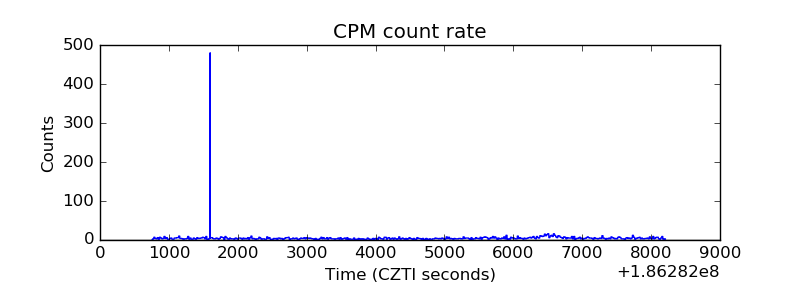 |
| CZT Counter | 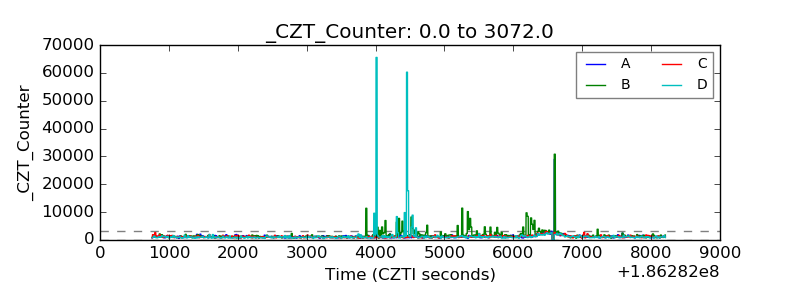 |
| +2.5 Volts monitor |  |
| +5 Volts monitor |  |
| _ROLL_ROT | 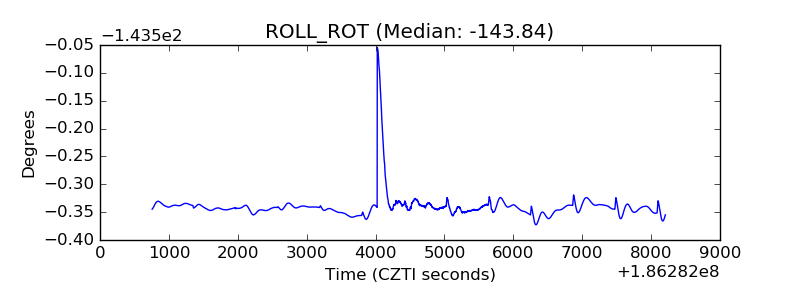 |
| _Roll_DEC | 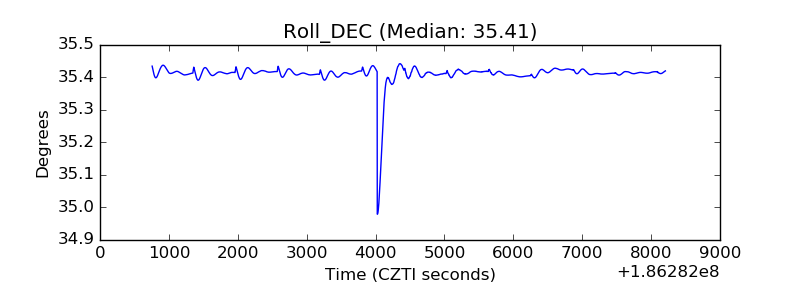 |
| _Roll_RA | 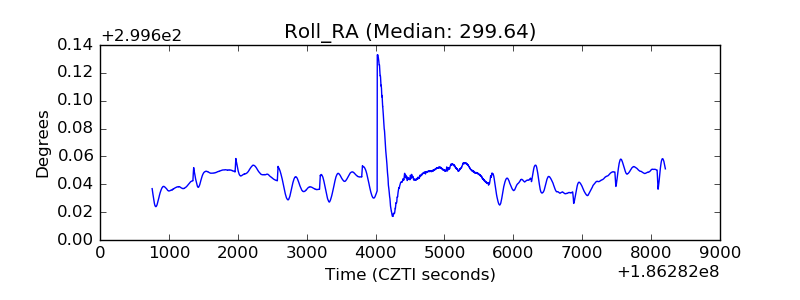 |
| Veto Counter | 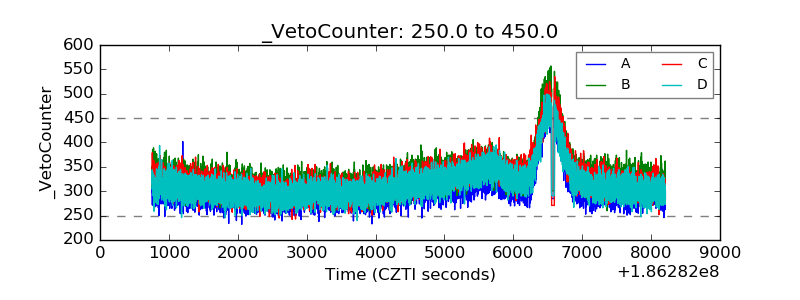 |