| Param | Original file | Final file |
|---|---|---|
| Filename | modeM0/AS1P01_161T03_9000000178_00889cztM0_level2.evt | modeM0/AS1P01_161T03_9000000178_00889cztM0_level2_quad_clean.evt |
| Size (bytes) | 1,268,239,680 | 72,570,240 |
| Size | 1.2 GB | 69.2 MB |
| Events in quadrant A | 9,005,965 | 433,733 |
| Events in quadrant B | 11,908,949 | 401,137 |
| Events in quadrant C | 8,737,932 | 430,655 |
| Events in quadrant D | 8,264,537 | 414,545 |
| Mode M9 | |||
|---|---|---|---|
| Quadrant | BADHDUFLAG | Total packets | Discarded packets |
| A | 0 | 4 | 0 |
| B | 0 | 4 | 0 |
| C | 0 | 4 | 0 |
| D | 0 | 4 | 0 |
| Mode SS | |||
|---|---|---|---|
| Quadrant | BADHDUFLAG | Total packets | Discarded packets |
| A | 0 | 150 | 0 |
| B | 0 | 150 | 0 |
| C | 0 | 150 | 0 |
| D | 0 | 152 | 0 |
| Mode M0 | |||
|---|---|---|---|
| Quadrant | BADHDUFLAG | Total packets | Discarded packets |
| A | 0 | 32047 | 0 |
| B | 0 | 40731 | 0 |
| C | 0 | 31266 | 0 |
| D | 0 | 29825 | 0 |
| Quadrant | Total seconds | Saturated seconds | Saturation percentage |
|---|---|---|---|
| A | 7436 | 54 | 0.726197% |
| B | 7436 | 710 | 9.548144% |
| C | 7436 | 35 | 0.470683% |
| D | 7437 | 41 | 0.551298% |
Noise dominated data is calculated using 1-second bins in cleaned event files. If a bin has >2000 counts, and if more than 50% of those come from <1% of pixels, then it is considered to be noise-dominated and hence unusable.
| Quadrant | # 1 sec bins | Bins with >0 counts | Bins with >2000 counts | High rate bins dominated by noise | Noise dominated (total time) | Noise dominated (detector-on time) | Marked lightcurve |
|---|---|---|---|---|---|---|---|
| A | 7751 | 7438 | 250 | 250 | 3.23% | 3.36% | 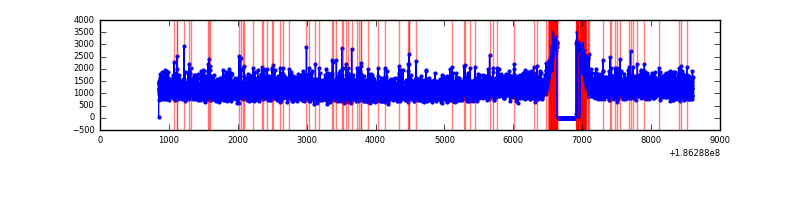 |
| B | 7751 | 7438 | 1481 | 1481 | 19.11% | 19.91% | 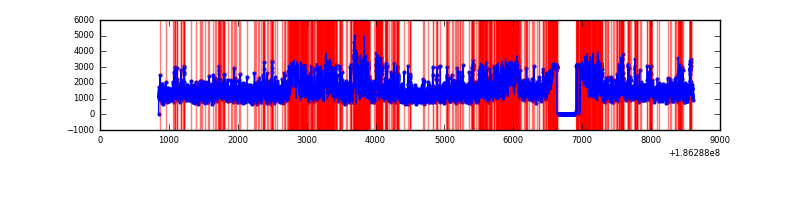 |
| C | 7751 | 7438 | 210 | 210 | 2.71% | 2.82% | 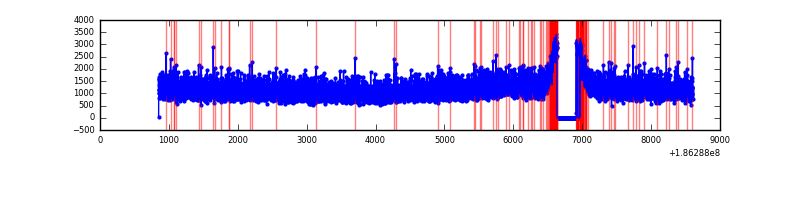 |
| D | 7751 | 7438 | 214 | 214 | 2.76% | 2.88% | 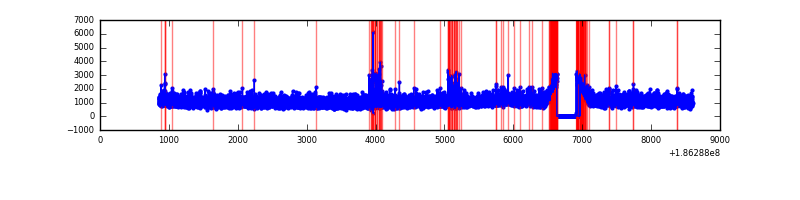 |
Top three noisy pixels from each quadrant. If the there are fewer than three noisy pixels in the level2.evt file, extra rows are filled as -1
| Pixel properties | Quadrant properties | ||||||
|---|---|---|---|---|---|---|---|
| Quadrant | DetID | PixID | Counts | Sigma | Mean | Median | Sigma |
| A | 15 | 127 | 14981 | 22.18 | 2343 | 2360 | 569.1 |
| A | 11 | 79 | 9290 | 12.18 | 2343 | 2360 | 569.1 |
| A | 3 | 111 | 7399 | 8.85 | 2343 | 2360 | 569.1 |
| B | 3 | 0 | 2597616 | 4685.18 | 2354 | 2369 | 553.9 |
| B | 8 | 38 | 188809 | 336.58 | 2354 | 2369 | 553.9 |
| B | 0 | 220 | 90188 | 158.54 | 2354 | 2369 | 553.9 |
| C | 3 | 111 | 32139 | 48.2 | 2210 | 2290 | 619.2 |
| C | 15 | 241 | 25880 | 38.09 | 2210 | 2290 | 619.2 |
| C | 3 | 79 | 17893 | 25.2 | 2210 | 2290 | 619.2 |
| D | 10 | 125 | 62575 | 93.87 | 2163 | 2231 | 642.8 |
| D | 1 | 4 | 58372 | 87.33 | 2163 | 2231 | 642.8 |
| D | 13 | 169 | 34082 | 49.55 | 2163 | 2231 | 642.8 |
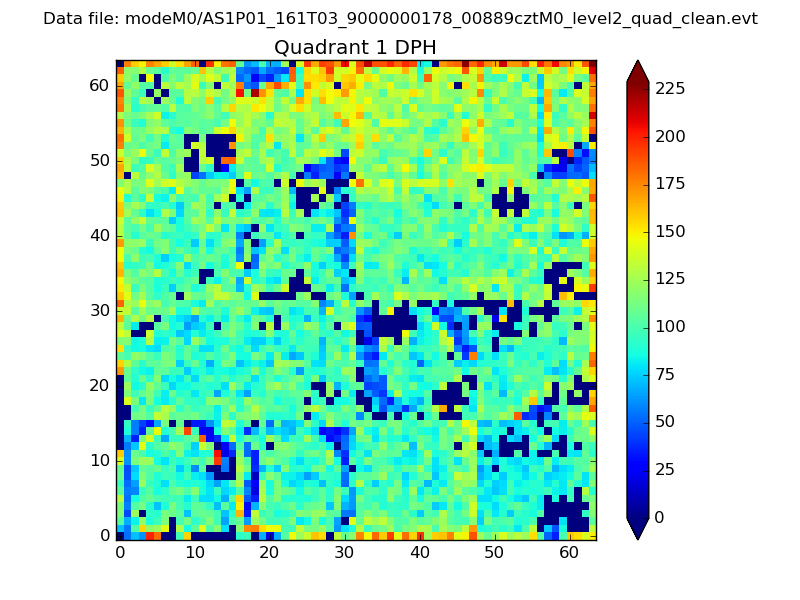
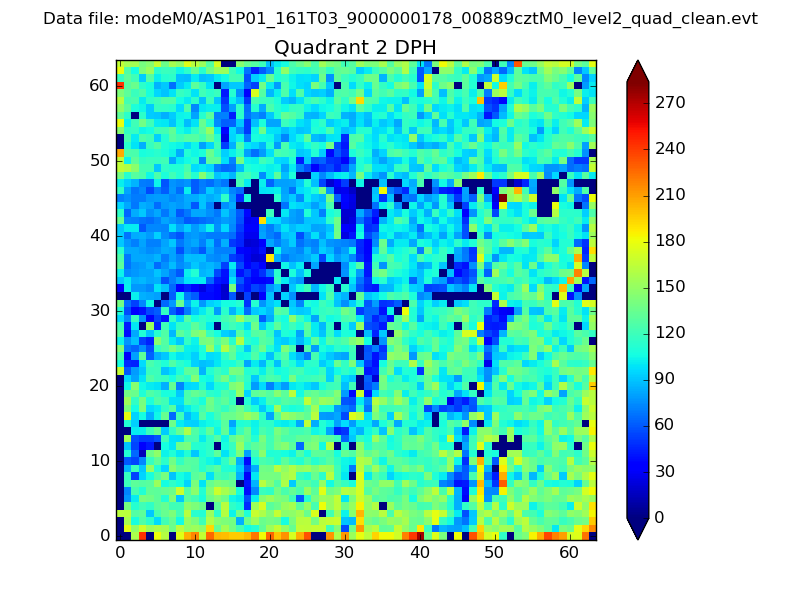
Histogram calculated using DETX and DETY for each event in the final _common_clean file
| Quadrant A |  |
 |
Quadrant B |
|---|---|---|---|
| Quadrant D |  |
 |
Quadrant C |
| Plot type | Count rate plots | Images |
|---|---|---|
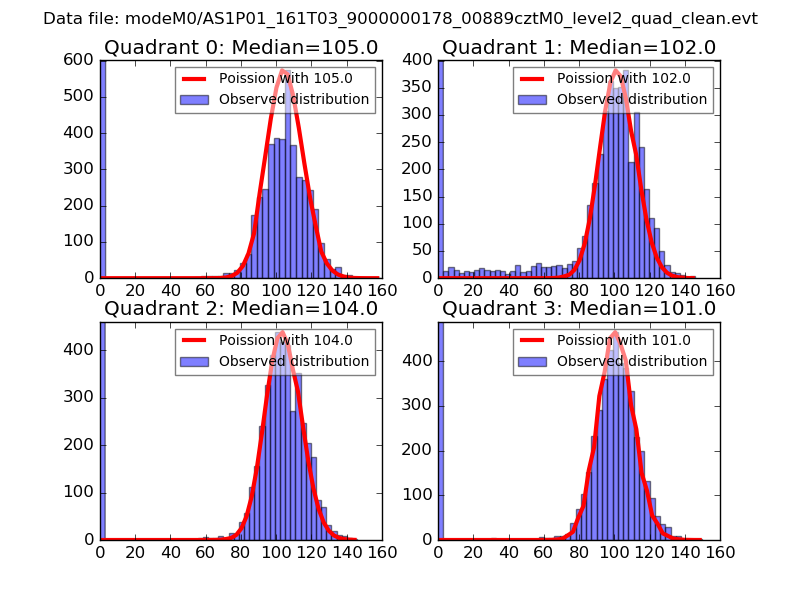
| Comparison with Poisson distribution Blue bars denote a histogram of data divided into 1 sec bins. Red curve is a Poisson curve with rate = median count rate of data. |
 |
 |
| Quadrant-wise count rates Data is divided into 100 sec bins |
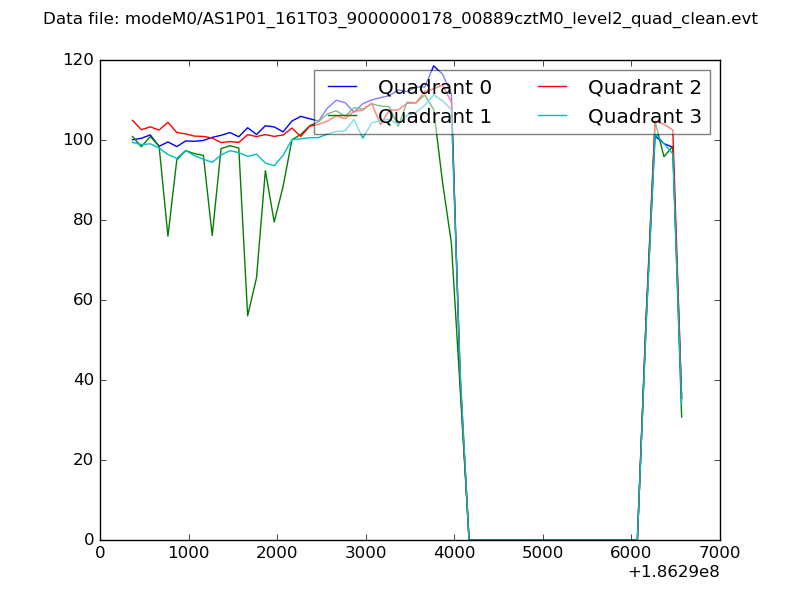 |
|
| Module-wise count rates for Quadrant A Data is divided into 100 sec bins |
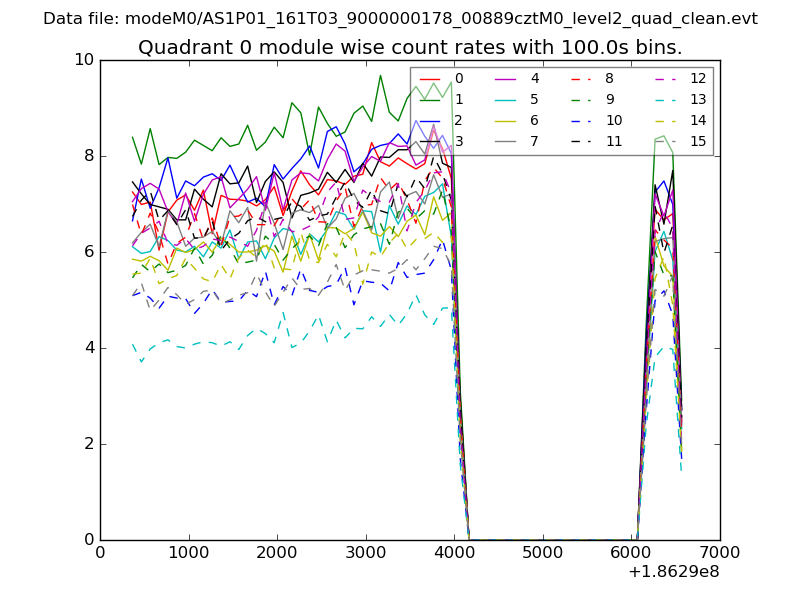 |
 |
| Module-wise count rates for Quadrant B Data is divided into 100 sec bins |
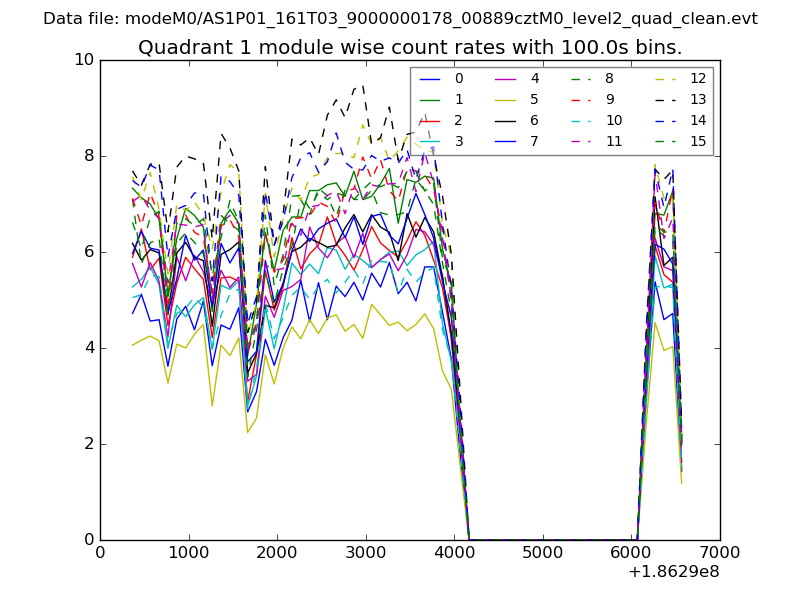 |
 |
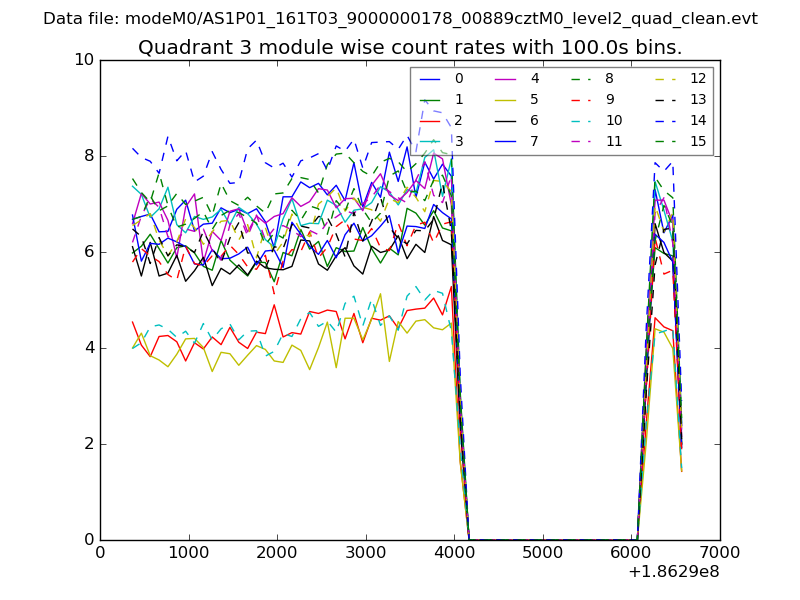
| Module-wise count rates for Quadrant C Data is divided into 100 sec bins |
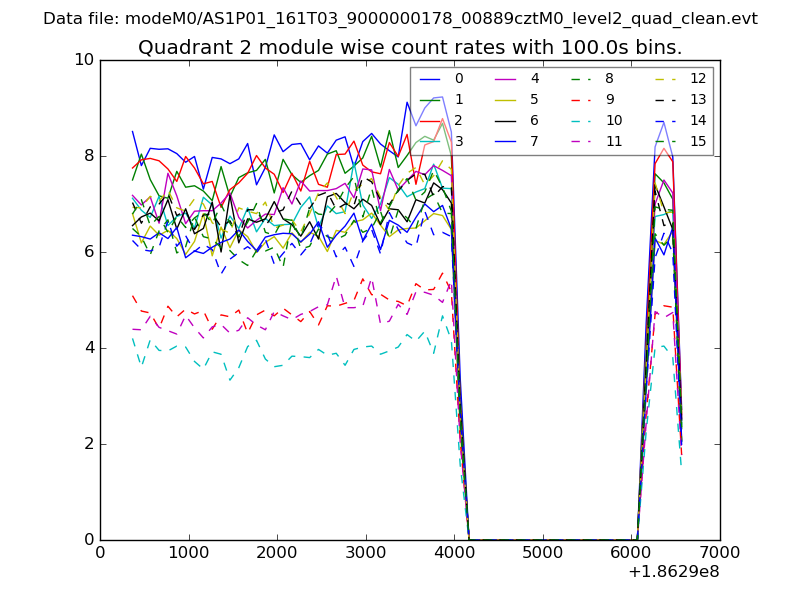 |
 |
| Module-wise count rates for Quadrant D Data is divided into 100 sec bins |
 |
 |
| Parameter | Plot |
|---|---|
| CZT HV Monitor | 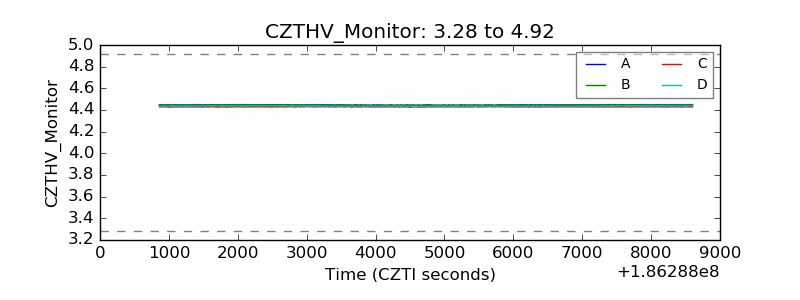 |
| D_VDD | 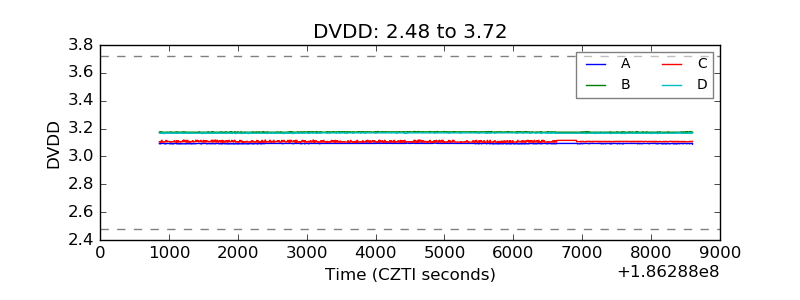 |
| Temperature 1 | 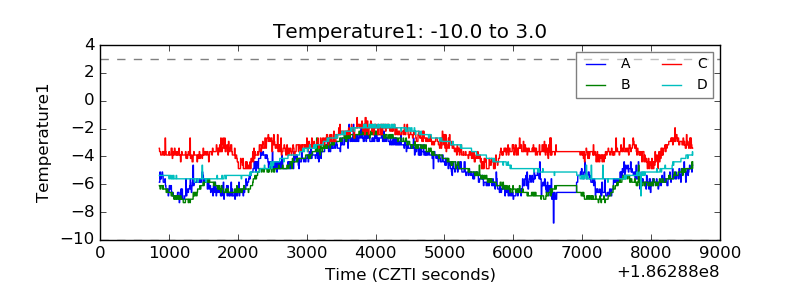 |
| Veto HV Monitor | 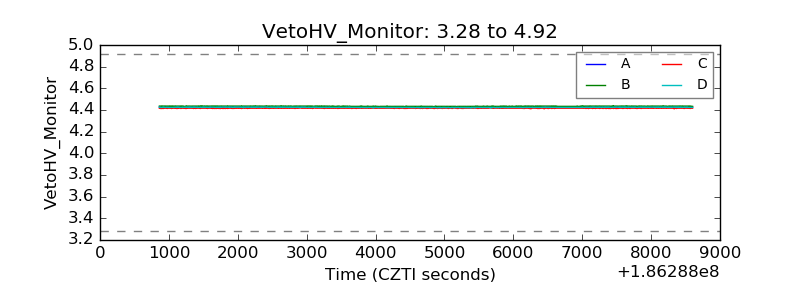 |
| Veto LLD | 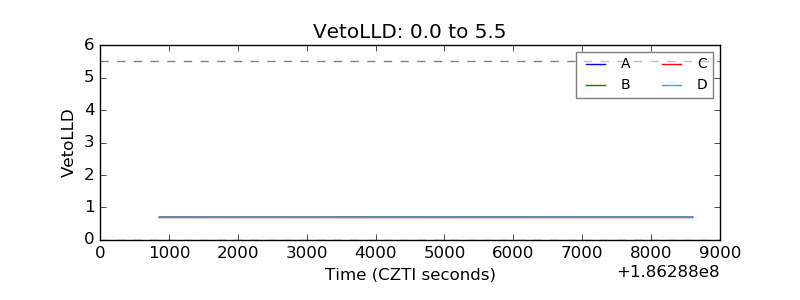 |
| Alpha Counter | 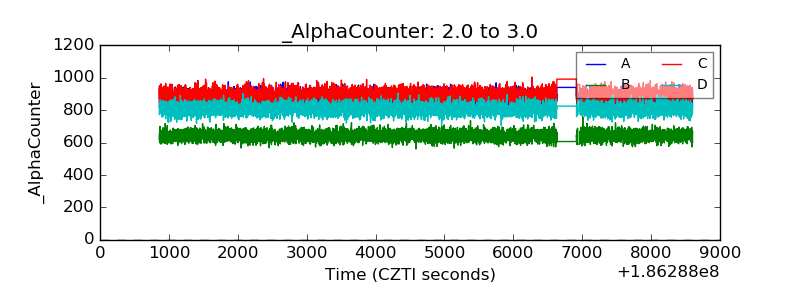 |
| _CPM_Rate | 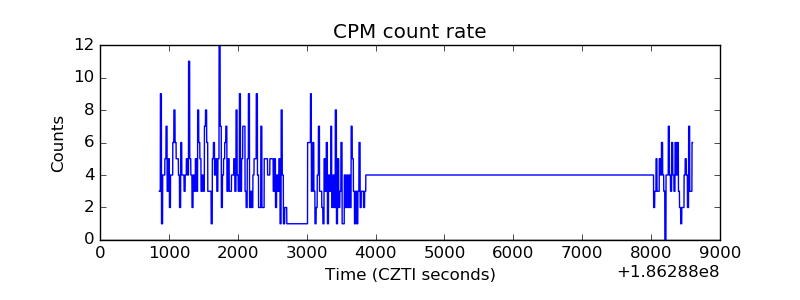 |
| CZT Counter | 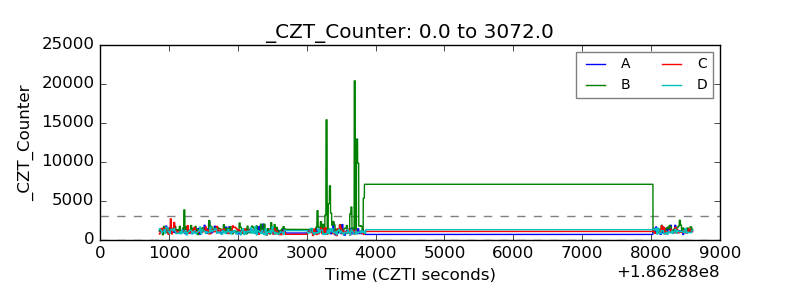 |
| +2.5 Volts monitor |  |
| +5 Volts monitor |  |
| _ROLL_ROT | 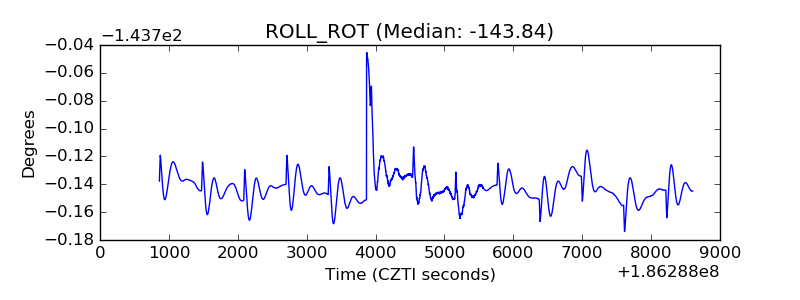 |
| _Roll_DEC | 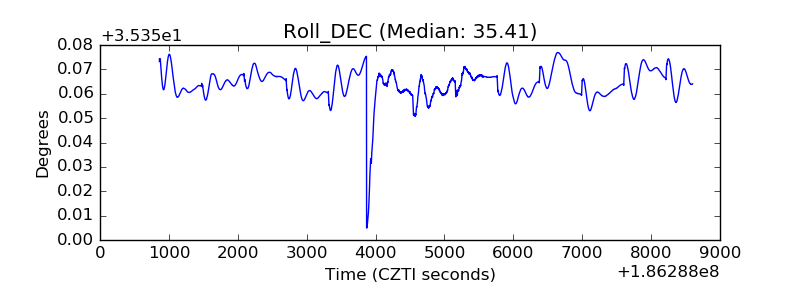 |
| _Roll_RA | 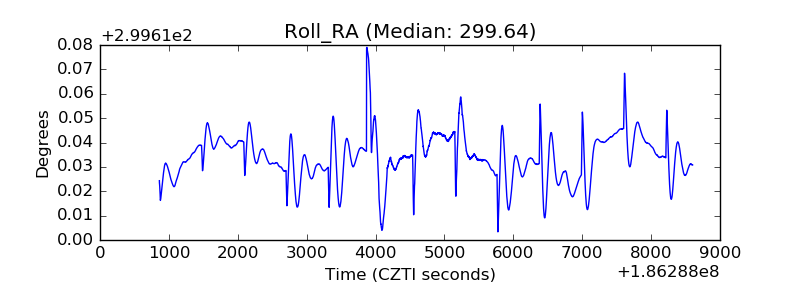 |
| Veto Counter | 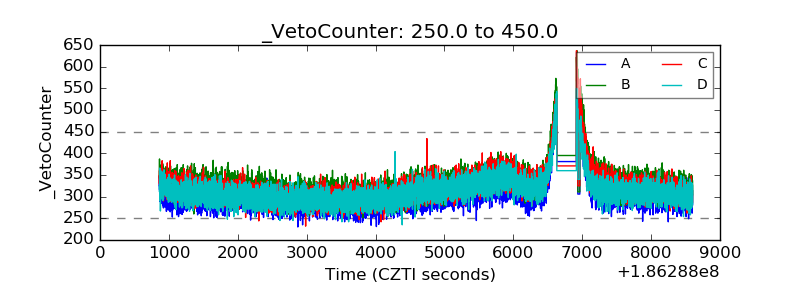 |