| Param | Original file | Final file |
|---|---|---|
| Filename | modeM0/AS1P01_161T03_9000000178_00890cztM0_level2.evt | modeM0/AS1P01_161T03_9000000178_00890cztM0_level2_quad_clean.evt |
| Size (bytes) | 1,132,721,280 | 76,190,400 |
| Size | 1.1 GB | 72.7 MB |
| Events in quadrant A | 7,974,614 | 470,741 |
| Events in quadrant B | 10,968,019 | 457,026 |
| Events in quadrant C | 7,674,171 | 466,591 |
| Events in quadrant D | 7,248,914 | 450,517 |
| Mode M9 | |||
|---|---|---|---|
| Quadrant | BADHDUFLAG | Total packets | Discarded packets |
| A | 0 | 6 | 0 |
| B | 0 | 6 | 0 |
| C | 0 | 6 | 0 |
| D | 0 | 6 | 0 |
| Mode SS | |||
|---|---|---|---|
| Quadrant | BADHDUFLAG | Total packets | Discarded packets |
| A | 0 | 134 | 0 |
| B | 0 | 134 | 0 |
| C | 0 | 134 | 0 |
| D | 0 | 134 | 0 |
| Mode M0 | |||
|---|---|---|---|
| Quadrant | BADHDUFLAG | Total packets | Discarded packets |
| A | 0 | 28376 | 0 |
| B | 0 | 37372 | 0 |
| C | 0 | 27513 | 0 |
| D | 0 | 26284 | 0 |
| Quadrant | Total seconds | Saturated seconds | Saturation percentage |
|---|---|---|---|
| A | 6629 | 18 | 0.271534% |
| B | 6629 | 821 | 12.384975% |
| C | 6627 | 11 | 0.165988% |
| D | 6633 | 15 | 0.226142% |
Noise dominated data is calculated using 1-second bins in cleaned event files. If a bin has >2000 counts, and if more than 50% of those come from <1% of pixels, then it is considered to be noise-dominated and hence unusable.
| Quadrant | # 1 sec bins | Bins with >0 counts | Bins with >2000 counts | High rate bins dominated by noise | Noise dominated (total time) | Noise dominated (detector-on time) | Marked lightcurve |
|---|---|---|---|---|---|---|---|
| A | 7210 | 6632 | 156 | 156 | 2.16% | 2.35% | 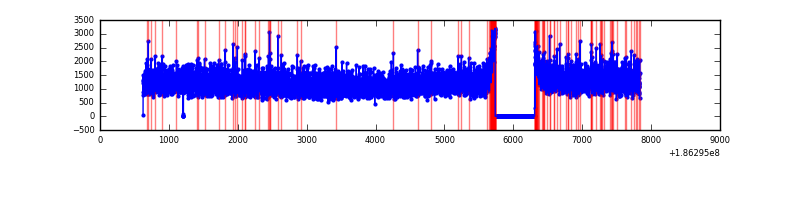 |
| B | 7210 | 6634 | 1442 | 1442 | 20.00% | 21.74% | 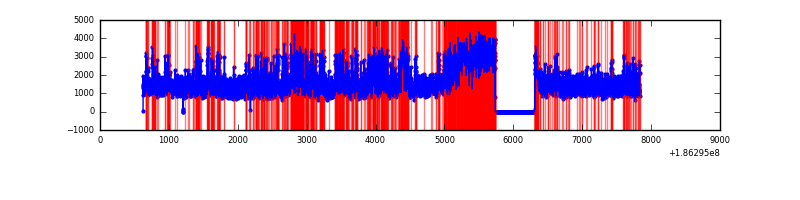 |
| C | 7210 | 6635 | 131 | 131 | 1.82% | 1.97% | 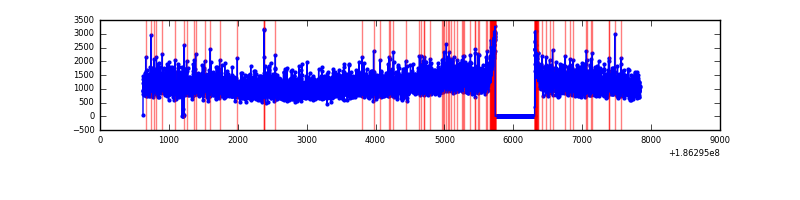 |
| D | 7210 | 6636 | 108 | 108 | 1.50% | 1.63% | 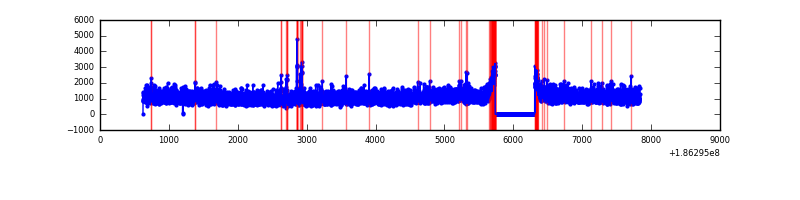 |
Top three noisy pixels from each quadrant. If the there are fewer than three noisy pixels in the level2.evt file, extra rows are filled as -1
| Pixel properties | Quadrant properties | ||||||
|---|---|---|---|---|---|---|---|
| Quadrant | DetID | PixID | Counts | Sigma | Mean | Median | Sigma |
| A | 15 | 127 | 18512 | 32.73 | 2075 | 2093 | 501.7 |
| A | 11 | 79 | 6493 | 8.77 | 2075 | 2093 | 501.7 |
| A | 3 | 111 | 6476 | 8.74 | 2075 | 2093 | 501.7 |
| B | 3 | 0 | 3017101 | 6417.35 | 1964 | 1975 | 469.8 |
| B | 8 | 38 | 355070 | 751.52 | 1964 | 1975 | 469.8 |
| B | 5 | 249 | 50188 | 102.62 | 1964 | 1975 | 469.8 |
| C | 15 | 241 | 26155 | 44.85 | 1934 | 2005 | 538.5 |
| C | 9 | 83 | 26049 | 44.65 | 1934 | 2005 | 538.5 |
| C | 3 | 111 | 25854 | 44.29 | 1934 | 2005 | 538.5 |
| D | 1 | 4 | 52977 | 87.31 | 1903 | 1961 | 584.3 |
| D | 10 | 85 | 34299 | 55.34 | 1903 | 1961 | 584.3 |
| D | 13 | 169 | 17460 | 26.53 | 1903 | 1961 | 584.3 |
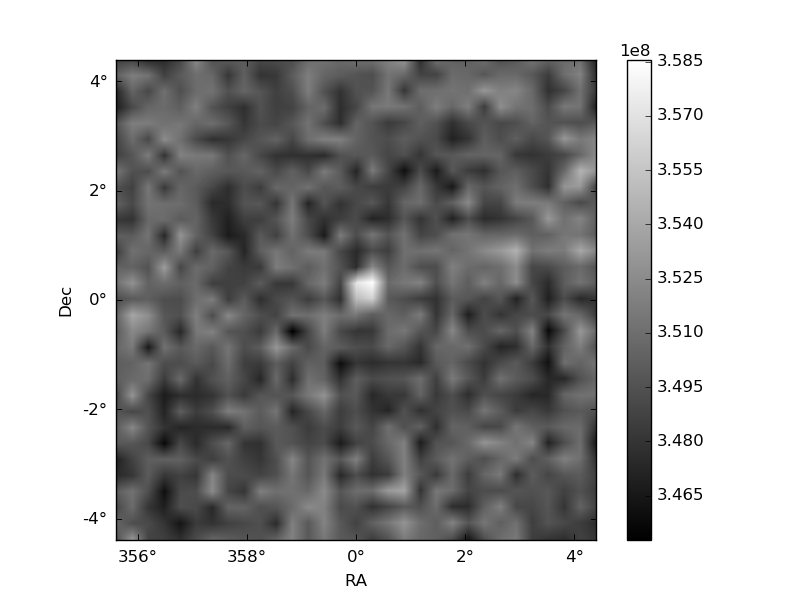
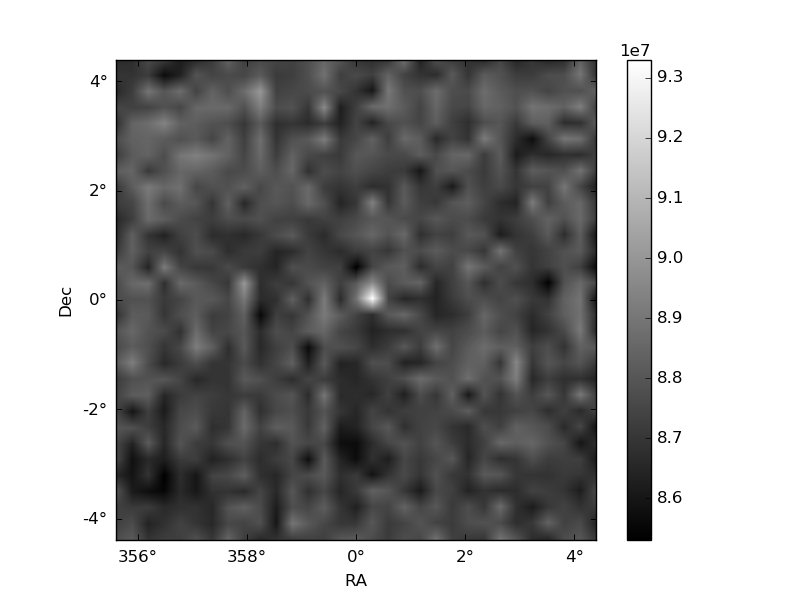
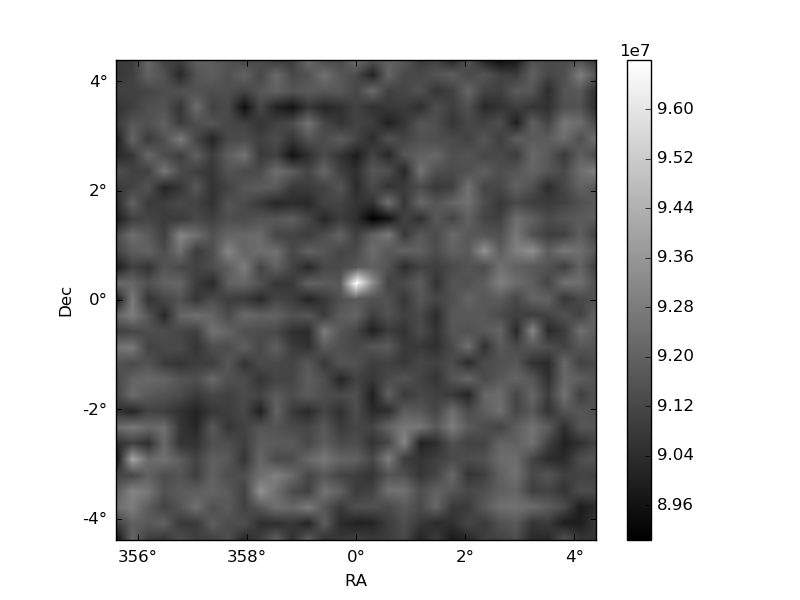
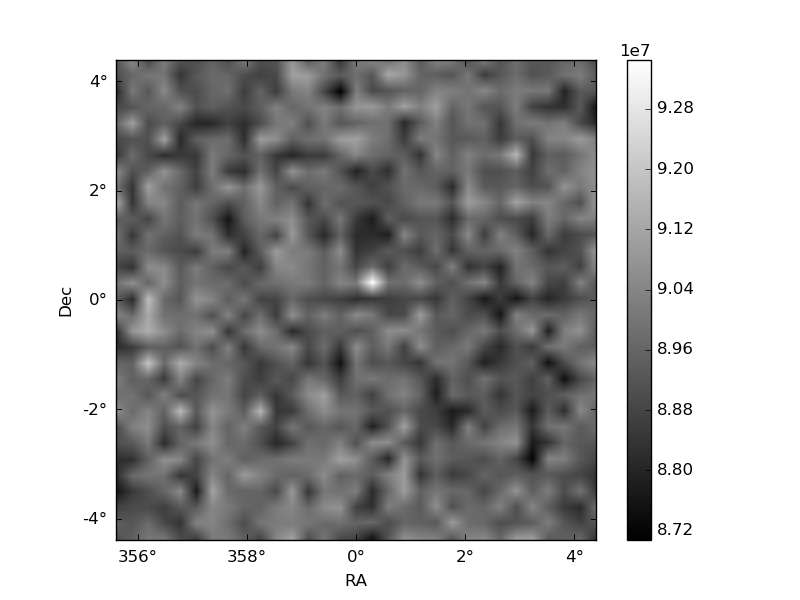
Histogram calculated using DETX and DETY for each event in the final _common_clean file
| Quadrant A | 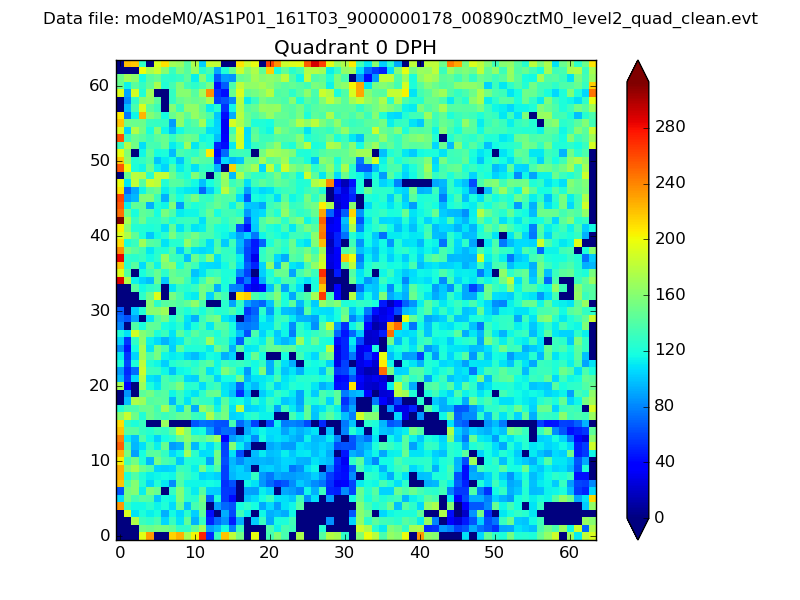 |
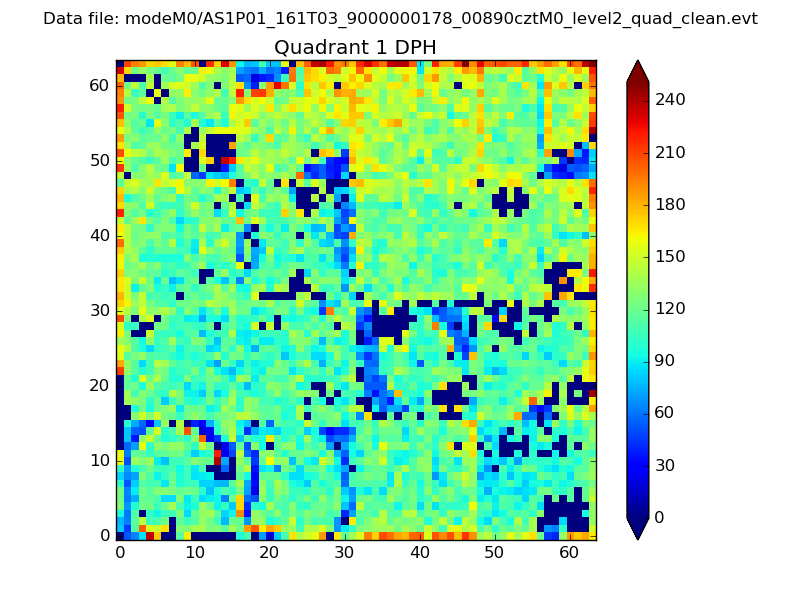 |
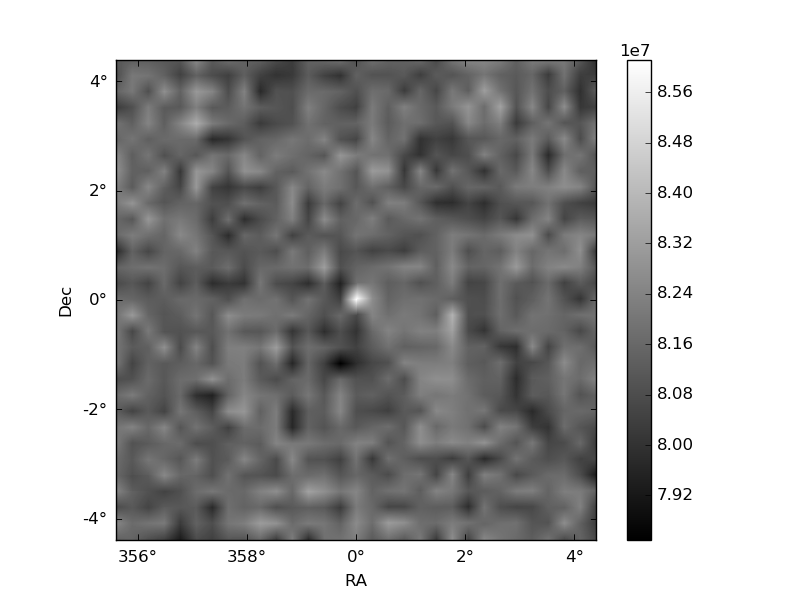
Quadrant B |
|---|---|---|---|
| Quadrant D | 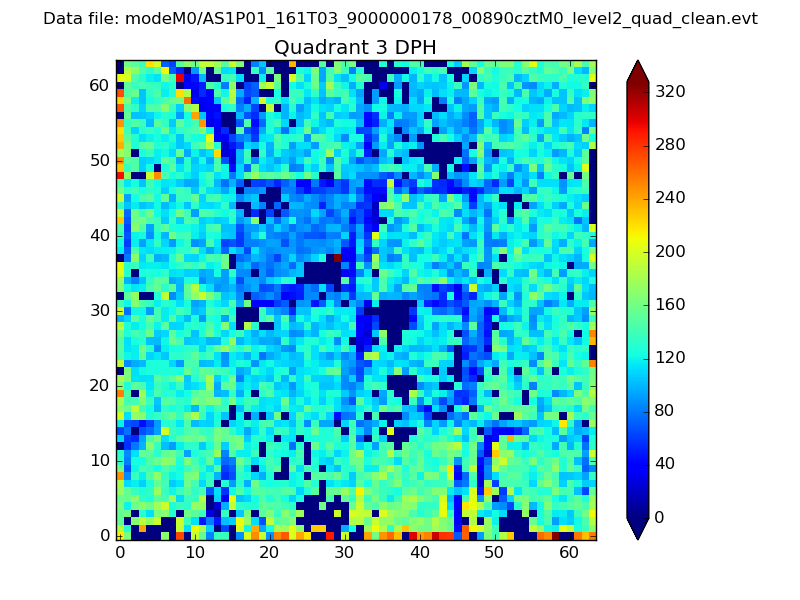 |
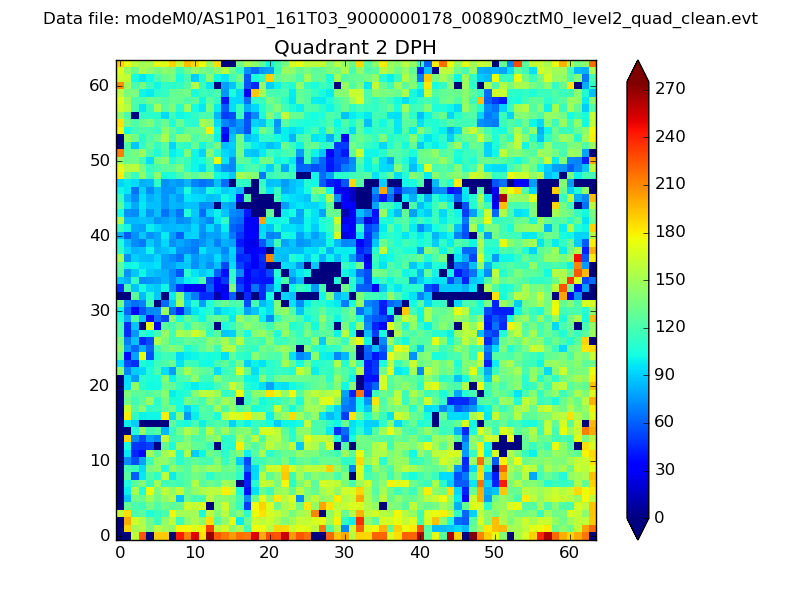 |
Quadrant C |
| Plot type | Count rate plots | Images |
|---|---|---|
| Comparison with Poisson distribution Blue bars denote a histogram of data divided into 1 sec bins. Red curve is a Poisson curve with rate = median count rate of data. |
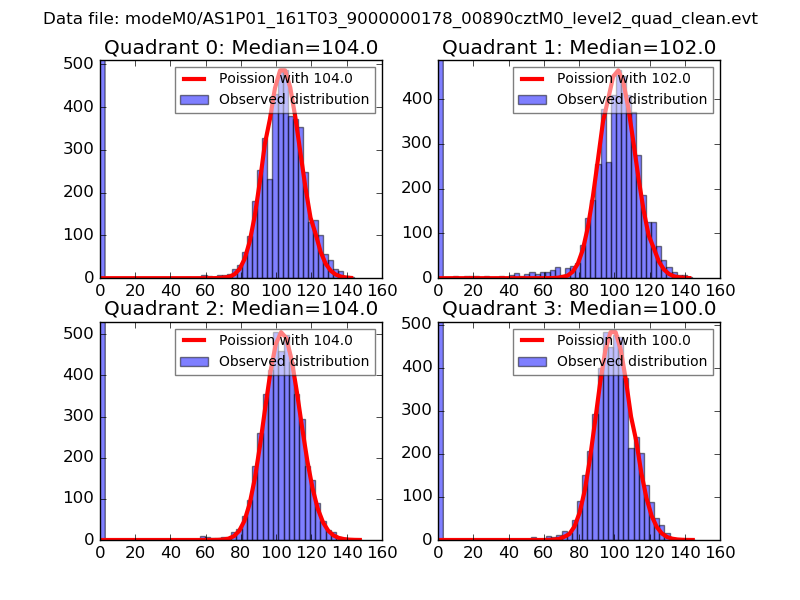 |
 |
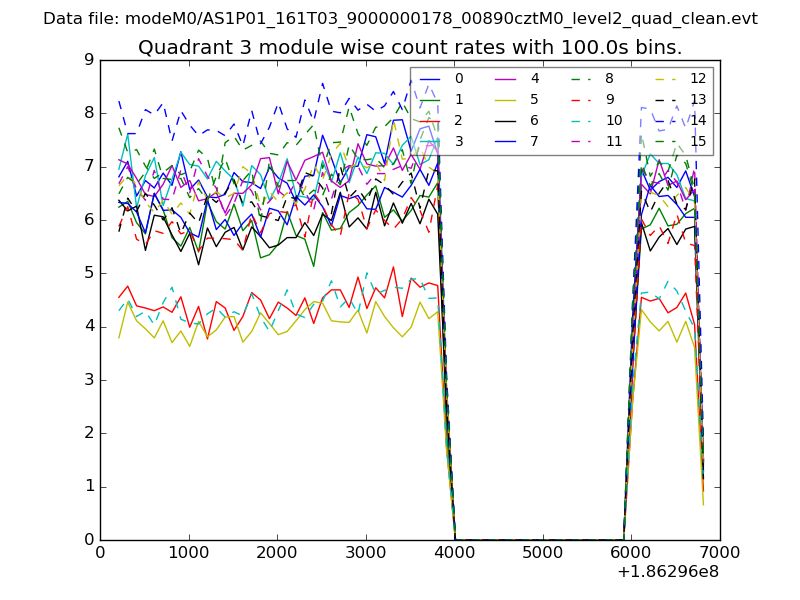
| Quadrant-wise count rates Data is divided into 100 sec bins |
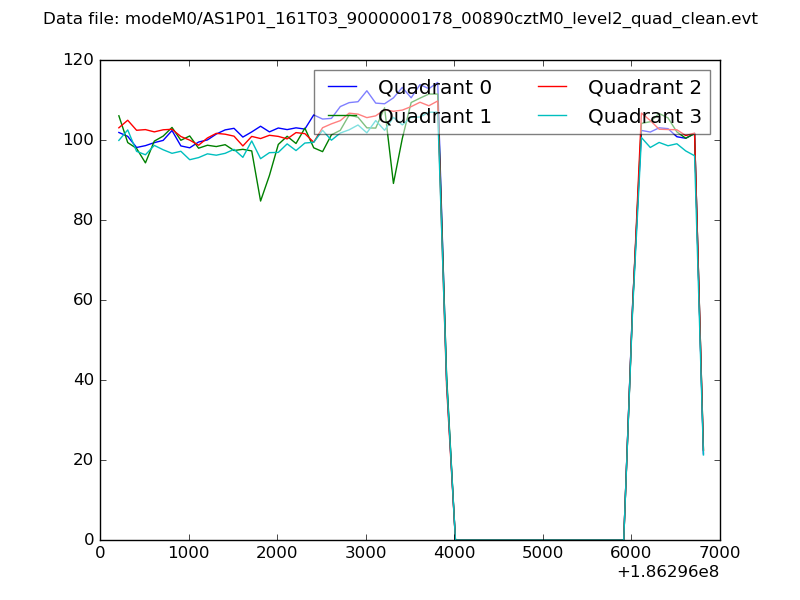 |
|
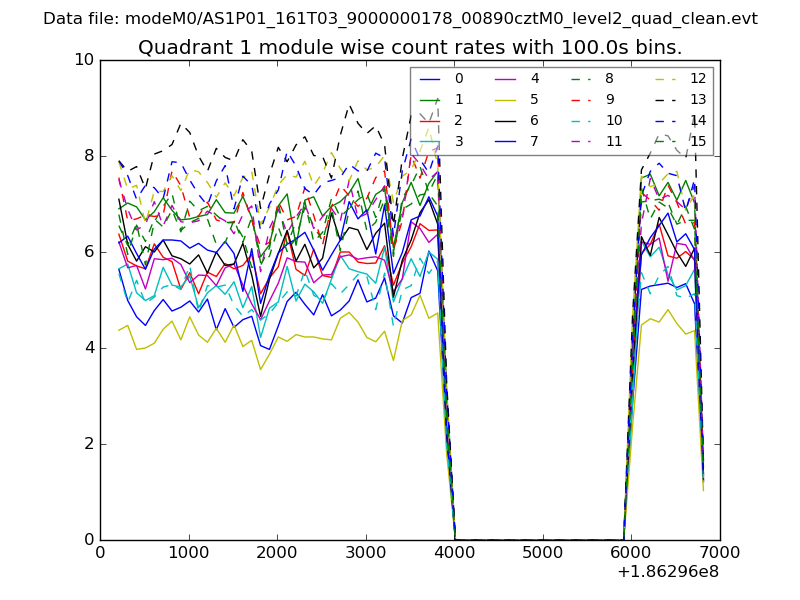
| Module-wise count rates for Quadrant A Data is divided into 100 sec bins |
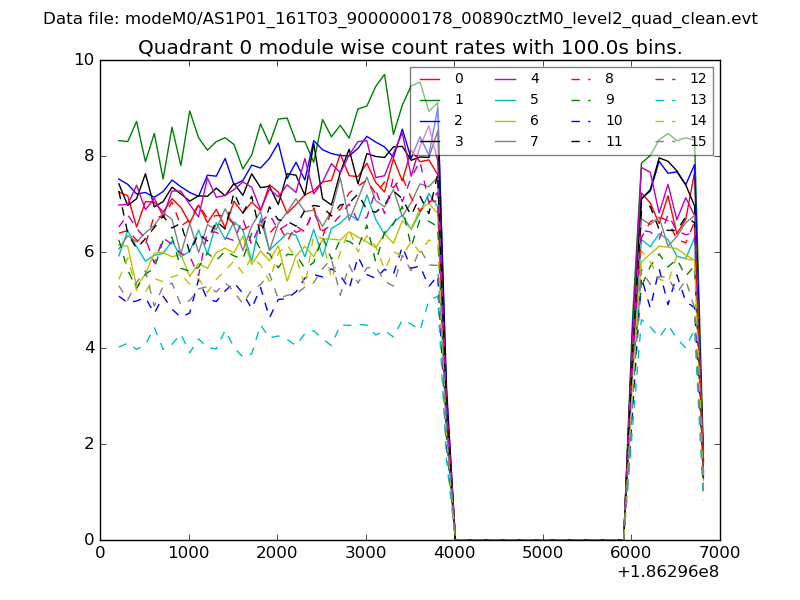 |
 |
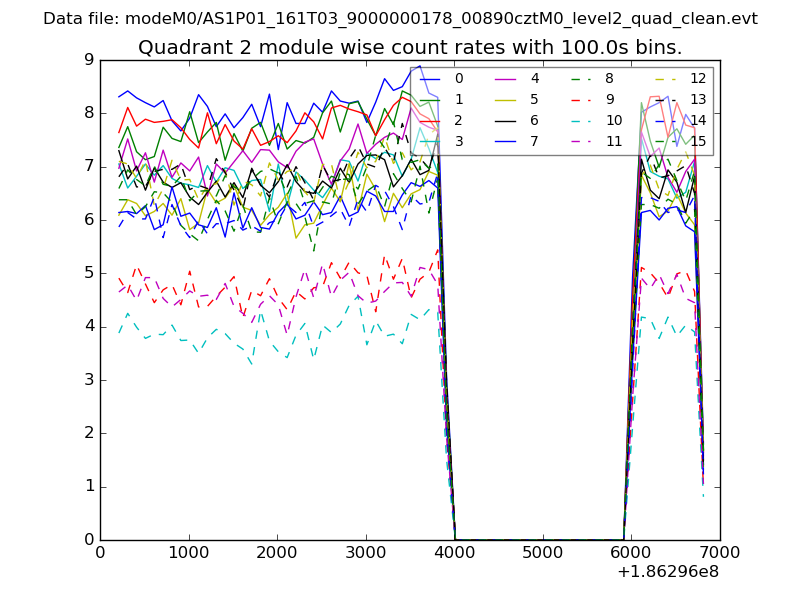
| Module-wise count rates for Quadrant B Data is divided into 100 sec bins |
 |
 |
| Module-wise count rates for Quadrant C Data is divided into 100 sec bins |
 |
 |
| Module-wise count rates for Quadrant D Data is divided into 100 sec bins |
 |
 |
| Parameter | Plot |
|---|---|
| CZT HV Monitor | 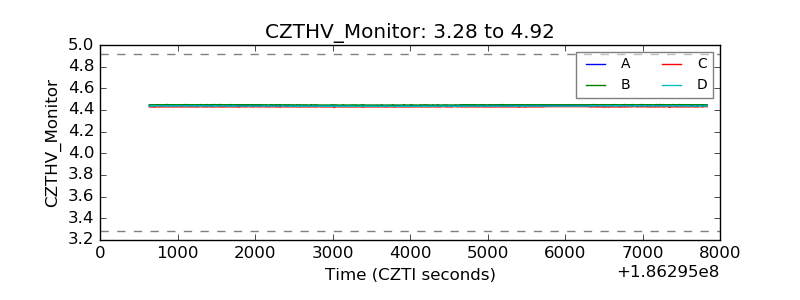 |
| D_VDD | 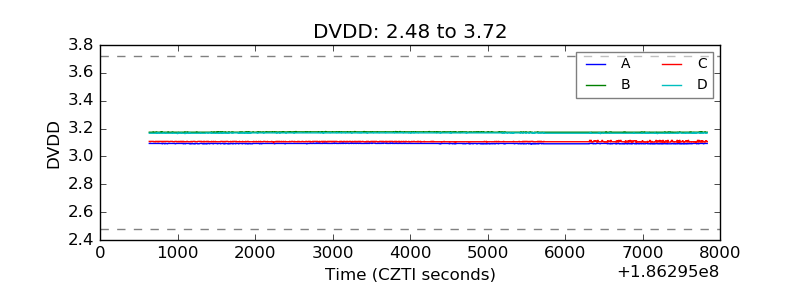 |
| Temperature 1 | 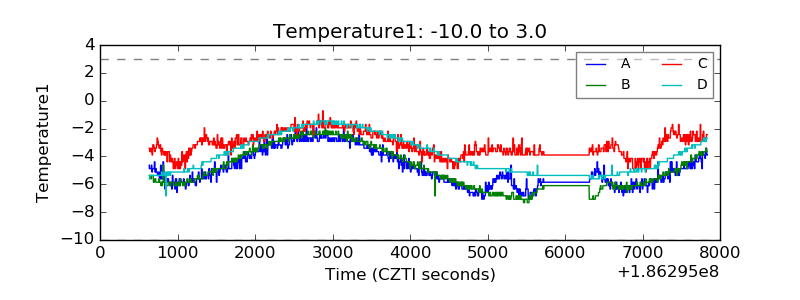 |
| Veto HV Monitor | 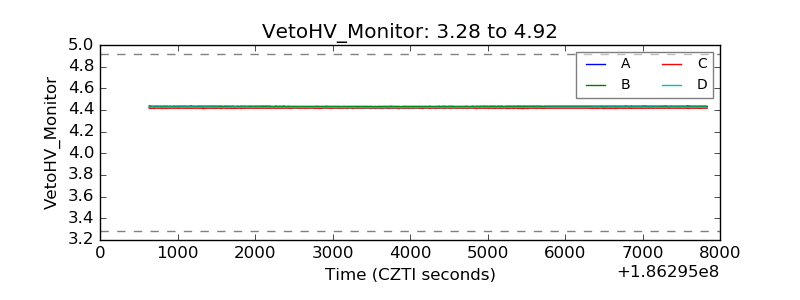 |
| Veto LLD | 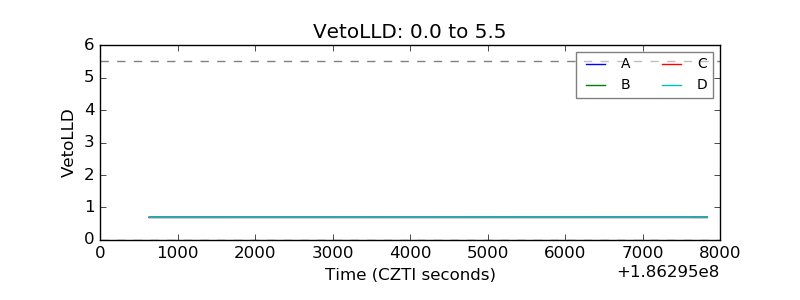 |
| Alpha Counter | 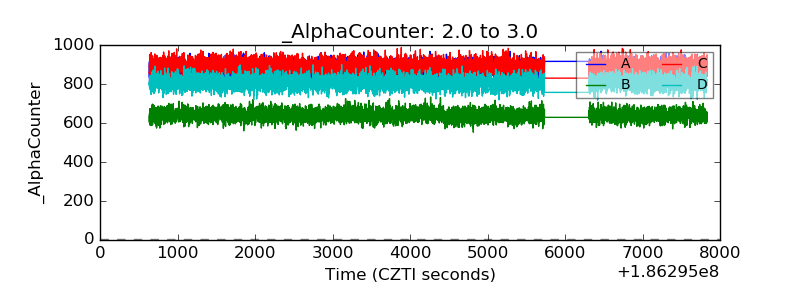 |
| _CPM_Rate | 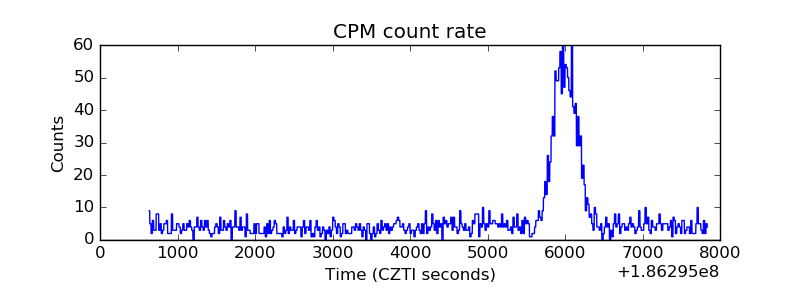 |
| CZT Counter | 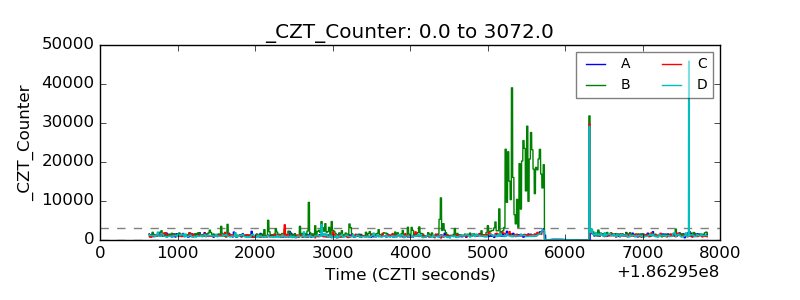 |
| +2.5 Volts monitor |  |
| +5 Volts monitor |  |
| _ROLL_ROT | 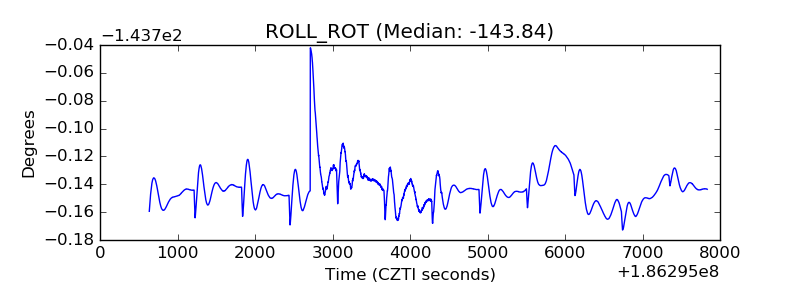 |
| _Roll_DEC | 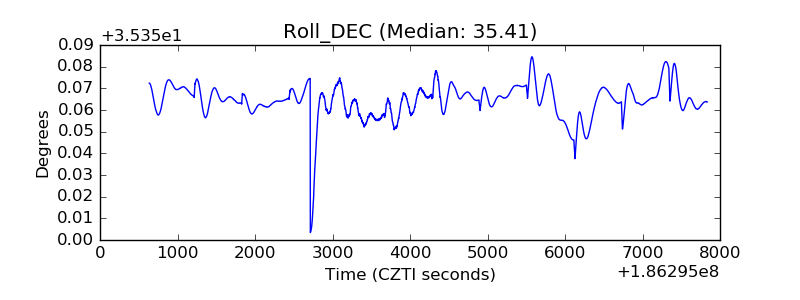 |
| _Roll_RA | 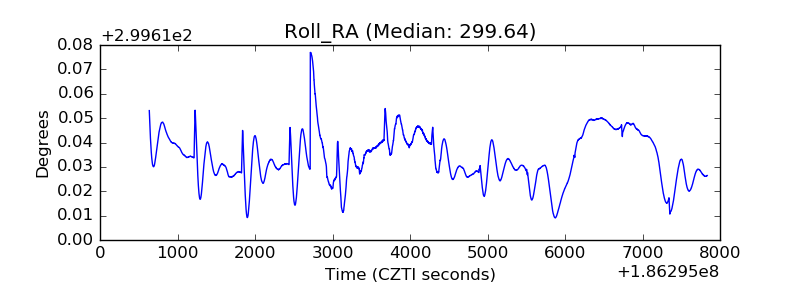 |
| Veto Counter | 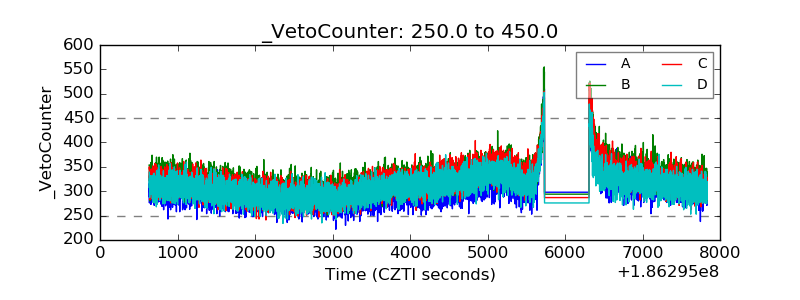 |