| Param | Original file | Final file |
|---|---|---|
| Filename | modeM0/AS1P01_161T03_9000000178_00891cztM0_level2.evt | modeM0/AS1P01_161T03_9000000178_00891cztM0_level2_quad_clean.evt |
| Size (bytes) | 1,078,133,760 | 76,596,480 |
| Size | 1.0 GB | 73.0 MB |
| Events in quadrant A | 7,326,734 | 493,367 |
| Events in quadrant B | 10,733,229 | 443,922 |
| Events in quadrant C | 7,311,412 | 485,575 |
| Events in quadrant D | 6,876,980 | 470,986 |
| Mode M9 | |||
|---|---|---|---|
| Quadrant | BADHDUFLAG | Total packets | Discarded packets |
| A | 0 | 7 | 0 |
| B | 0 | 7 | 0 |
| C | 0 | 7 | 0 |
| D | 0 | 7 | 0 |
| Mode SS | |||
|---|---|---|---|
| Quadrant | BADHDUFLAG | Total packets | Discarded packets |
| A | 0 | 124 | 0 |
| B | 0 | 124 | 0 |
| C | 0 | 124 | 0 |
| D | 0 | 124 | 0 |
| Mode M0 | |||
|---|---|---|---|
| Quadrant | BADHDUFLAG | Total packets | Discarded packets |
| A | 0 | 26061 | 0 |
| B | 0 | 36306 | 0 |
| C | 0 | 26037 | 0 |
| D | 0 | 24746 | 0 |
| Quadrant | Total seconds | Saturated seconds | Saturation percentage |
|---|---|---|---|
| A | 6088 | 38 | 0.624179% |
| B | 6089 | 952 | 15.634751% |
| C | 6089 | 23 | 0.377730% |
| D | 6089 | 37 | 0.607653% |
Noise dominated data is calculated using 1-second bins in cleaned event files. If a bin has >2000 counts, and if more than 50% of those come from <1% of pixels, then it is considered to be noise-dominated and hence unusable.
| Quadrant | # 1 sec bins | Bins with >0 counts | Bins with >2000 counts | High rate bins dominated by noise | Noise dominated (total time) | Noise dominated (detector-on time) | Marked lightcurve |
|---|---|---|---|---|---|---|---|
| A | 6808 | 6089 | 205 | 205 | 3.01% | 3.37% | 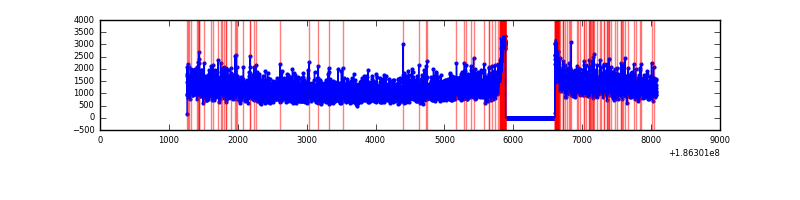 |
| B | 6809 | 6090 | 1749 | 1749 | 25.69% | 28.72% | 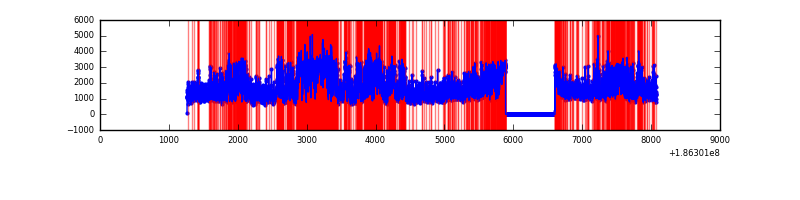 |
| C | 6809 | 6090 | 237 | 237 | 3.48% | 3.89% | 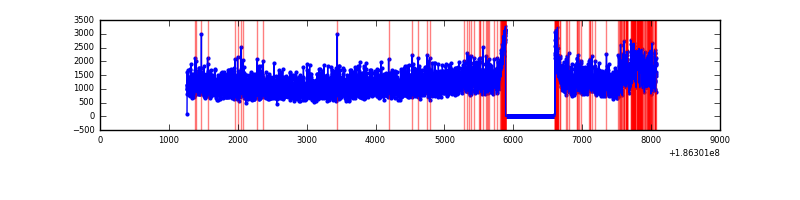 |
| D | 6809 | 6090 | 148 | 148 | 2.17% | 2.43% | 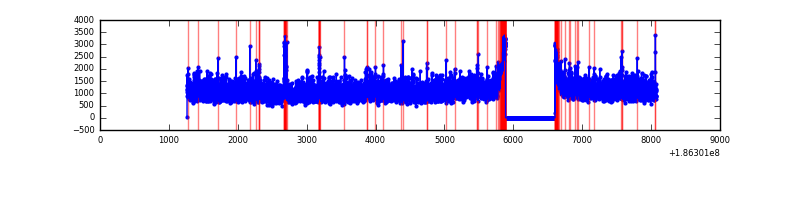 |
Top three noisy pixels from each quadrant. If the there are fewer than three noisy pixels in the level2.evt file, extra rows are filled as -1
| Pixel properties | Quadrant properties | ||||||
|---|---|---|---|---|---|---|---|
| Quadrant | DetID | PixID | Counts | Sigma | Mean | Median | Sigma |
| A | 11 | 79 | 7645 | 12.46 | 1908 | 1926 | 459.0 |
| A | 14 | 170 | 7275 | 11.65 | 1908 | 1926 | 459.0 |
| A | 3 | 111 | 5933 | 8.73 | 1908 | 1926 | 459.0 |
| B | 3 | 0 | 3076260 | 6938.65 | 1865 | 1880 | 443.1 |
| B | 8 | 38 | 455392 | 1023.54 | 1865 | 1880 | 443.1 |
| B | 5 | 249 | 31009 | 65.74 | 1865 | 1880 | 443.1 |
| C | 9 | 83 | 305146 | 612.42 | 1772 | 1833 | 495.3 |
| C | 15 | 241 | 29696 | 56.26 | 1772 | 1833 | 495.3 |
| C | 3 | 111 | 27655 | 52.14 | 1772 | 1833 | 495.3 |
| D | 1 | 4 | 220327 | 408.32 | 1763 | 1820 | 535.1 |
| D | 13 | 169 | 50487 | 90.94 | 1763 | 1820 | 535.1 |
| D | 10 | 157 | 13589 | 21.99 | 1763 | 1820 | 535.1 |
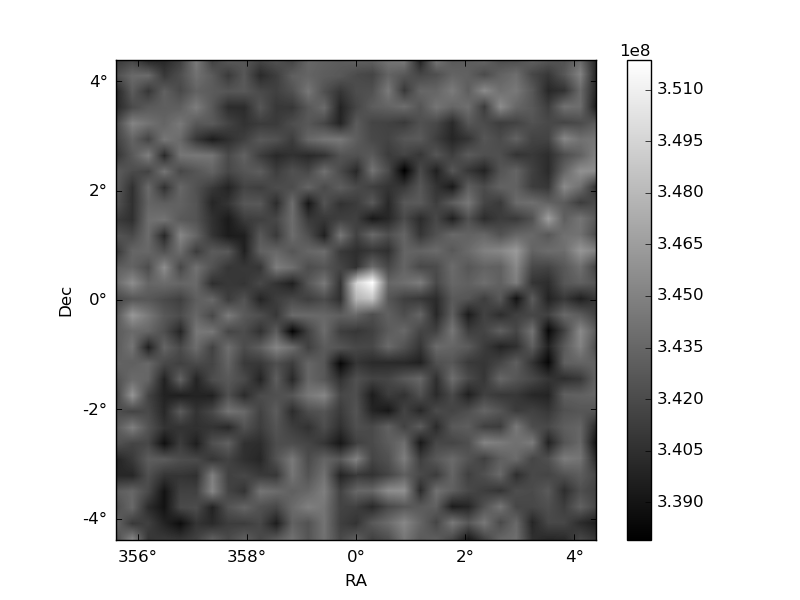
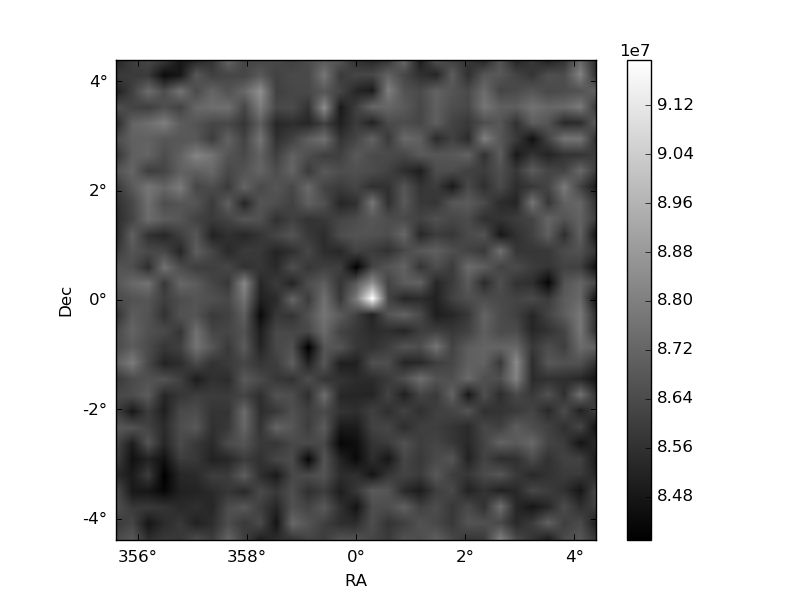
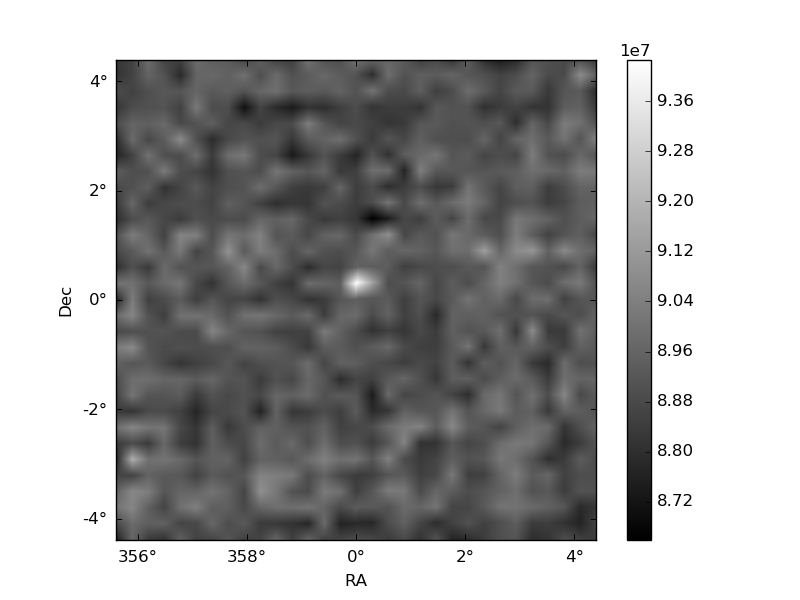
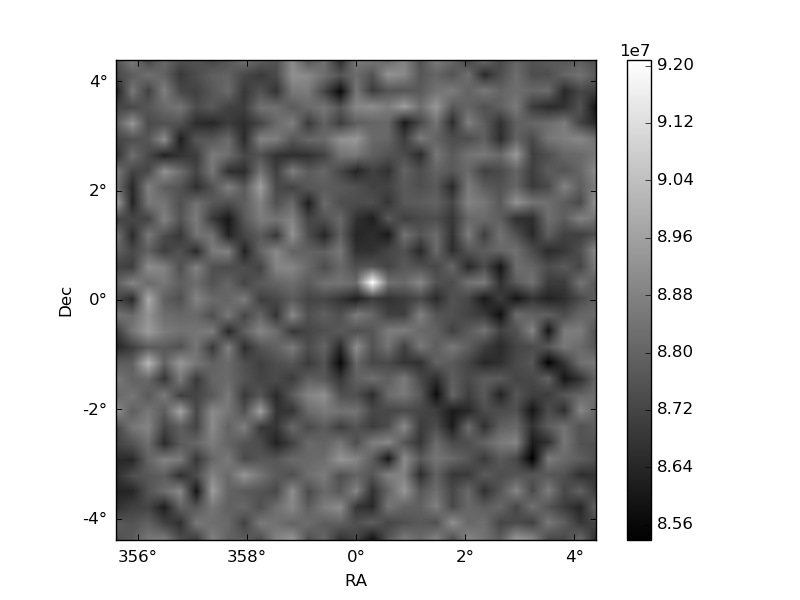
Histogram calculated using DETX and DETY for each event in the final _common_clean file
| Quadrant A | 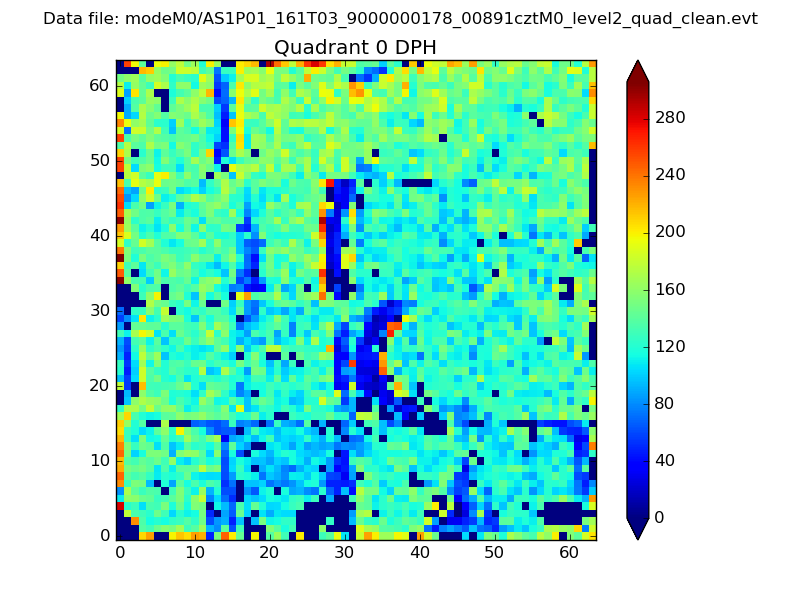 |
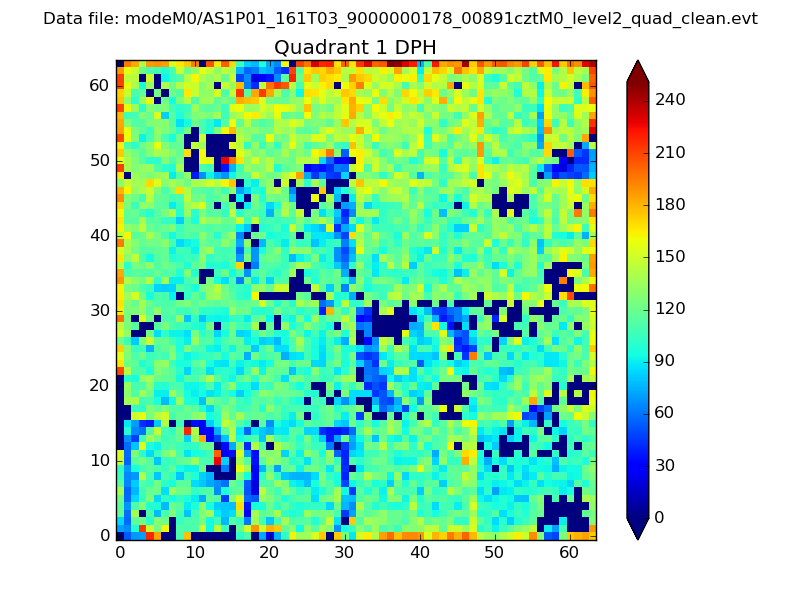 |
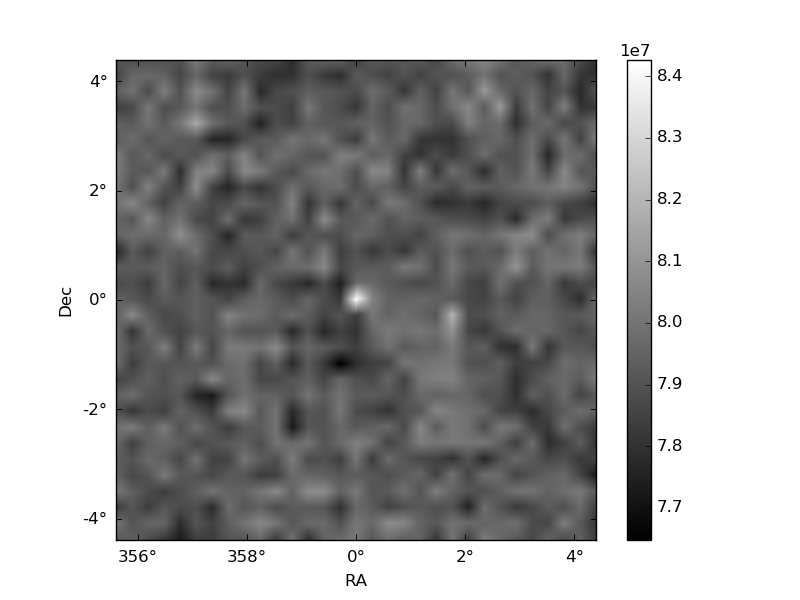
Quadrant B |
|---|---|---|---|
| Quadrant D | 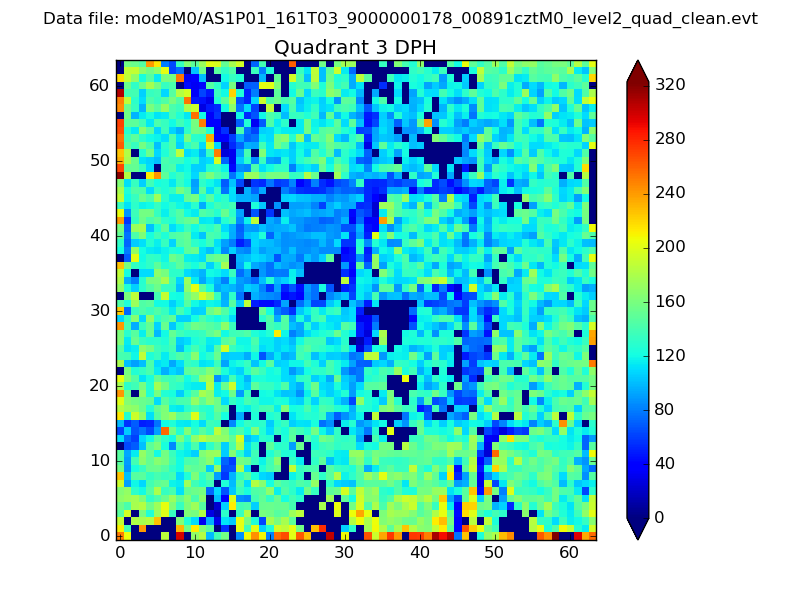 |
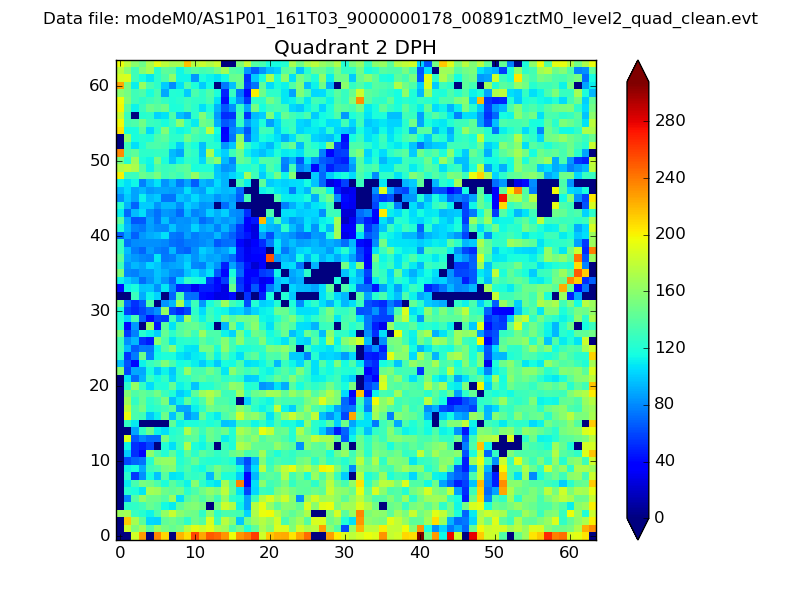 |
Quadrant C |
| Plot type | Count rate plots | Images |
|---|---|---|
| Comparison with Poisson distribution Blue bars denote a histogram of data divided into 1 sec bins. Red curve is a Poisson curve with rate = median count rate of data. |
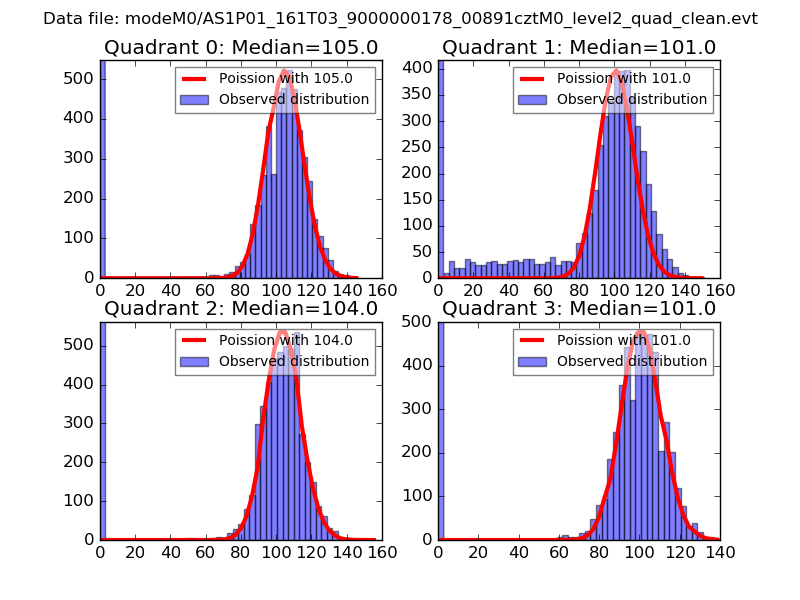 |
 |
| Quadrant-wise count rates Data is divided into 100 sec bins |
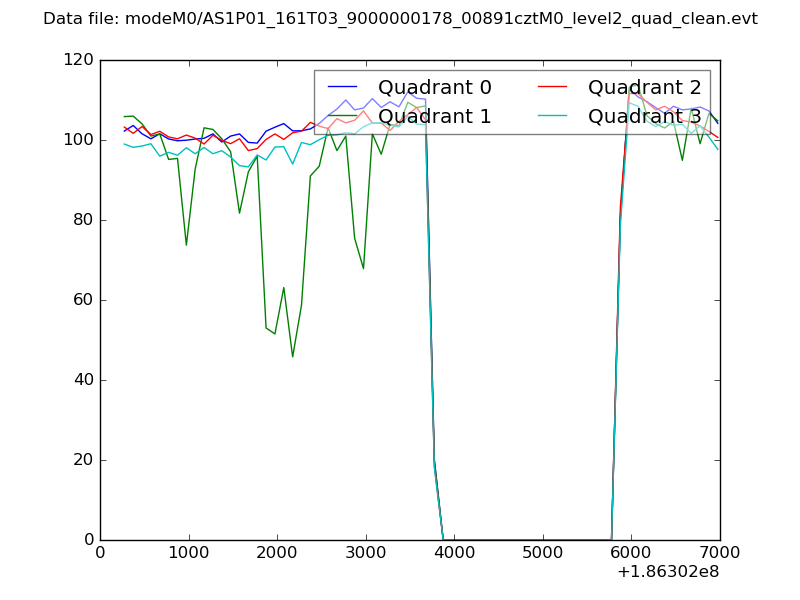 |
|
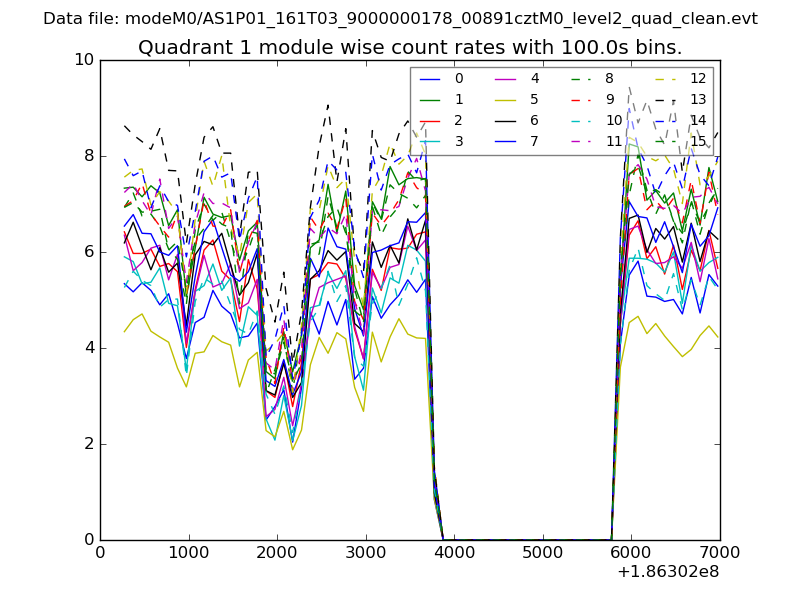
| Module-wise count rates for Quadrant A Data is divided into 100 sec bins |
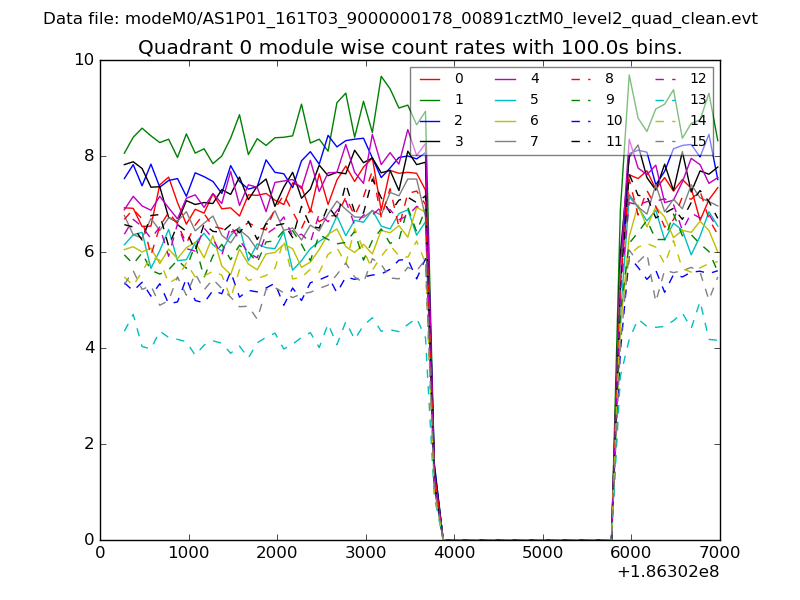 |
 |
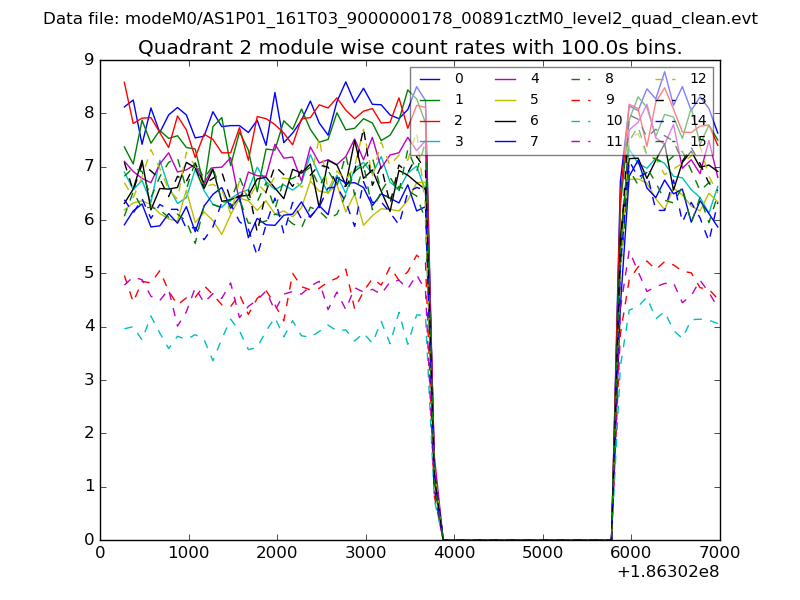
| Module-wise count rates for Quadrant B Data is divided into 100 sec bins |
 |
 |
| Module-wise count rates for Quadrant C Data is divided into 100 sec bins |
 |
 |
| Module-wise count rates for Quadrant D Data is divided into 100 sec bins |
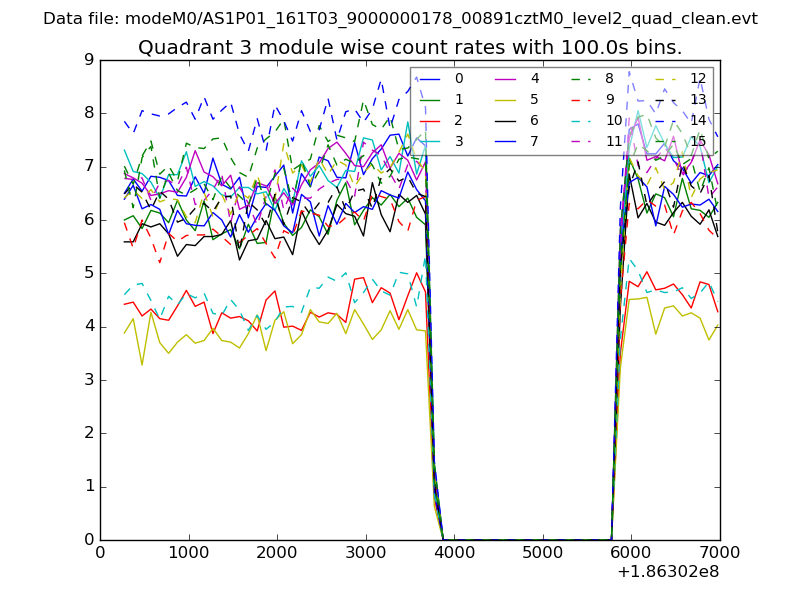 |
 |
| Parameter | Plot |
|---|---|
| CZT HV Monitor | 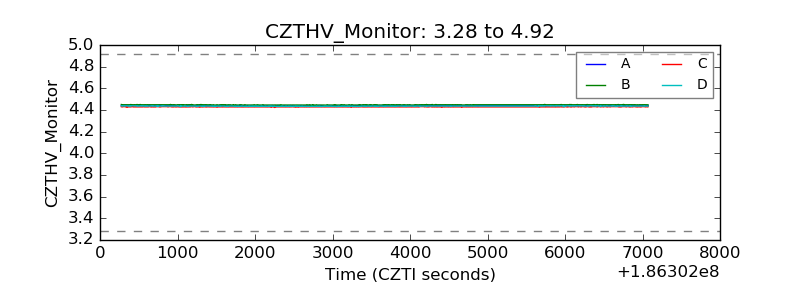 |
| D_VDD | 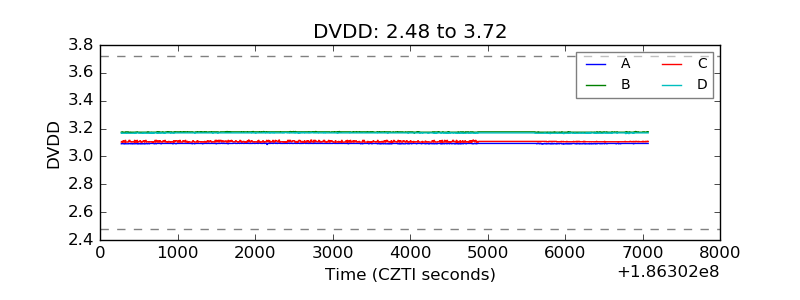 |
| Temperature 1 | 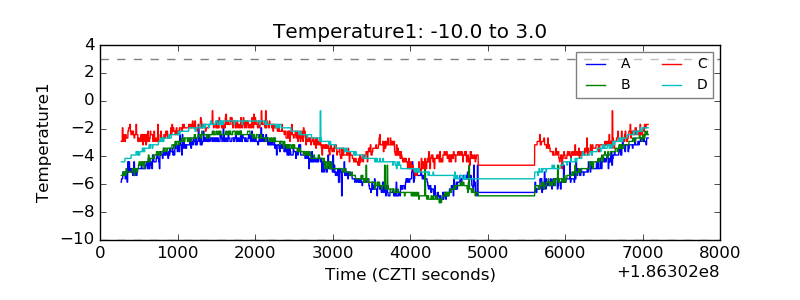 |
| Veto HV Monitor | 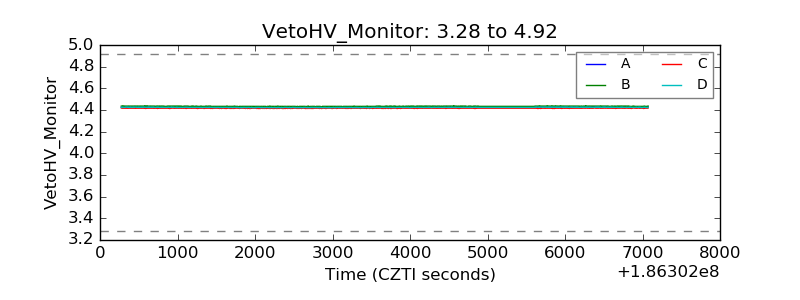 |
| Veto LLD | 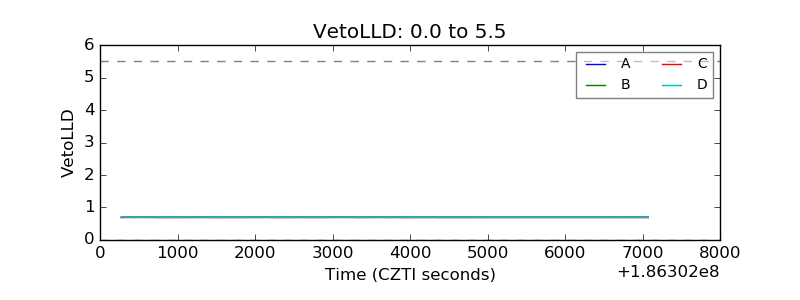 |
| Alpha Counter | 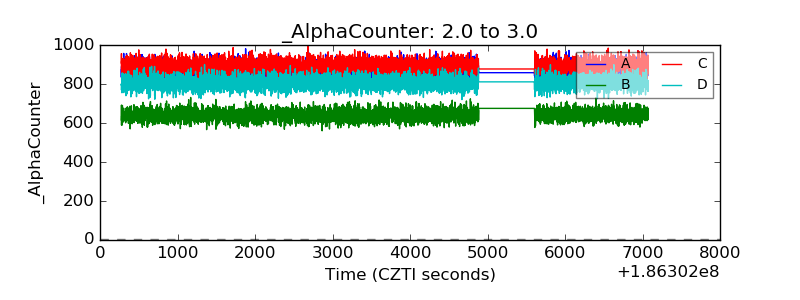 |
| _CPM_Rate | 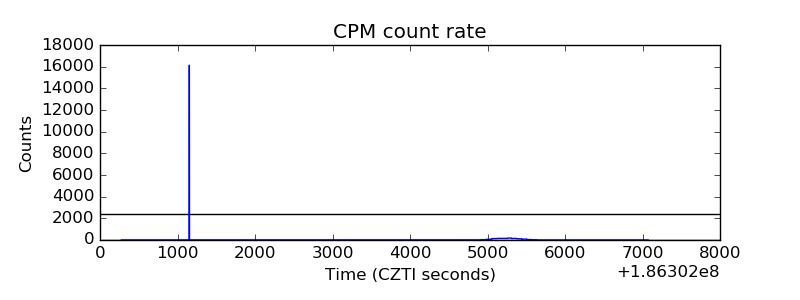 |
| CZT Counter | 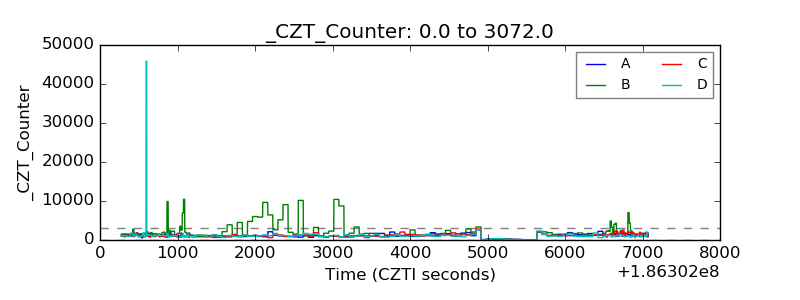 |
| +2.5 Volts monitor |  |
| +5 Volts monitor |  |
| _ROLL_ROT | 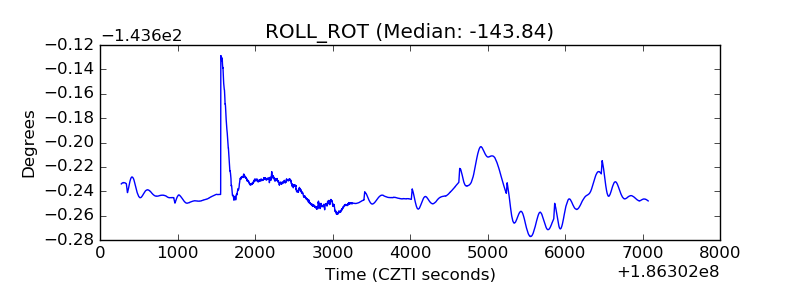 |
| _Roll_DEC | 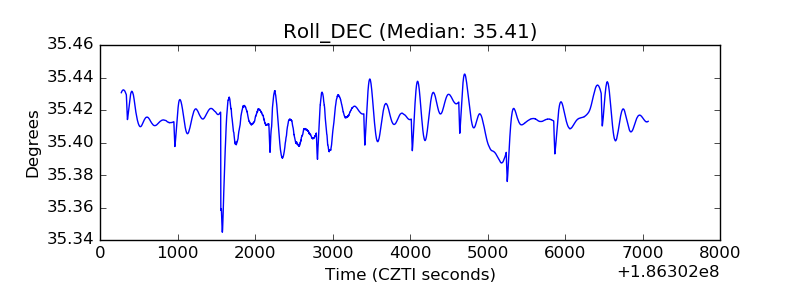 |
| _Roll_RA | 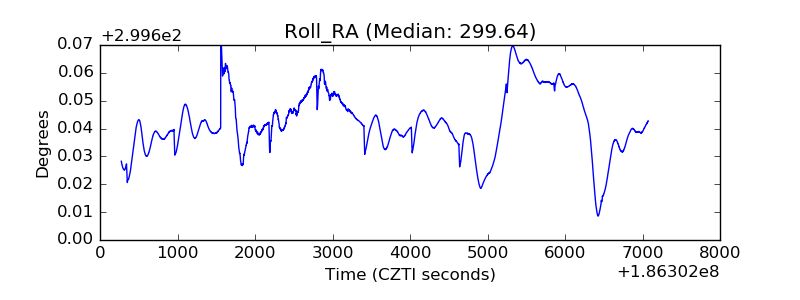 |
| Veto Counter | 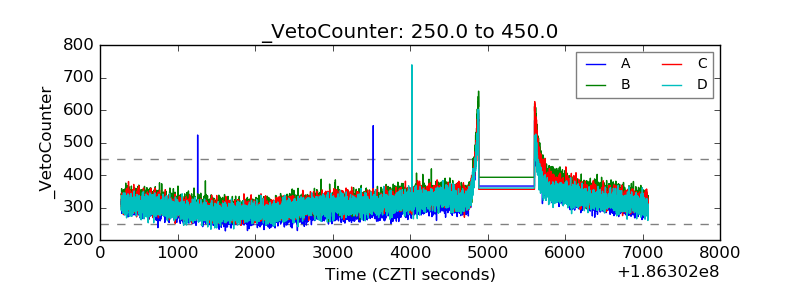 |