| Param | Original file | Final file |
|---|---|---|
| Filename | modeM0/AS1P01_161T03_9000000178_00894cztM0_level2.evt | modeM0/AS1P01_161T03_9000000178_00894cztM0_level2_quad_clean.evt |
| Size (bytes) | 1,129,852,800 | 72,982,080 |
| Size | 1.1 GB | 69.6 MB |
| Events in quadrant A | 7,005,028 | 485,320 |
| Events in quadrant B | 9,785,888 | 446,943 |
| Events in quadrant C | 10,363,257 | 401,386 |
| Events in quadrant D | 6,668,735 | 458,285 |
| Mode M9 | |||
|---|---|---|---|
| Quadrant | BADHDUFLAG | Total packets | Discarded packets |
| A | 0 | 10 | 0 |
| B | 0 | 10 | 0 |
| C | 0 | 10 | 0 |
| D | 0 | 10 | 0 |
| Mode SS | |||
|---|---|---|---|
| Quadrant | BADHDUFLAG | Total packets | Discarded packets |
| A | 0 | 120 | 0 |
| B | 0 | 120 | 0 |
| C | 0 | 120 | 0 |
| D | 0 | 120 | 0 |
| Mode M0 | |||
|---|---|---|---|
| Quadrant | BADHDUFLAG | Total packets | Discarded packets |
| A | 0 | 25070 | 0 |
| B | 0 | 33344 | 0 |
| C | 0 | 35238 | 0 |
| D | 0 | 24076 | 0 |
| Quadrant | Total seconds | Saturated seconds | Saturation percentage |
|---|---|---|---|
| A | 5969 | 26 | 0.435584% |
| B | 5969 | 631 | 10.571285% |
| C | 5969 | 1358 | 22.750880% |
| D | 5969 | 20 | 0.335064% |
Noise dominated data is calculated using 1-second bins in cleaned event files. If a bin has >2000 counts, and if more than 50% of those come from <1% of pixels, then it is considered to be noise-dominated and hence unusable.
| Quadrant | # 1 sec bins | Bins with >0 counts | Bins with >2000 counts | High rate bins dominated by noise | Noise dominated (total time) | Noise dominated (detector-on time) | Marked lightcurve |
|---|---|---|---|---|---|---|---|
| A | 7059 | 5970 | 150 | 150 | 2.12% | 2.51% | 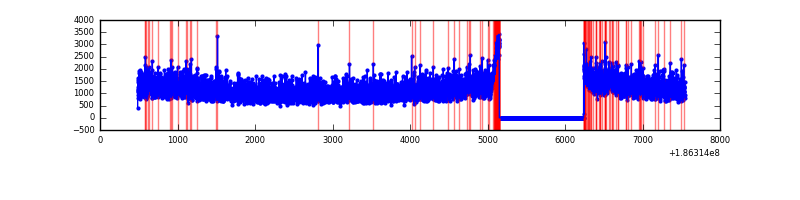 |
| B | 7059 | 5970 | 1355 | 1355 | 19.20% | 22.70% | 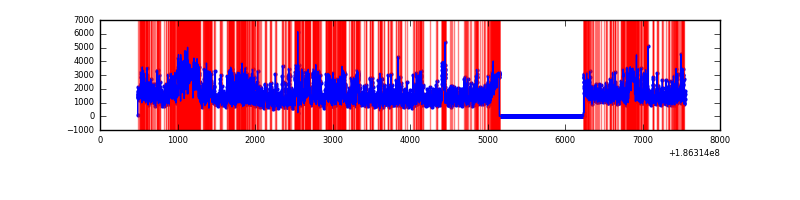 |
| C | 7059 | 5970 | 1812 | 1812 | 25.67% | 30.35% | 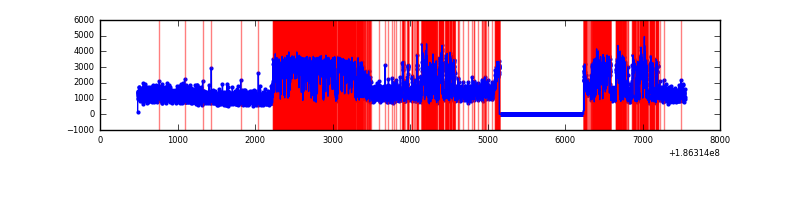 |
| D | 7059 | 5970 | 99 | 99 | 1.40% | 1.66% | 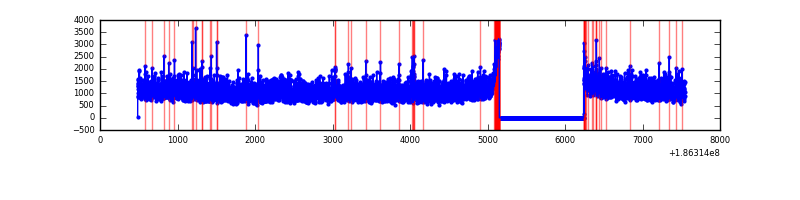 |
Top three noisy pixels from each quadrant. If the there are fewer than three noisy pixels in the level2.evt file, extra rows are filled as -1
| Pixel properties | Quadrant properties | ||||||
|---|---|---|---|---|---|---|---|
| Quadrant | DetID | PixID | Counts | Sigma | Mean | Median | Sigma |
| A | 14 | 170 | 12775 | 24.82 | 1821 | 1838 | 440.6 |
| A | 11 | 79 | 6321 | 10.17 | 1821 | 1838 | 440.6 |
| A | 3 | 111 | 5516 | 8.35 | 1821 | 1838 | 440.6 |
| B | 3 | 0 | 2560812 | 6041.01 | 1800 | 1812 | 423.6 |
| B | 8 | 38 | 176998 | 413.56 | 1800 | 1812 | 423.6 |
| B | 7 | 221 | 62891 | 144.19 | 1800 | 1812 | 423.6 |
| C | 9 | 83 | 4216322 | 9701.72 | 1554 | 1605 | 434.4 |
| C | 15 | 241 | 26532 | 57.38 | 1554 | 1605 | 434.4 |
| C | 3 | 111 | 22198 | 47.4 | 1554 | 1605 | 434.4 |
| D | 1 | 4 | 259186 | 504.41 | 1684 | 1740 | 510.4 |
| D | 2 | 16 | 27155 | 49.79 | 1684 | 1740 | 510.4 |
| D | 10 | 125 | 22552 | 40.78 | 1684 | 1740 | 510.4 |
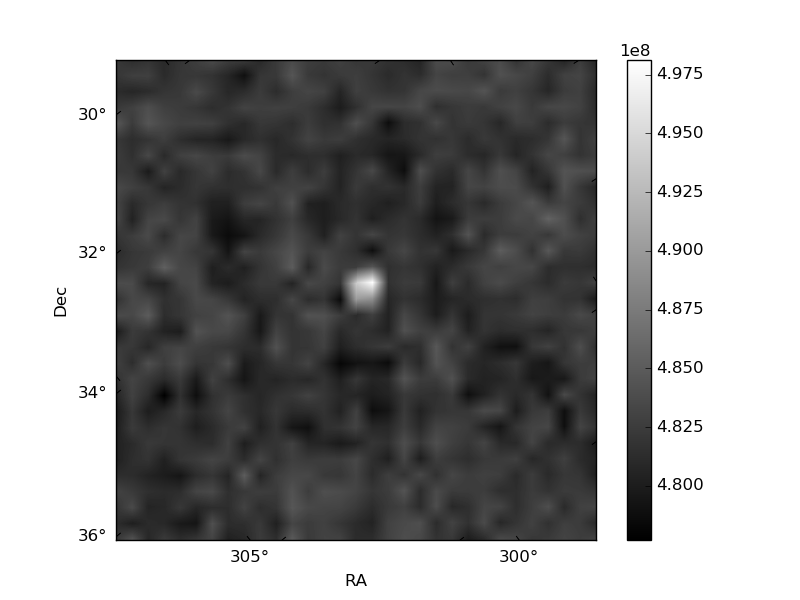
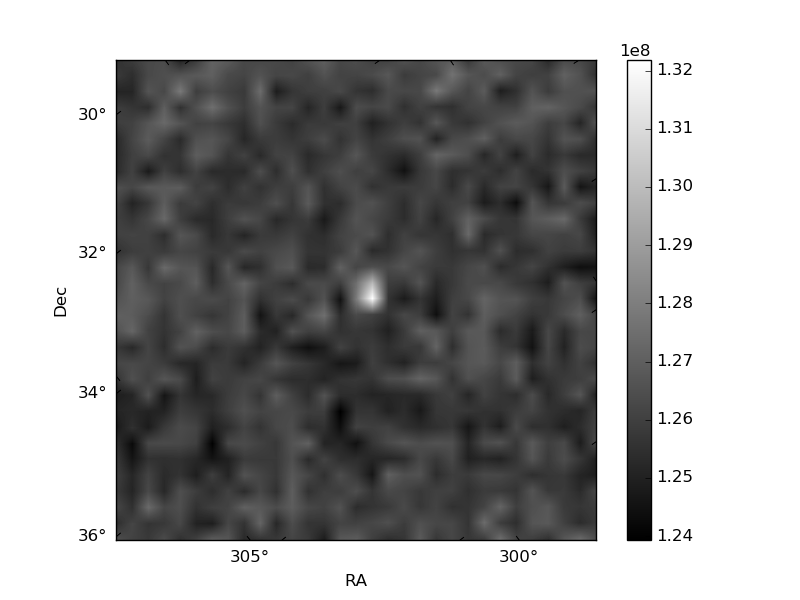
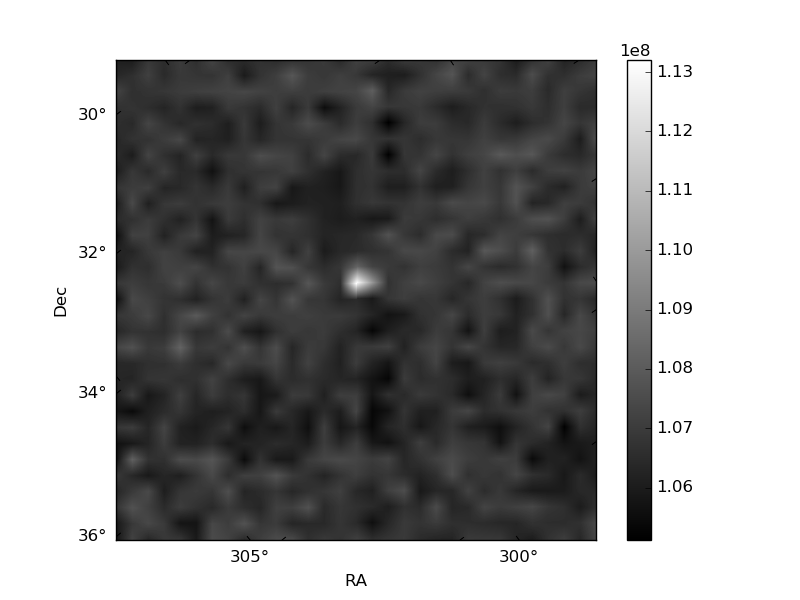
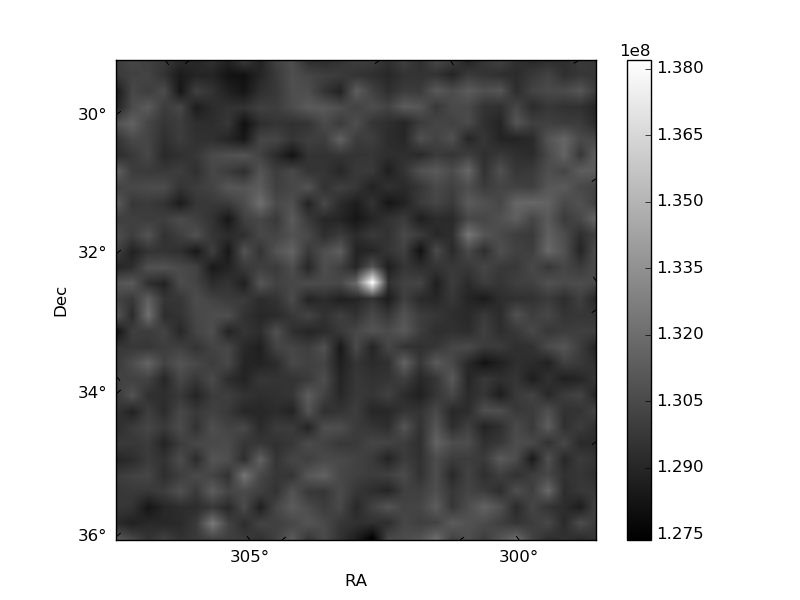
Histogram calculated using DETX and DETY for each event in the final _common_clean file
| Quadrant A | 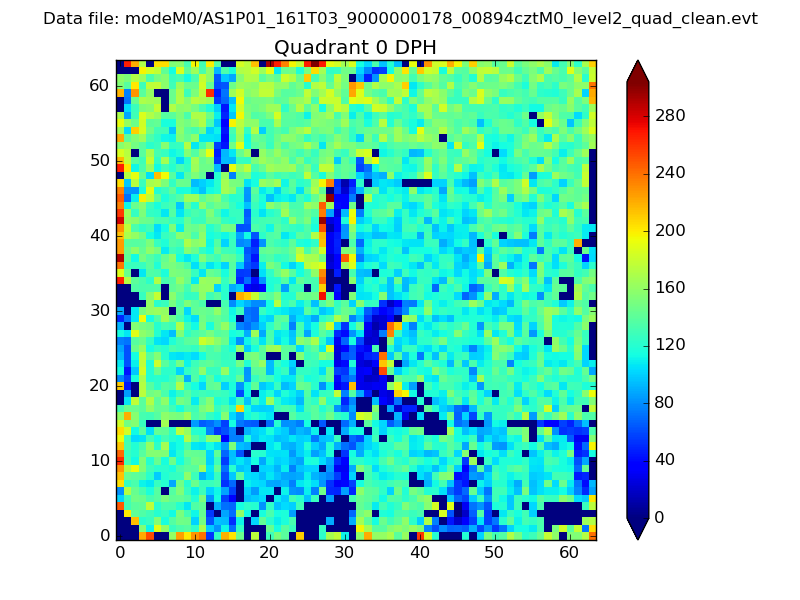 |
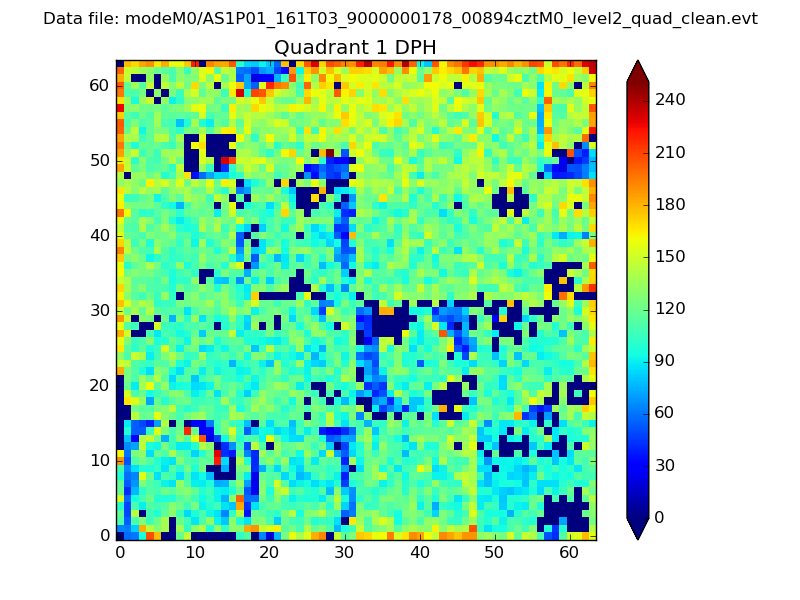 |
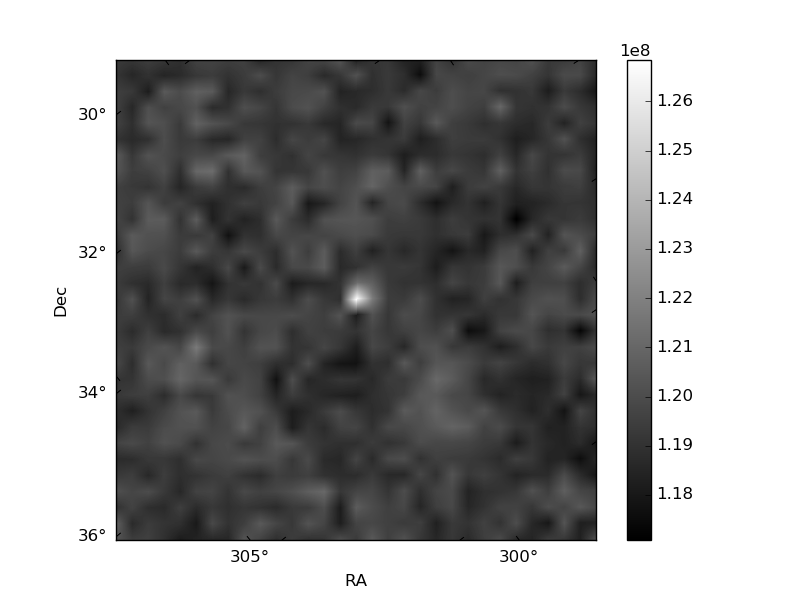
Quadrant B |
|---|---|---|---|
| Quadrant D | 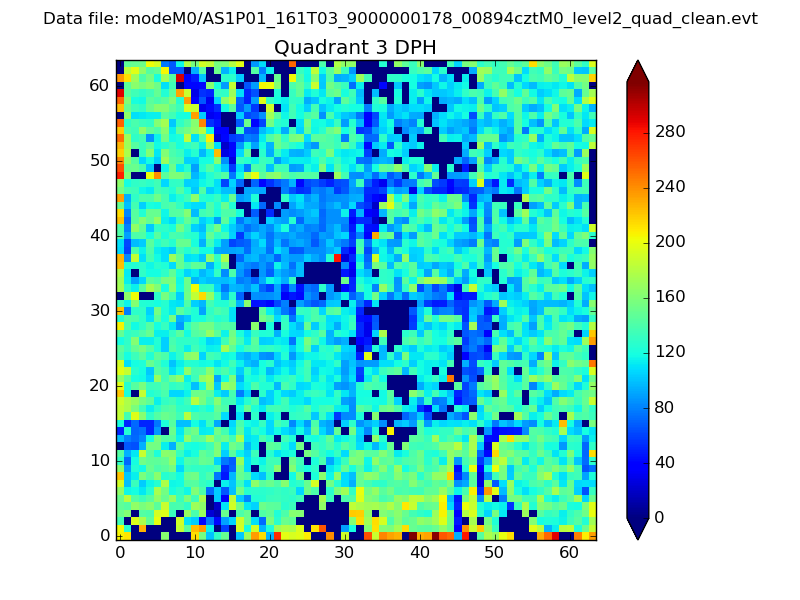 |
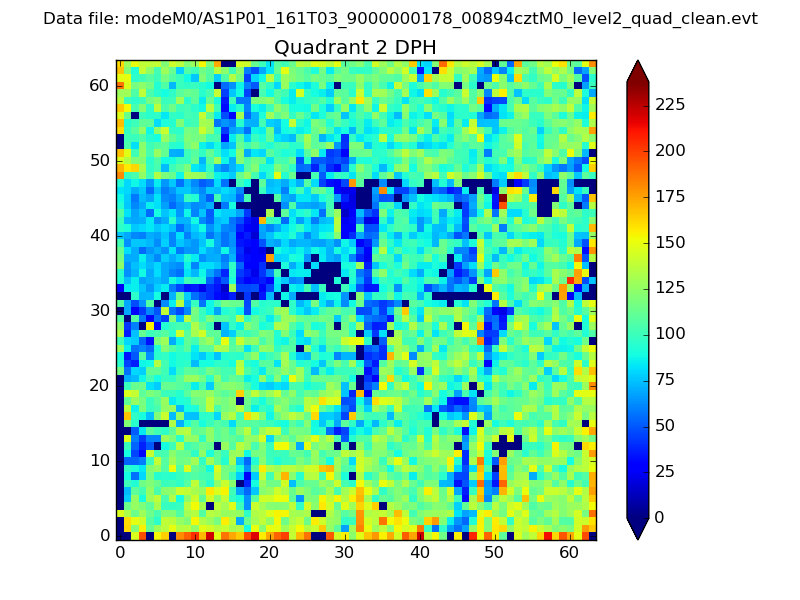 |
Quadrant C |
| Plot type | Count rate plots | Images |
|---|---|---|
| Comparison with Poisson distribution Blue bars denote a histogram of data divided into 1 sec bins. Red curve is a Poisson curve with rate = median count rate of data. |
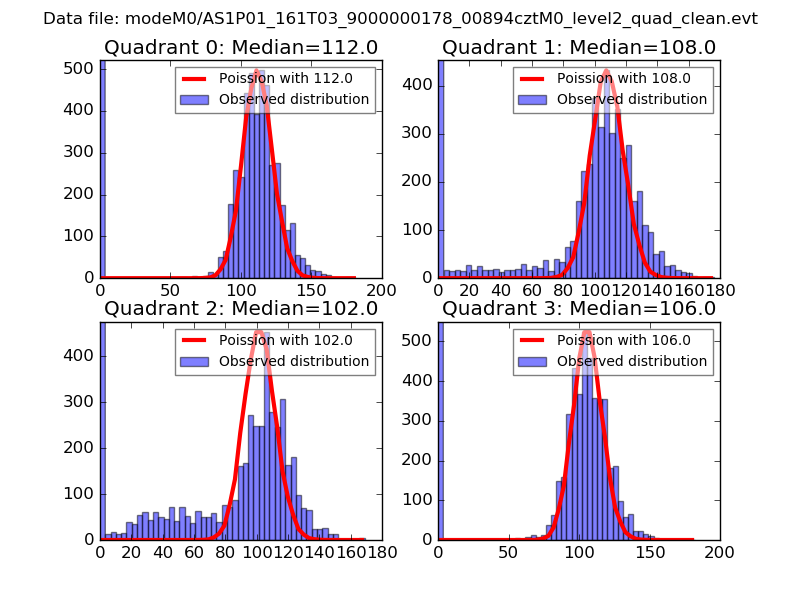 |
 |
| Quadrant-wise count rates Data is divided into 100 sec bins |
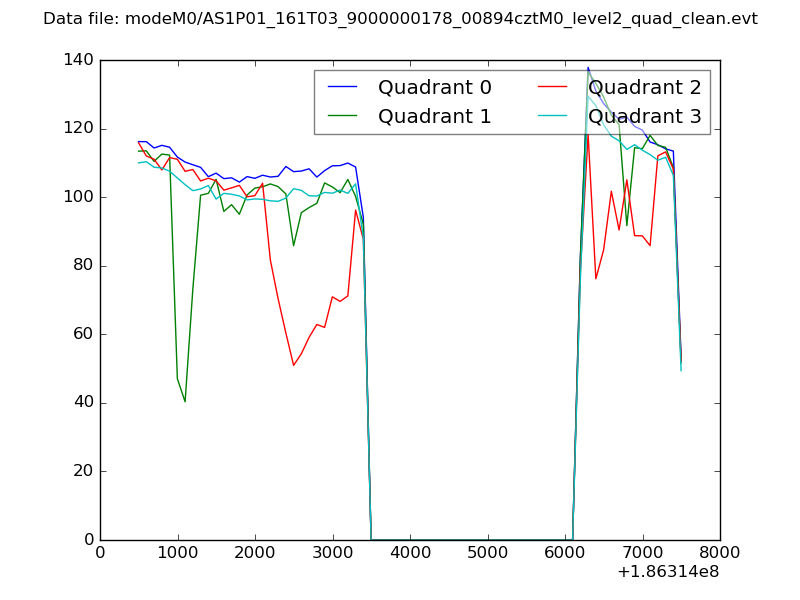 |
|
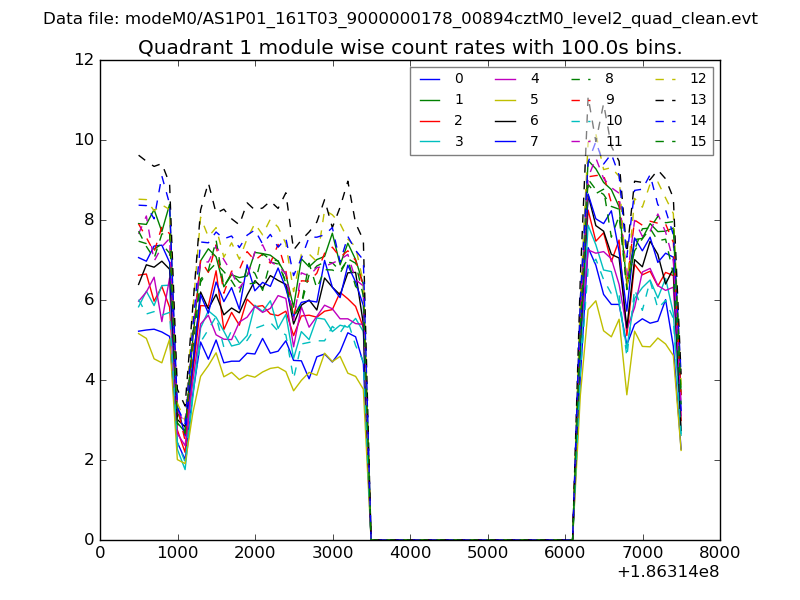
| Module-wise count rates for Quadrant A Data is divided into 100 sec bins |
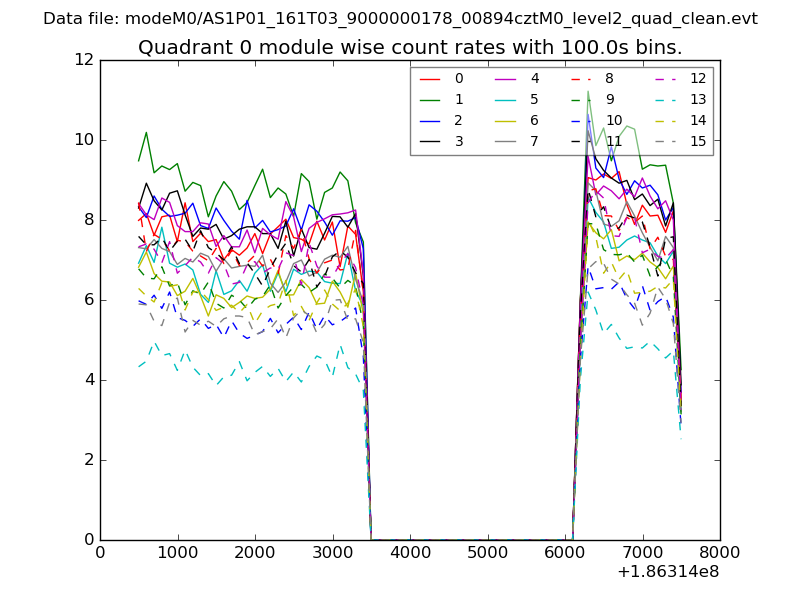 |
 |
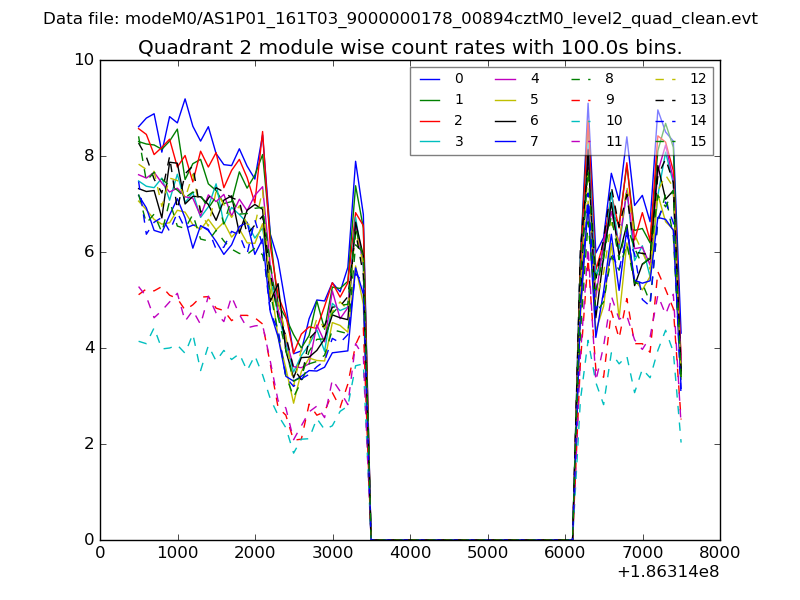
| Module-wise count rates for Quadrant B Data is divided into 100 sec bins |
 |
 |
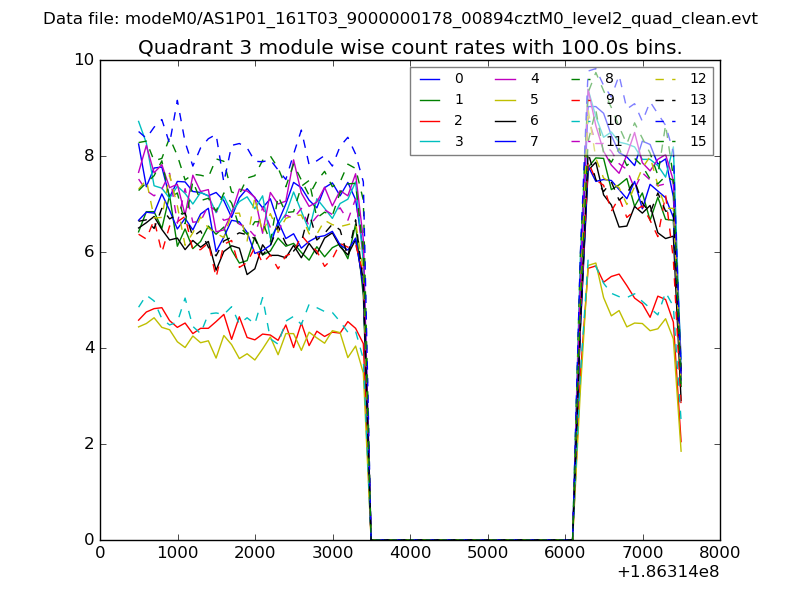
| Module-wise count rates for Quadrant C Data is divided into 100 sec bins |
 |
 |
| Module-wise count rates for Quadrant D Data is divided into 100 sec bins |
 |
 |
| Parameter | Plot |
|---|---|
| CZT HV Monitor | 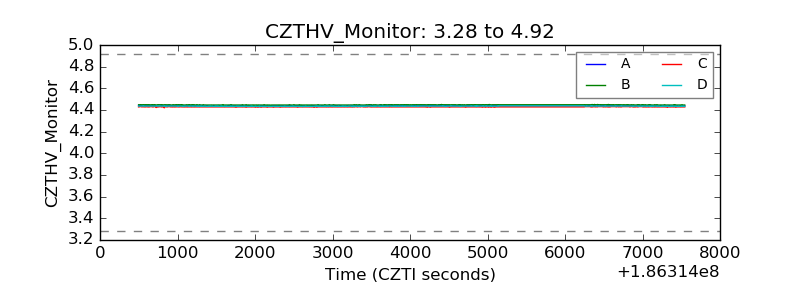 |
| D_VDD | 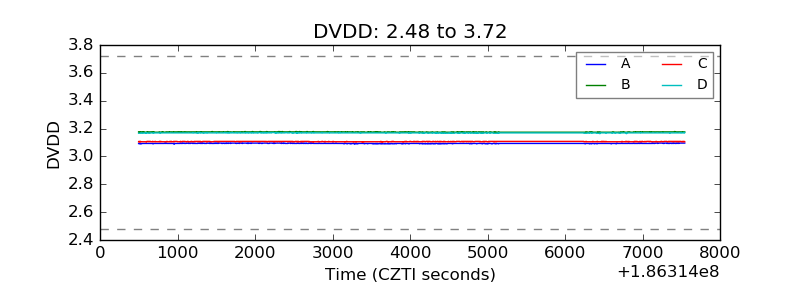 |
| Temperature 1 | 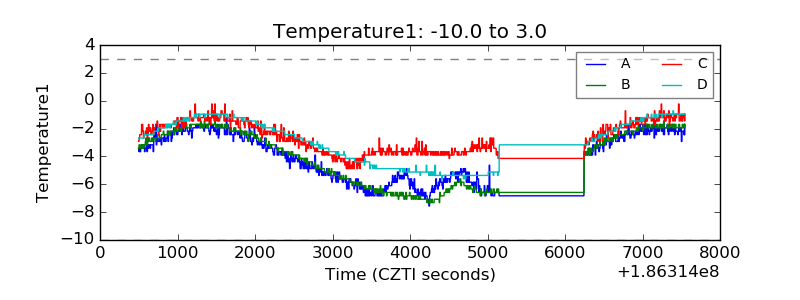 |
| Veto HV Monitor | 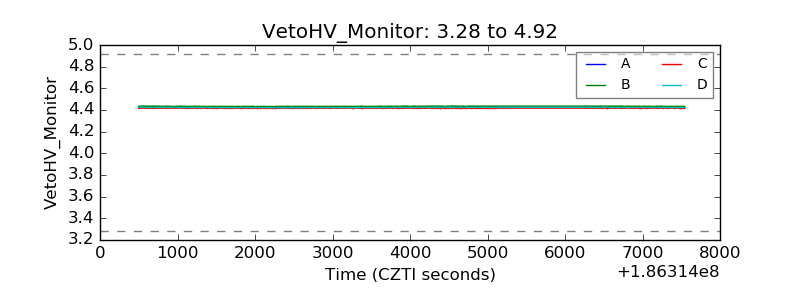 |
| Veto LLD | 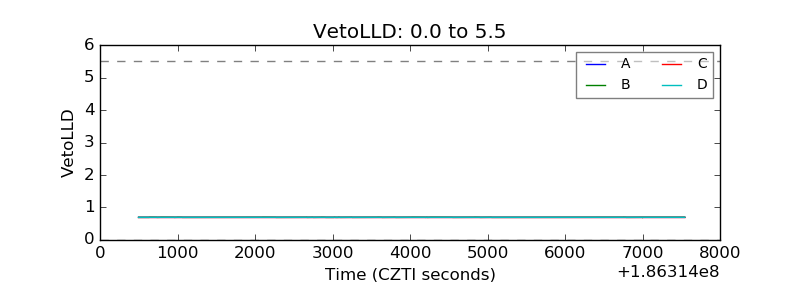 |
| Alpha Counter | 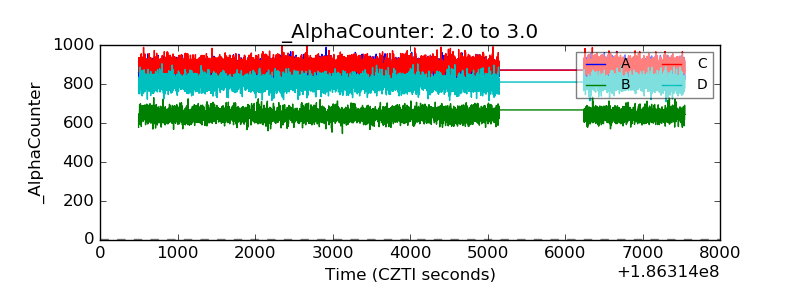 |
| _CPM_Rate | 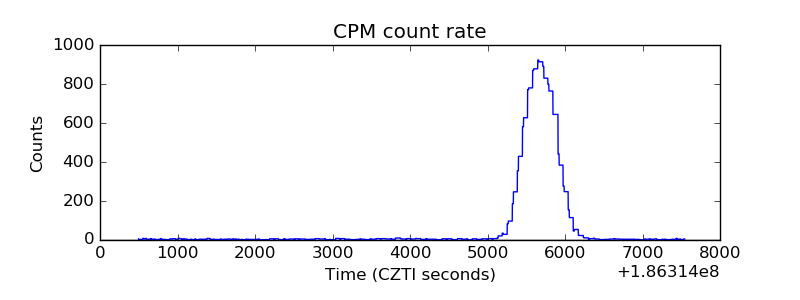 |
| CZT Counter | 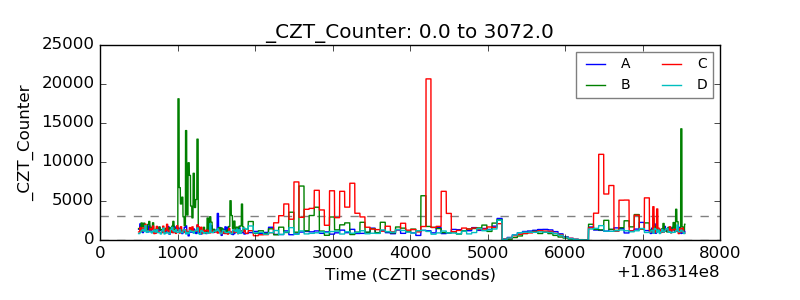 |
| +2.5 Volts monitor |  |
| +5 Volts monitor |  |
| _ROLL_ROT | 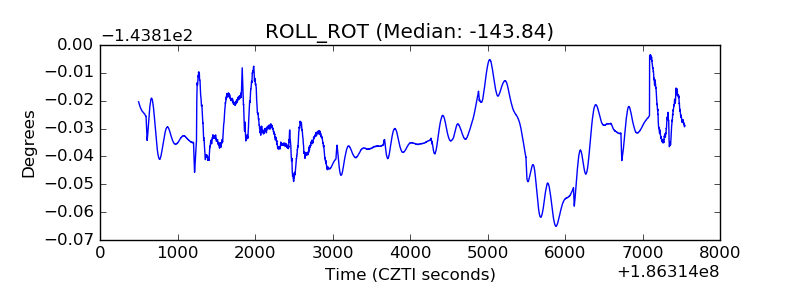 |
| _Roll_DEC | 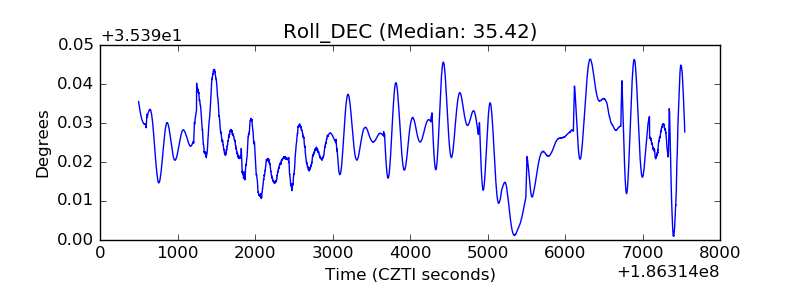 |
| _Roll_RA | 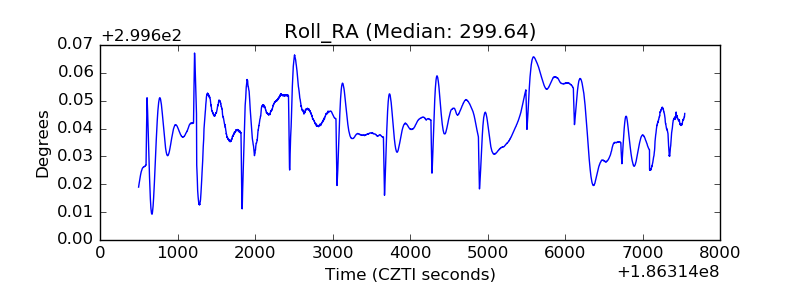 |
| Veto Counter | 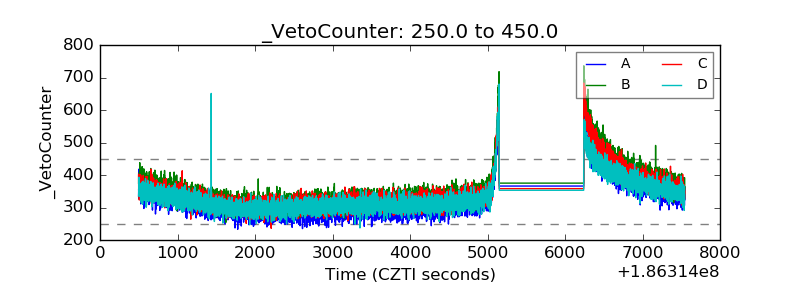 |