| Param | Original file | Final file |
|---|---|---|
| Filename | modeM0/AS1P01_161T03_9000000178_00895cztM0_level2.evt | modeM0/AS1P01_161T03_9000000178_00895cztM0_level2_quad_clean.evt |
| Size (bytes) | 964,837,440 | 69,111,360 |
| Size | 920.1 MB | 65.9 MB |
| Events in quadrant A | 6,678,646 | 438,685 |
| Events in quadrant B | 8,133,433 | 428,859 |
| Events in quadrant C | 7,772,236 | 410,774 |
| Events in quadrant D | 6,256,374 | 414,004 |
| Mode M9 | |||
|---|---|---|---|
| Quadrant | BADHDUFLAG | Total packets | Discarded packets |
| A | 0 | 12 | 0 |
| B | 0 | 12 | 0 |
| C | 0 | 12 | 0 |
| D | 0 | 12 | 0 |
| Mode SS | |||
|---|---|---|---|
| Quadrant | BADHDUFLAG | Total packets | Discarded packets |
| A | 0 | 116 | 0 |
| B | 0 | 116 | 0 |
| C | 0 | 116 | 0 |
| D | 0 | 116 | 0 |
| Mode M0 | |||
|---|---|---|---|
| Quadrant | BADHDUFLAG | Total packets | Discarded packets |
| A | 0 | 23915 | 0 |
| B | 0 | 28247 | 0 |
| C | 0 | 27203 | 0 |
| D | 0 | 22680 | 0 |
| Quadrant | Total seconds | Saturated seconds | Saturation percentage |
|---|---|---|---|
| A | 5726 | 35 | 0.611247% |
| B | 5726 | 180 | 3.143556% |
| C | 5726 | 298 | 5.204331% |
| D | 5725 | 29 | 0.506550% |
Noise dominated data is calculated using 1-second bins in cleaned event files. If a bin has >2000 counts, and if more than 50% of those come from <1% of pixels, then it is considered to be noise-dominated and hence unusable.
| Quadrant | # 1 sec bins | Bins with >0 counts | Bins with >2000 counts | High rate bins dominated by noise | Noise dominated (total time) | Noise dominated (detector-on time) | Marked lightcurve |
|---|---|---|---|---|---|---|---|
| A | 6916 | 5727 | 152 | 152 | 2.20% | 2.65% | 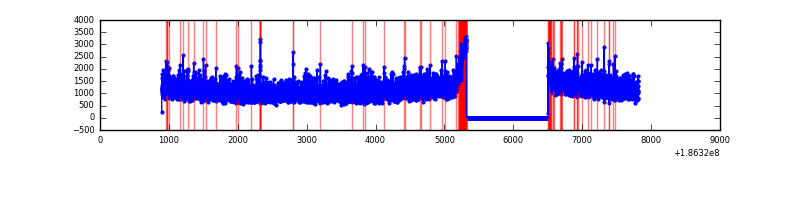 |
| B | 6916 | 5727 | 659 | 659 | 9.53% | 11.51% | 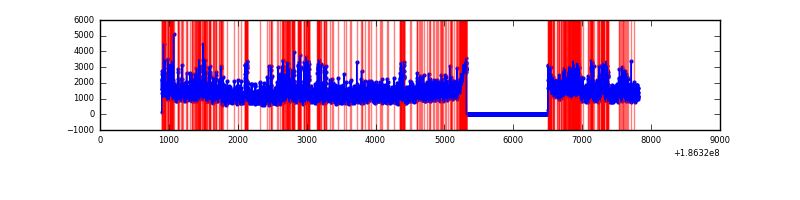 |
| C | 6916 | 5727 | 488 | 488 | 7.06% | 8.52% | 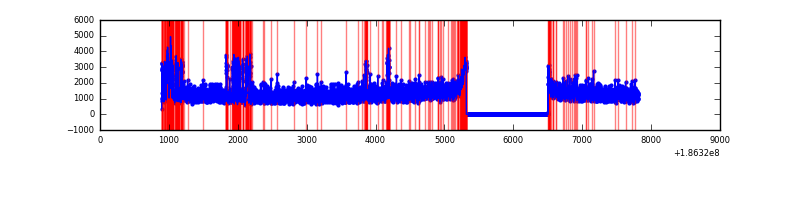 |
| D | 6915 | 5726 | 104 | 104 | 1.50% | 1.82% | 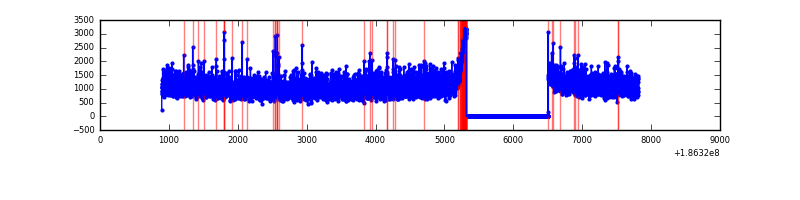 |
Top three noisy pixels from each quadrant. If the there are fewer than three noisy pixels in the level2.evt file, extra rows are filled as -1
| Pixel properties | Quadrant properties | ||||||
|---|---|---|---|---|---|---|---|
| Quadrant | DetID | PixID | Counts | Sigma | Mean | Median | Sigma |
| A | 15 | 233 | 29205 | 66.72 | 1731 | 1749 | 411.5 |
| A | 14 | 170 | 7907 | 14.96 | 1731 | 1749 | 411.5 |
| A | 11 | 79 | 7023 | 12.82 | 1731 | 1749 | 411.5 |
| B | 3 | 0 | 898820 | 2154.23 | 1792 | 1803 | 416.4 |
| B | 7 | 221 | 161003 | 382.33 | 1792 | 1803 | 416.4 |
| B | 8 | 38 | 83992 | 197.38 | 1792 | 1803 | 416.4 |
| C | 9 | 83 | 1274407 | 2828.5 | 1616 | 1673 | 450.0 |
| C | 9 | 52 | 125058 | 274.21 | 1616 | 1673 | 450.0 |
| C | 3 | 111 | 22474 | 46.23 | 1616 | 1673 | 450.0 |
| D | 1 | 4 | 134597 | 266.81 | 1613 | 1676 | 498.2 |
| D | 10 | 157 | 17322 | 31.41 | 1613 | 1676 | 498.2 |
| D | 13 | 13 | 14794 | 26.33 | 1613 | 1676 | 498.2 |
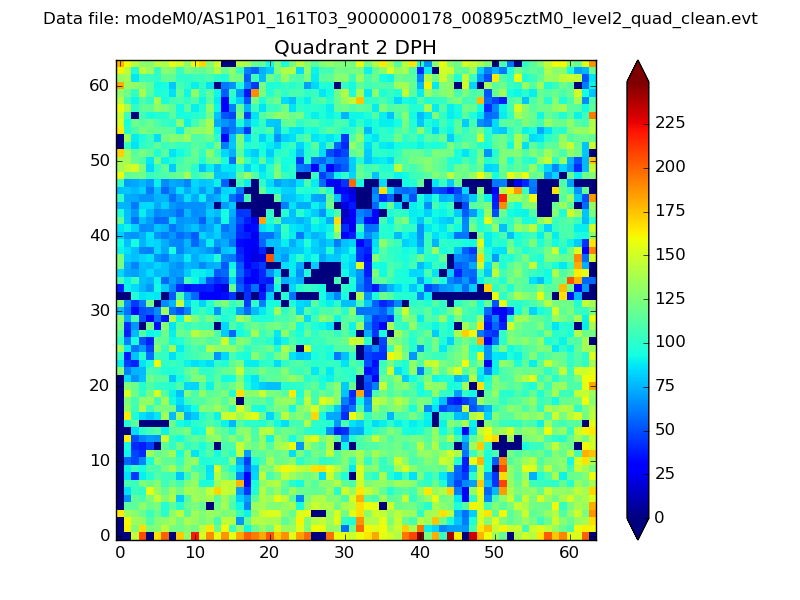
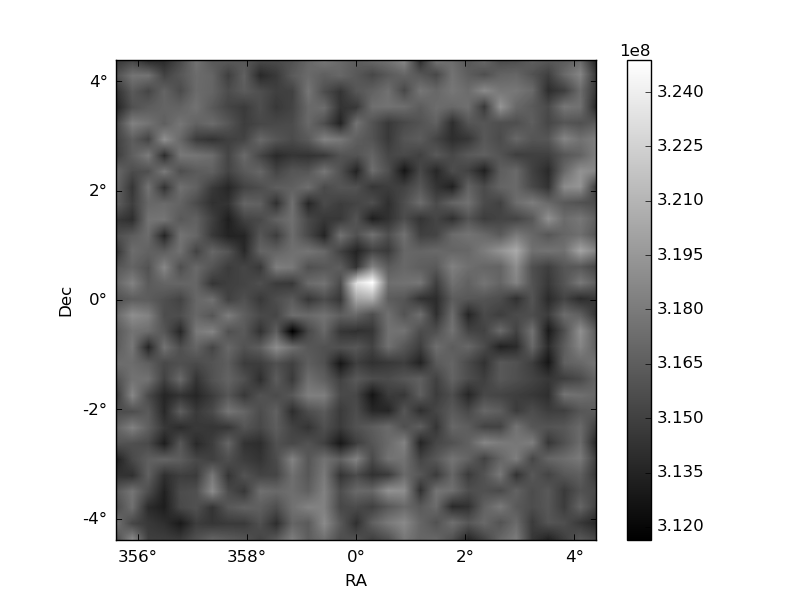
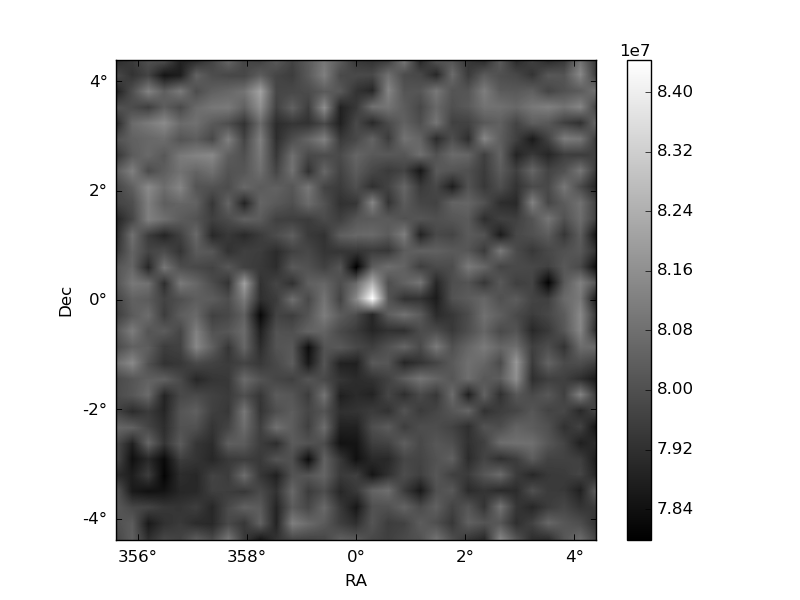
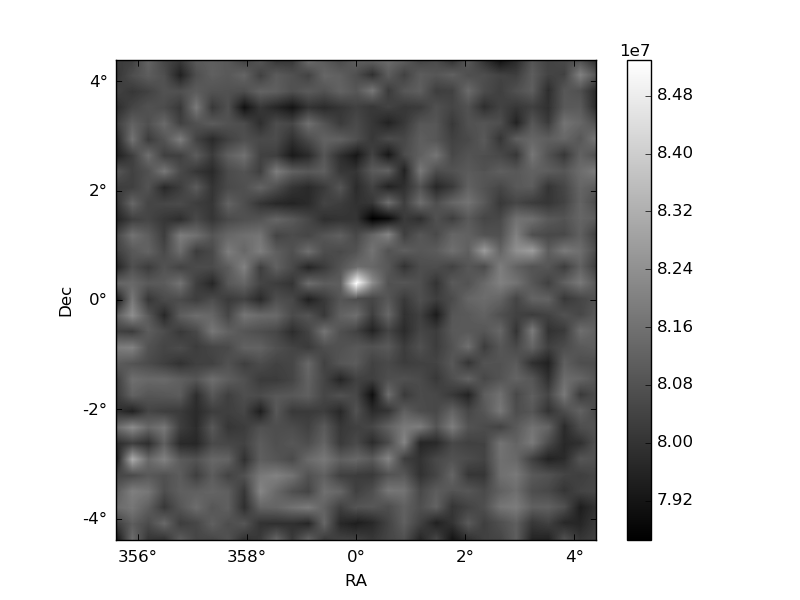
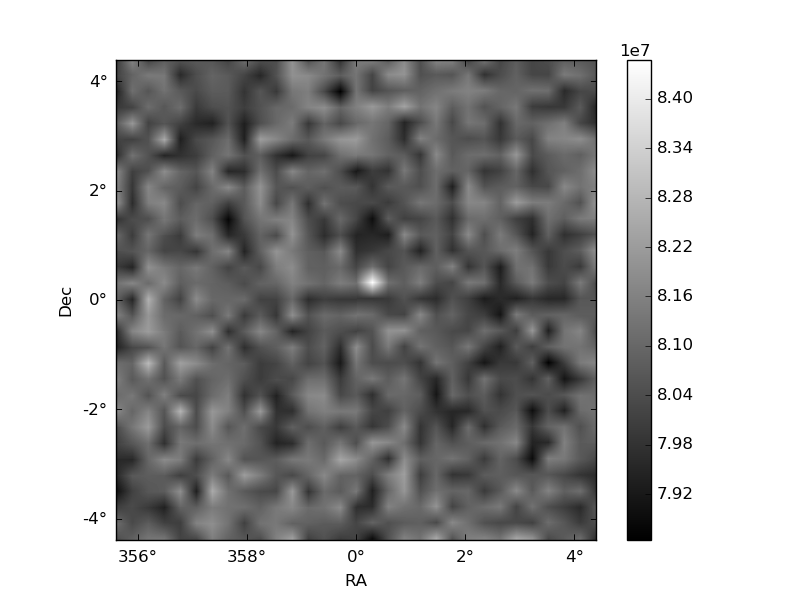
Histogram calculated using DETX and DETY for each event in the final _common_clean file
| Quadrant A | 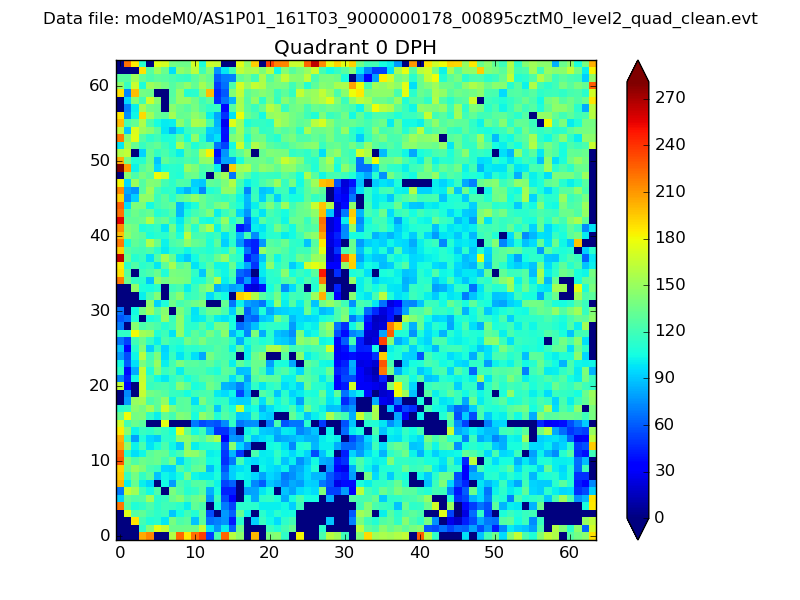 |
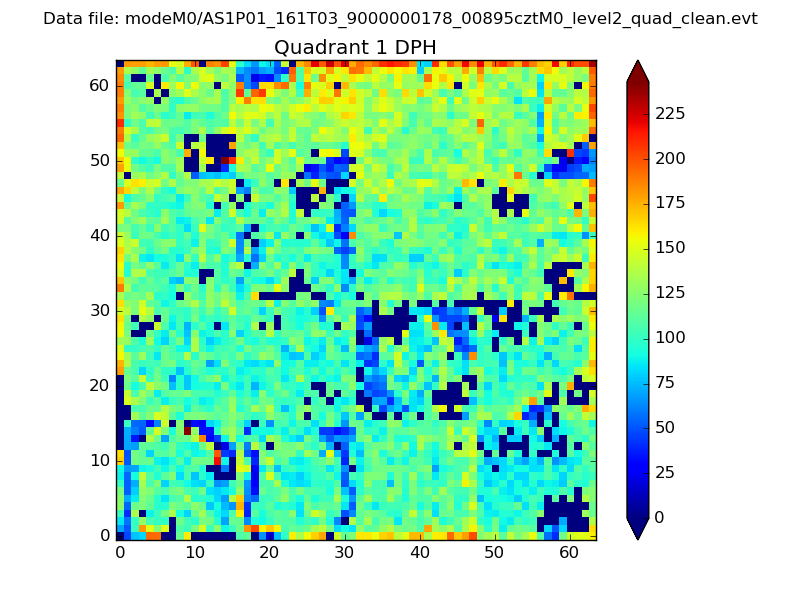 |
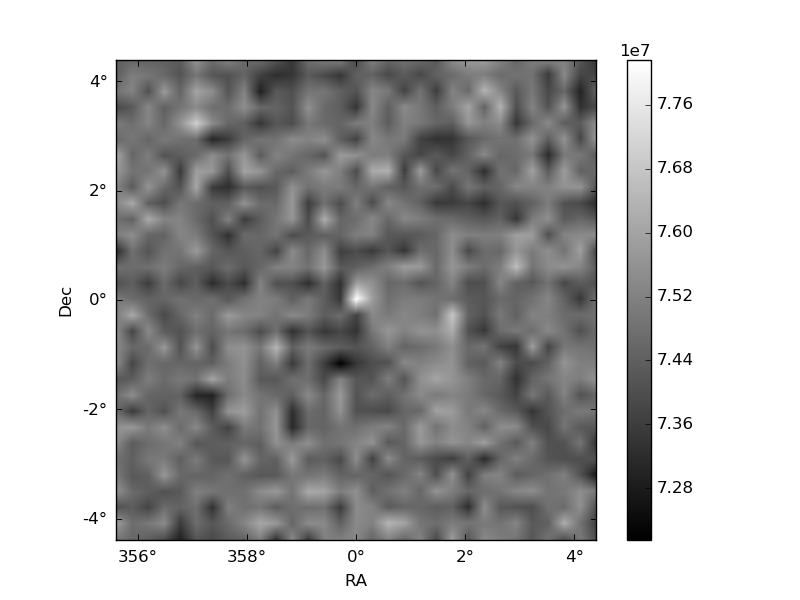
Quadrant B |
|---|---|---|---|
| Quadrant D | 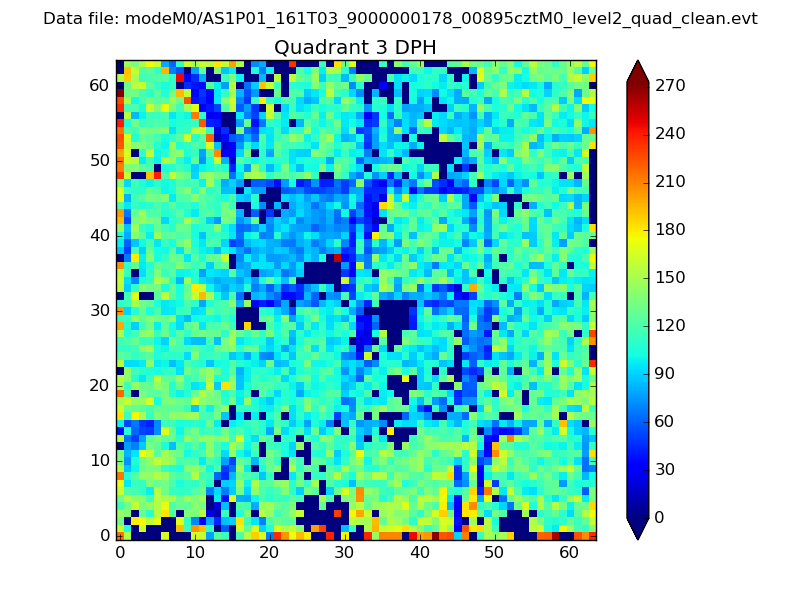 |
 |
Quadrant C |
| Plot type | Count rate plots | Images |
|---|---|---|
| Comparison with Poisson distribution Blue bars denote a histogram of data divided into 1 sec bins. Red curve is a Poisson curve with rate = median count rate of data. |
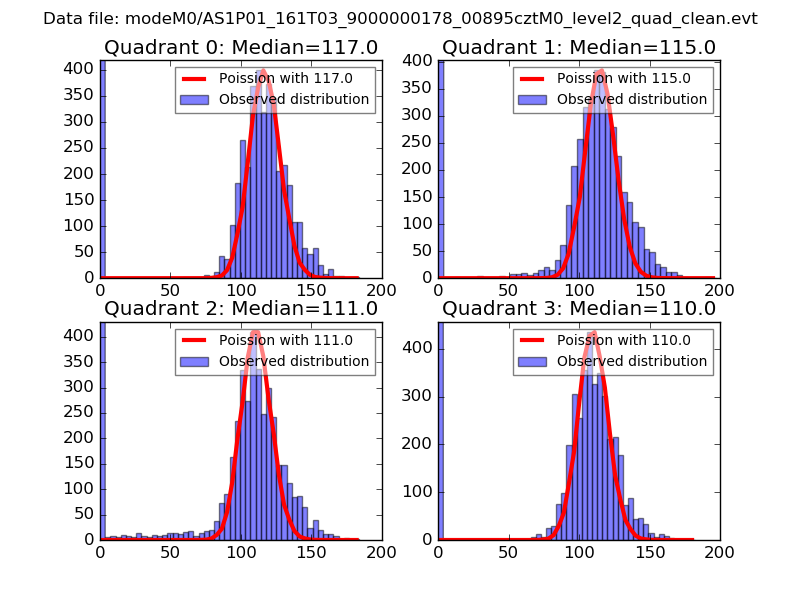 |
 |
| Quadrant-wise count rates Data is divided into 100 sec bins |
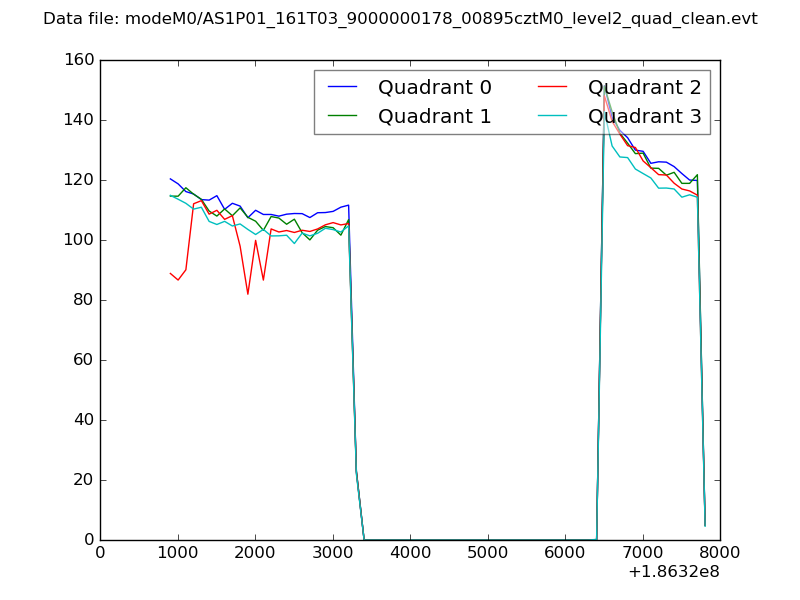 |
|
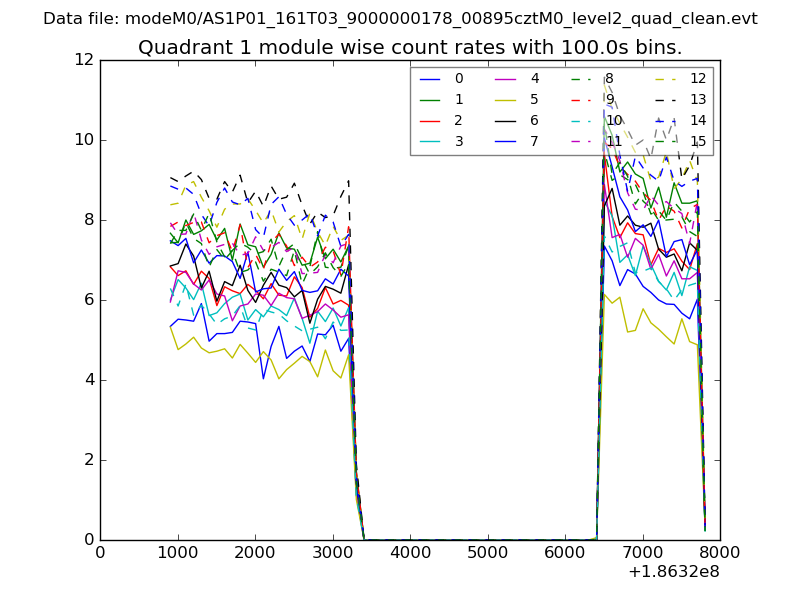
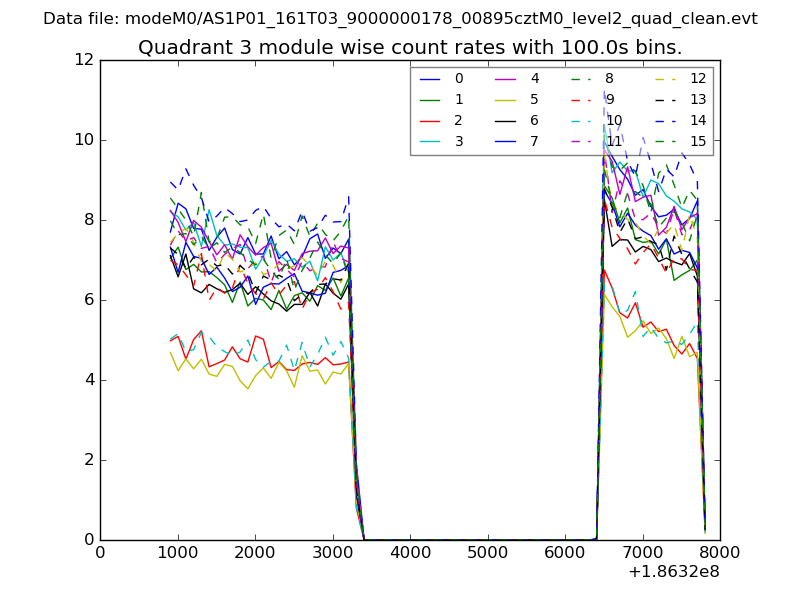
| Module-wise count rates for Quadrant A Data is divided into 100 sec bins |
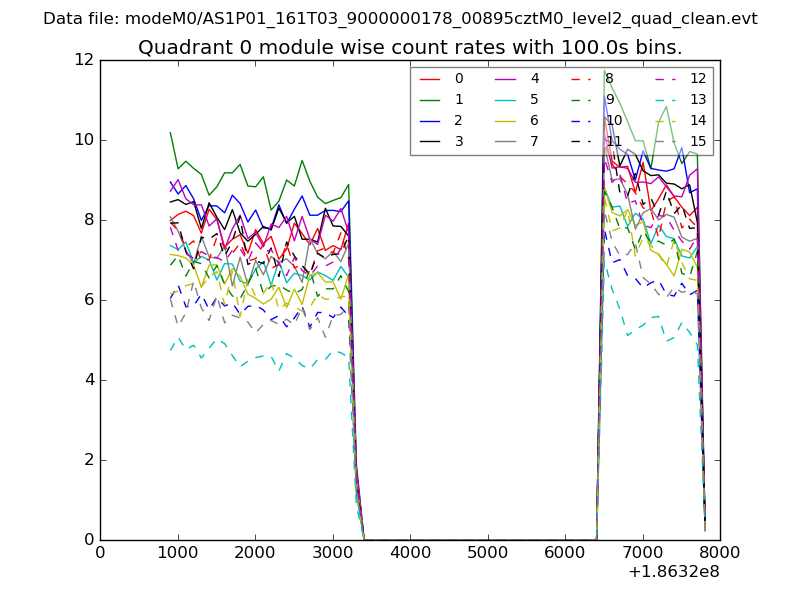 |
 |
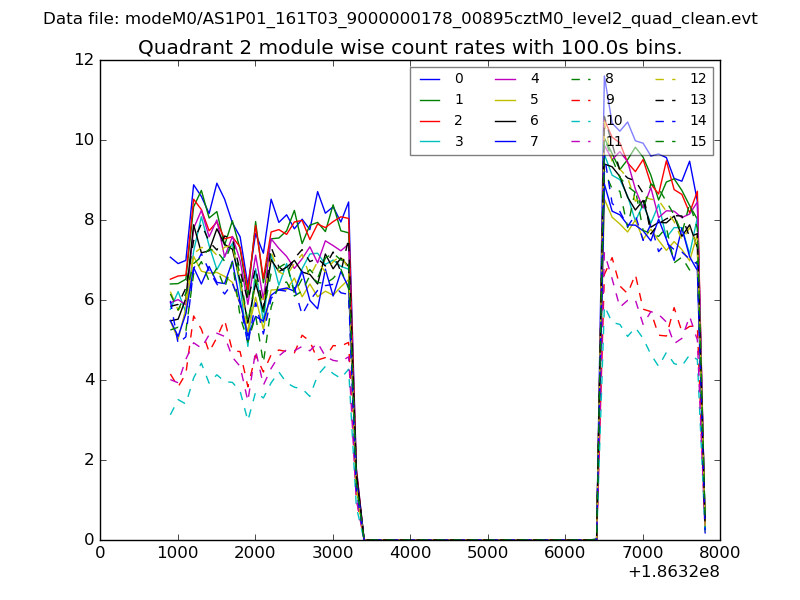
| Module-wise count rates for Quadrant B Data is divided into 100 sec bins |
 |
 |
| Module-wise count rates for Quadrant C Data is divided into 100 sec bins |
 |
 |
| Module-wise count rates for Quadrant D Data is divided into 100 sec bins |
 |
 |
| Parameter | Plot |
|---|---|
| CZT HV Monitor | 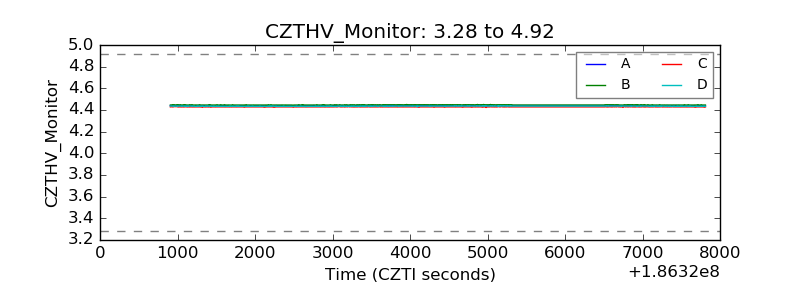 |
| D_VDD |  |
| Temperature 1 | 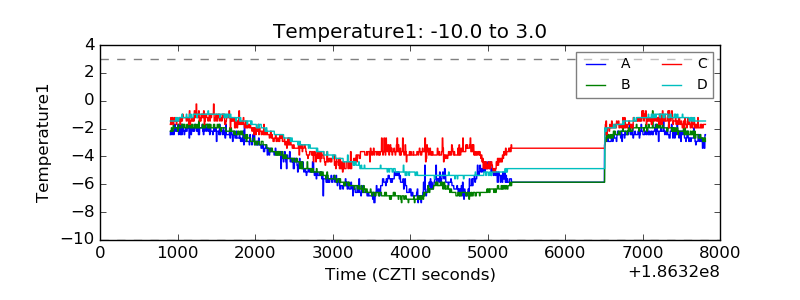 |
| Veto HV Monitor | 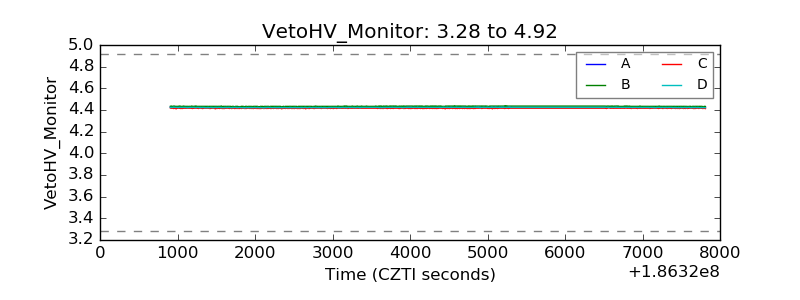 |
| Veto LLD | 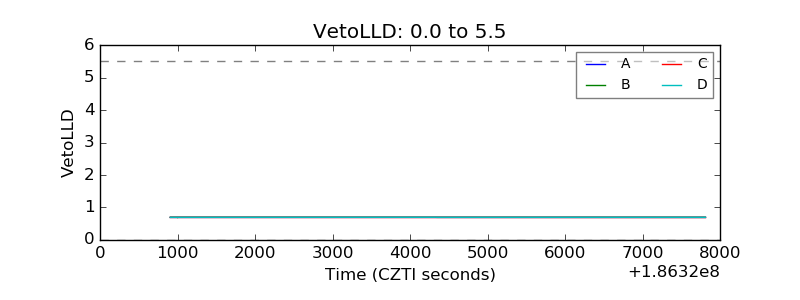 |
| Alpha Counter | 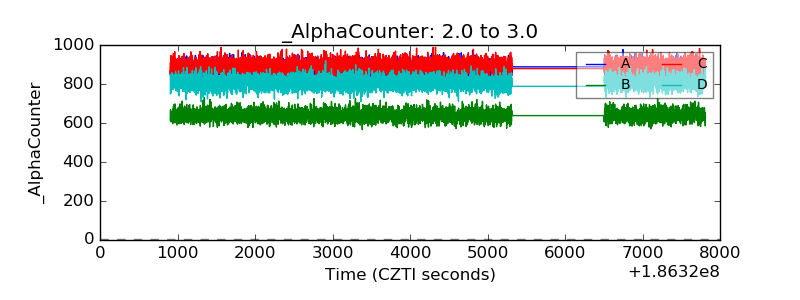 |
| _CPM_Rate | 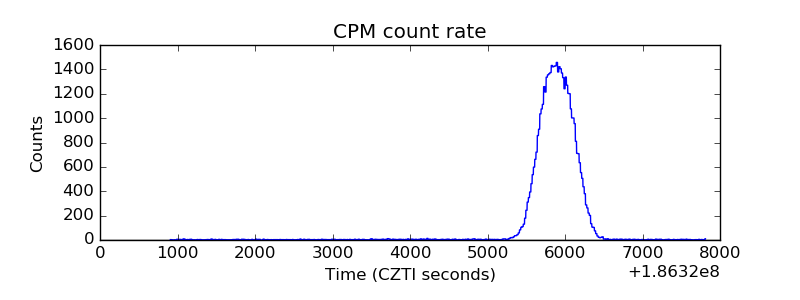 |
| CZT Counter | 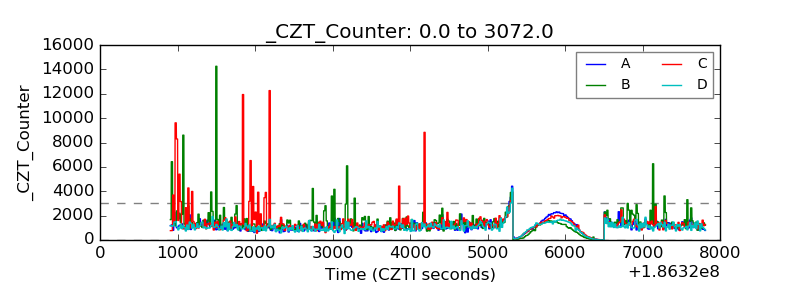 |
| +2.5 Volts monitor |  |
| +5 Volts monitor |  |
| _ROLL_ROT | 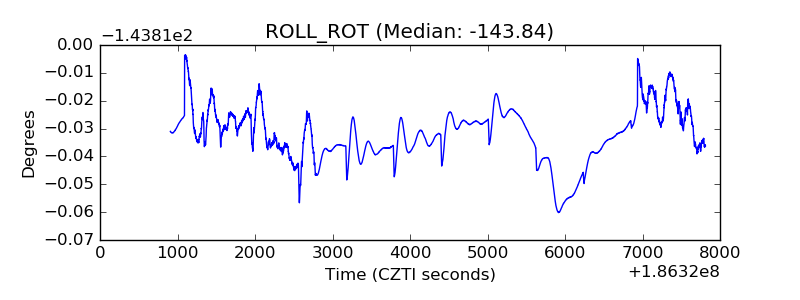 |
| _Roll_DEC | 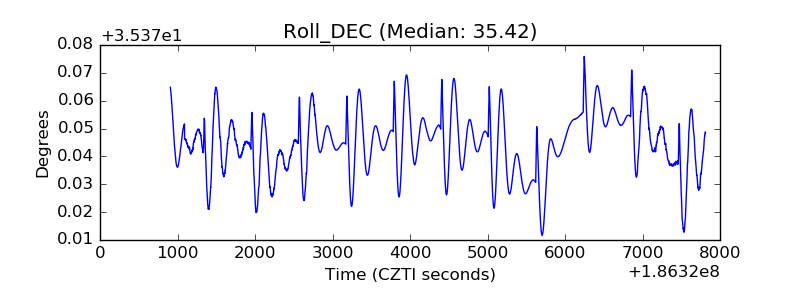 |
| _Roll_RA | 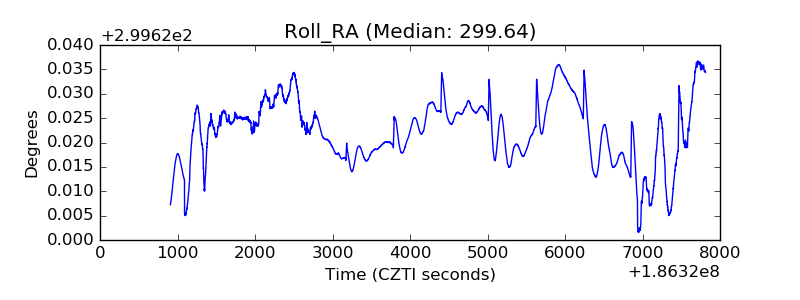 |
| Veto Counter | 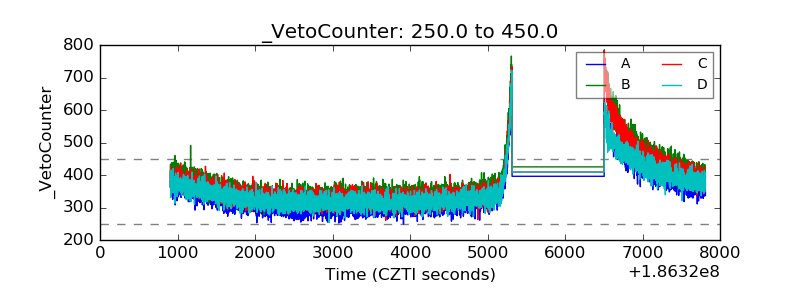 |