| Param | Original file | Final file |
|---|---|---|
| Filename | modeM0/AS1P01_161T05_9000000180_00898cztM0_level2.evt | modeM0/AS1P01_161T05_9000000180_00898cztM0_level2_quad_clean.evt |
| Size (bytes) | 1,065,211,200 | 71,763,840 |
| Size | 1015.9 MB | 68.4 MB |
| Events in quadrant A | 7,271,706 | 446,612 |
| Events in quadrant B | 9,378,668 | 426,984 |
| Events in quadrant C | 8,238,129 | 441,660 |
| Events in quadrant D | 6,965,324 | 429,032 |
| Mode M9 | |||
|---|---|---|---|
| Quadrant | BADHDUFLAG | Total packets | Discarded packets |
| A | 0 | 12 | 0 |
| B | 0 | 12 | 0 |
| C | 0 | 12 | 0 |
| D | 0 | 12 | 0 |
| Mode SS | |||
|---|---|---|---|
| Quadrant | BADHDUFLAG | Total packets | Discarded packets |
| A | 0 | 126 | 0 |
| B | 0 | 126 | 0 |
| C | 0 | 126 | 0 |
| D | 0 | 126 | 0 |
| Mode M0 | |||
|---|---|---|---|
| Quadrant | BADHDUFLAG | Total packets | Discarded packets |
| A | 0 | 25938 | 0 |
| B | 0 | 32243 | 0 |
| C | 0 | 28806 | 0 |
| D | 0 | 25065 | 0 |
| Quadrant | Total seconds | Saturated seconds | Saturation percentage |
|---|---|---|---|
| A | 6134 | 7 | 0.114118% |
| B | 6134 | 447 | 7.287251% |
| C | 6133 | 22 | 0.358715% |
| D | 6134 | 21 | 0.342354% |
Noise dominated data is calculated using 1-second bins in cleaned event files. If a bin has >2000 counts, and if more than 50% of those come from <1% of pixels, then it is considered to be noise-dominated and hence unusable.
| Quadrant | # 1 sec bins | Bins with >0 counts | Bins with >2000 counts | High rate bins dominated by noise | Noise dominated (total time) | Noise dominated (detector-on time) | Marked lightcurve |
|---|---|---|---|---|---|---|---|
| A | 7409 | 6135 | 181 | 181 | 2.44% | 2.95% |  |
| B | 7409 | 6135 | 1042 | 1042 | 14.06% | 16.98% | 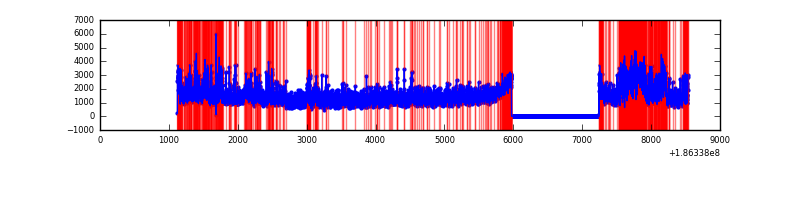 |
| C | 7408 | 6134 | 318 | 318 | 4.29% | 5.18% | 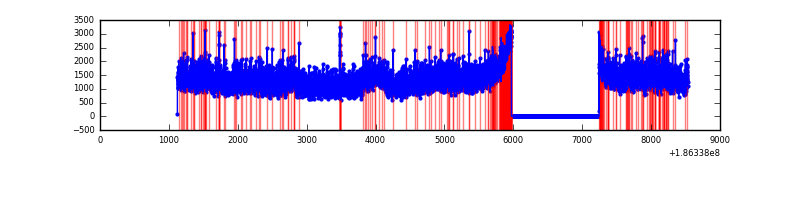 |
| D | 7409 | 6135 | 180 | 180 | 2.43% | 2.93% |  |
Top three noisy pixels from each quadrant. If the there are fewer than three noisy pixels in the level2.evt file, extra rows are filled as -1
| Pixel properties | Quadrant properties | ||||||
|---|---|---|---|---|---|---|---|
| Quadrant | DetID | PixID | Counts | Sigma | Mean | Median | Sigma |
| A | 15 | 127 | 99384 | 221.61 | 1836 | 1856 | 440.1 |
| A | 14 | 170 | 88579 | 197.06 | 1836 | 1856 | 440.1 |
| A | 12 | 133 | 28748 | 61.11 | 1836 | 1856 | 440.1 |
| B | 3 | 0 | 1829257 | 4163.42 | 1892 | 1902 | 438.9 |
| B | 0 | 220 | 123426 | 276.88 | 1892 | 1902 | 438.9 |
| B | 0 | 187 | 71983 | 159.67 | 1892 | 1902 | 438.9 |
| C | 9 | 83 | 1043646 | 2110.81 | 1789 | 1856 | 493.5 |
| C | 9 | 54 | 124126 | 247.74 | 1789 | 1856 | 493.5 |
| C | 3 | 111 | 24413 | 45.7 | 1789 | 1856 | 493.5 |
| D | 1 | 4 | 168492 | 311.84 | 1728 | 1792 | 534.6 |
| D | 2 | 53 | 144977 | 267.86 | 1728 | 1792 | 534.6 |
| D | 13 | 169 | 68791 | 125.33 | 1728 | 1792 | 534.6 |
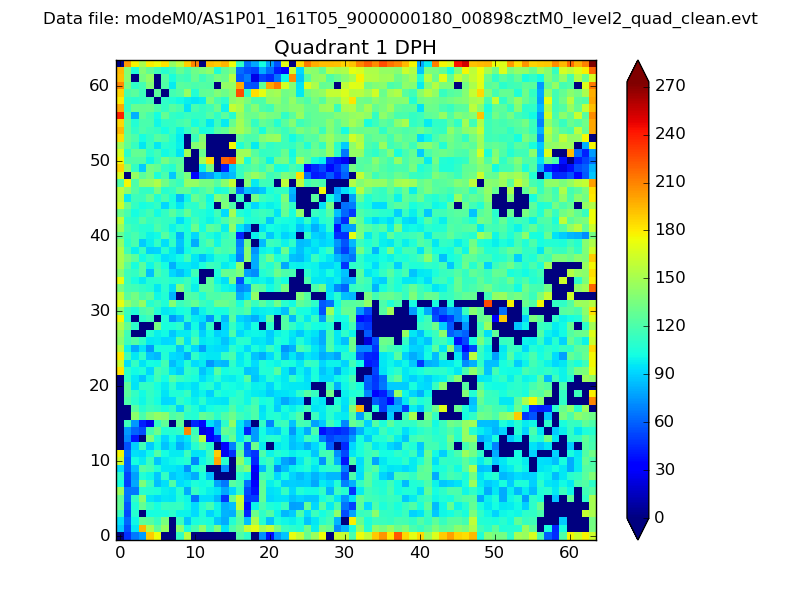
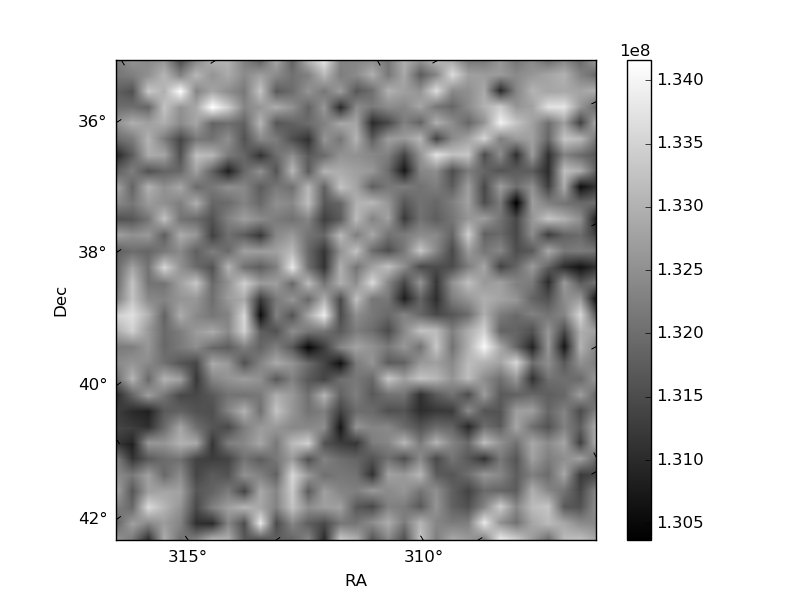
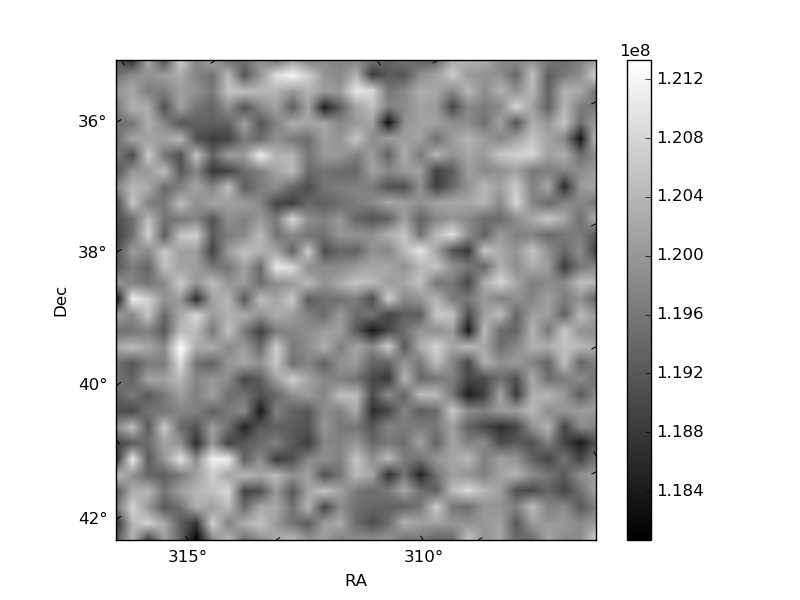
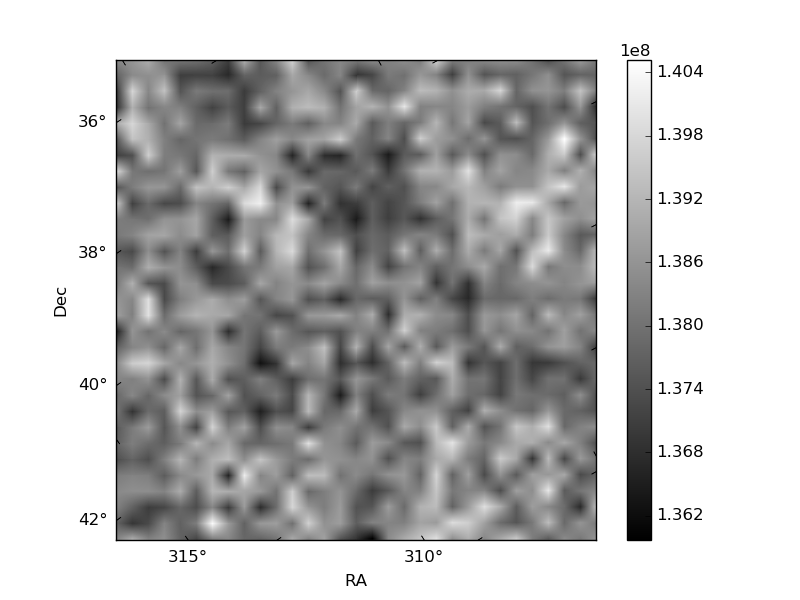
Histogram calculated using DETX and DETY for each event in the final _common_clean file
| Quadrant A |  |
 |
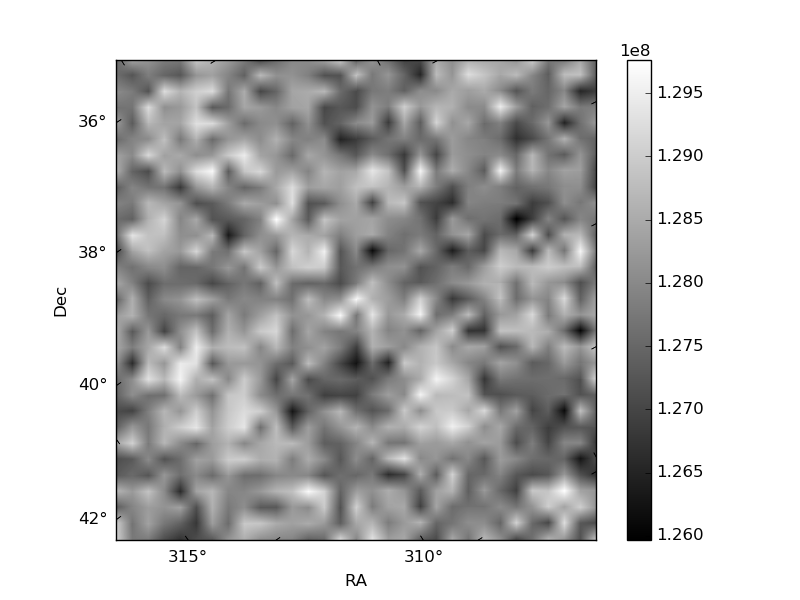
Quadrant B |
|---|---|---|---|
| Quadrant D | 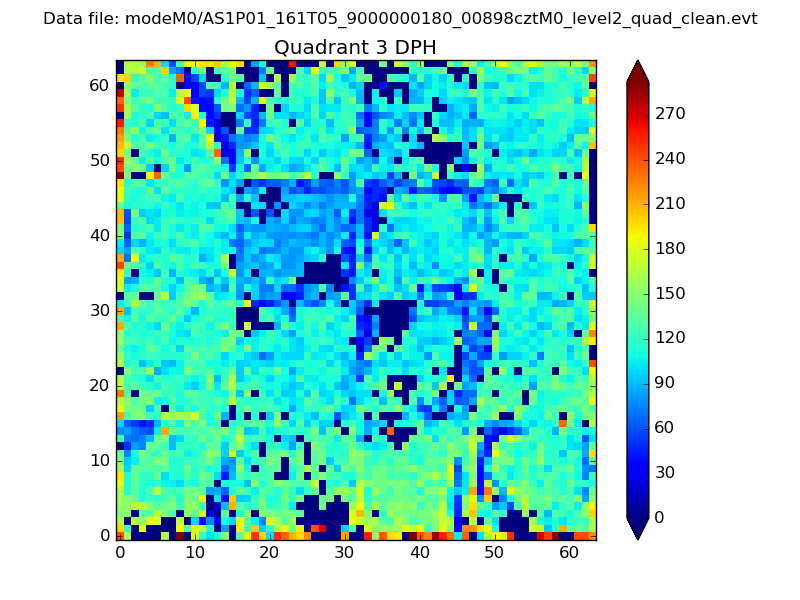 |
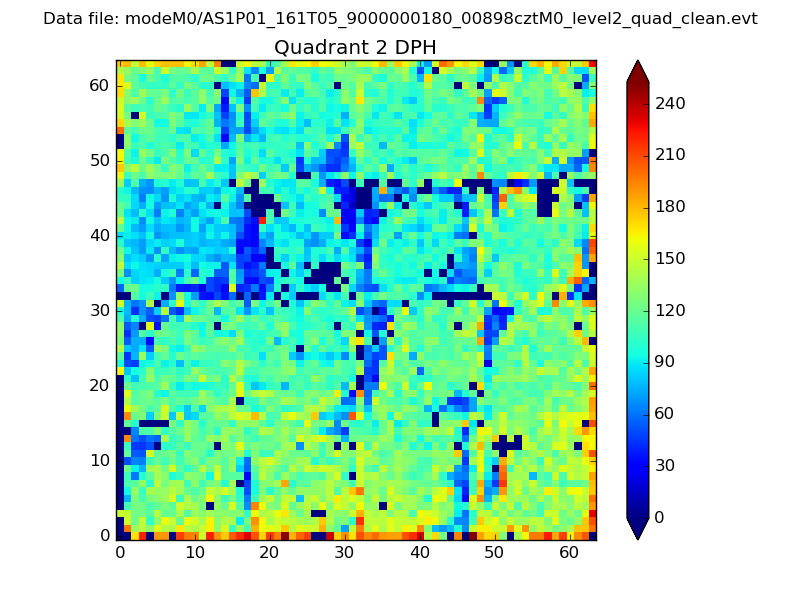 |
Quadrant C |
| Plot type | Count rate plots | Images |
|---|---|---|
| Comparison with Poisson distribution Blue bars denote a histogram of data divided into 1 sec bins. Red curve is a Poisson curve with rate = median count rate of data. |
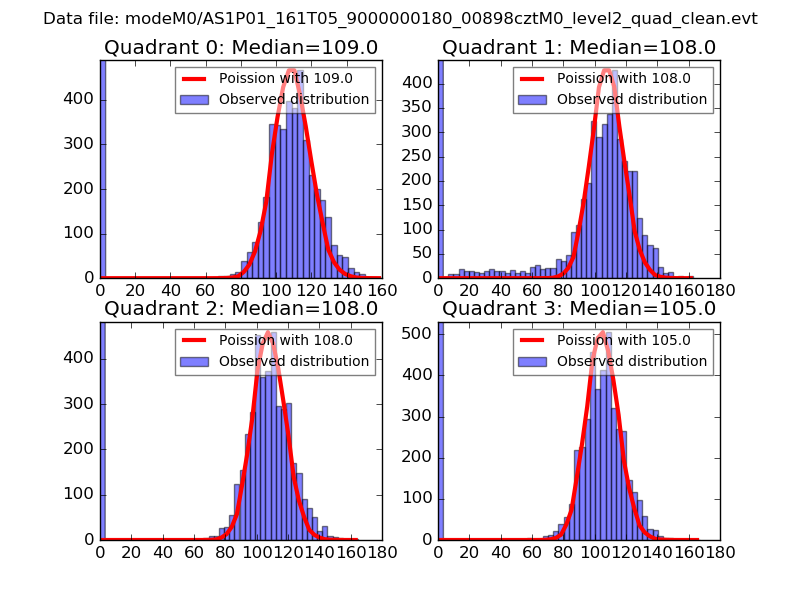 |
 |
| Quadrant-wise count rates Data is divided into 100 sec bins |
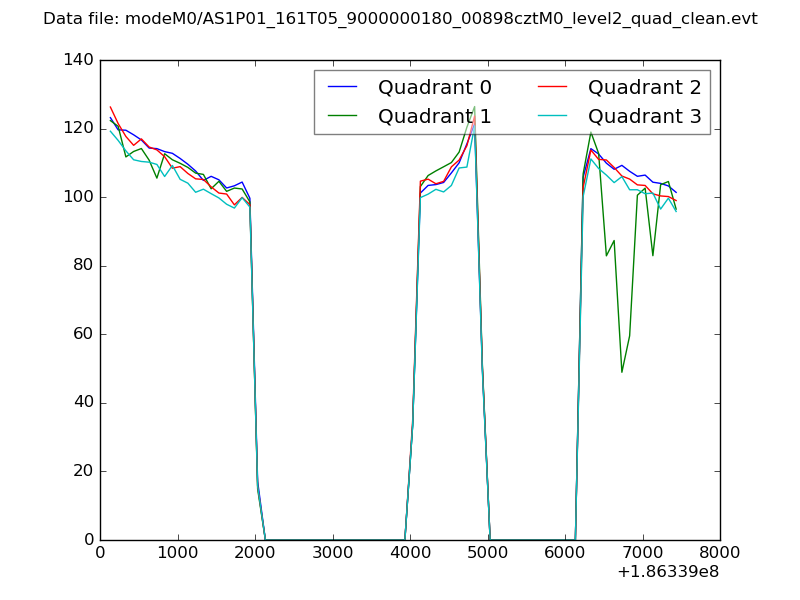 |
|
| Module-wise count rates for Quadrant A Data is divided into 100 sec bins |
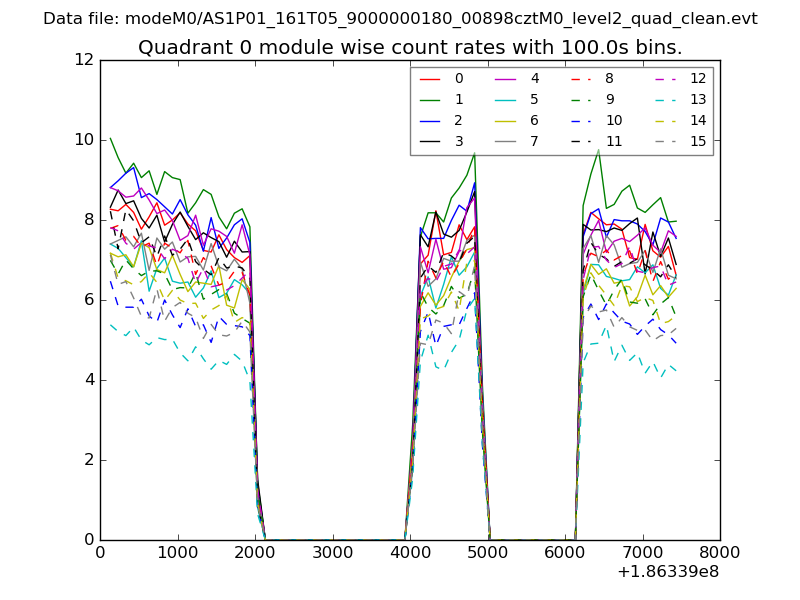 |
 |
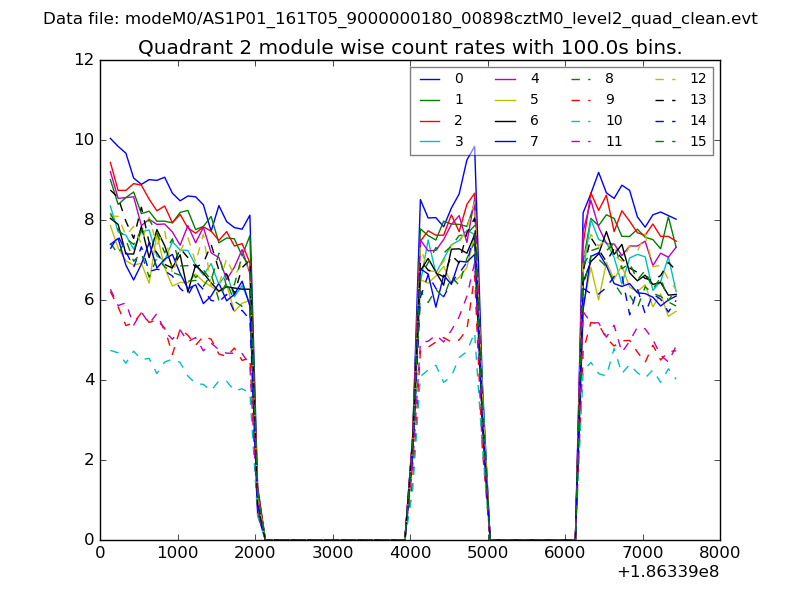
| Module-wise count rates for Quadrant B Data is divided into 100 sec bins |
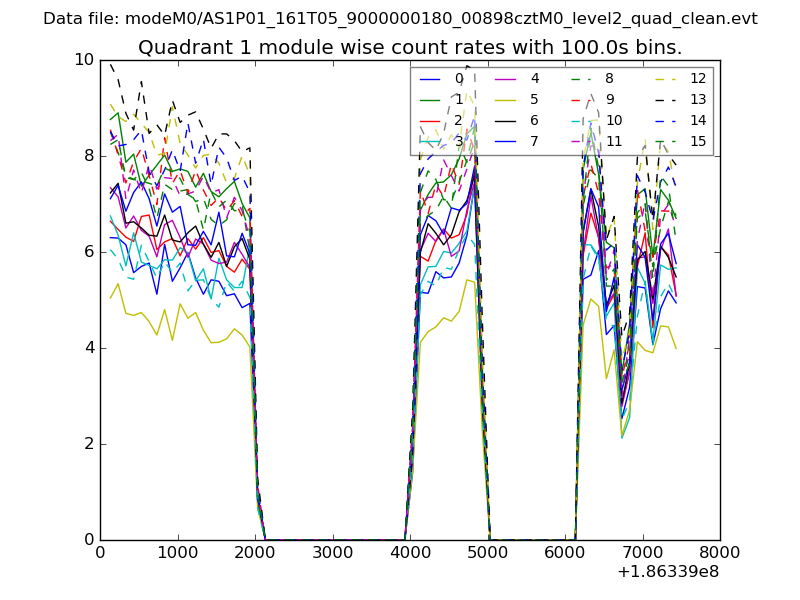 |
 |
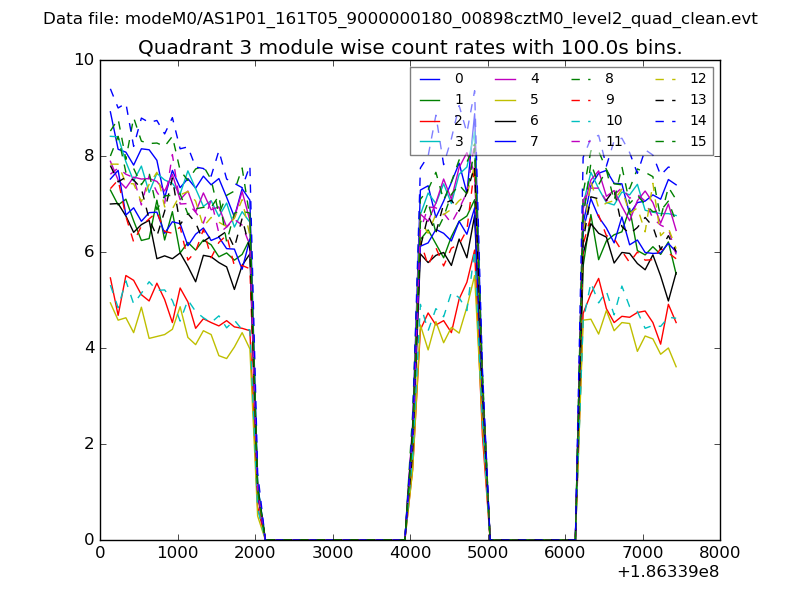
| Module-wise count rates for Quadrant C Data is divided into 100 sec bins |
 |
 |
| Module-wise count rates for Quadrant D Data is divided into 100 sec bins |
 |
 |
| Parameter | Plot |
|---|---|
| CZT HV Monitor | 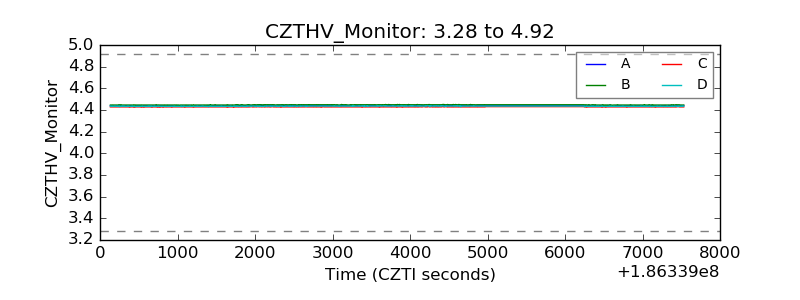 |
| D_VDD | 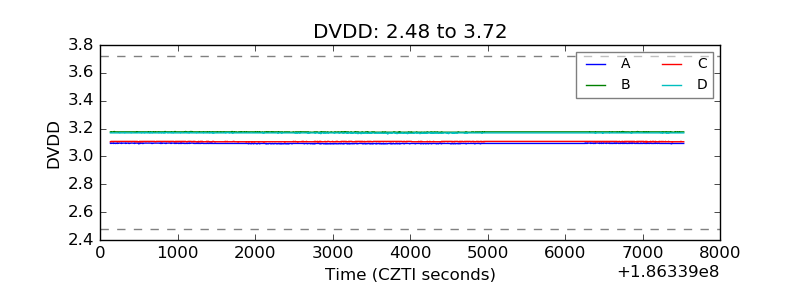 |
| Temperature 1 | 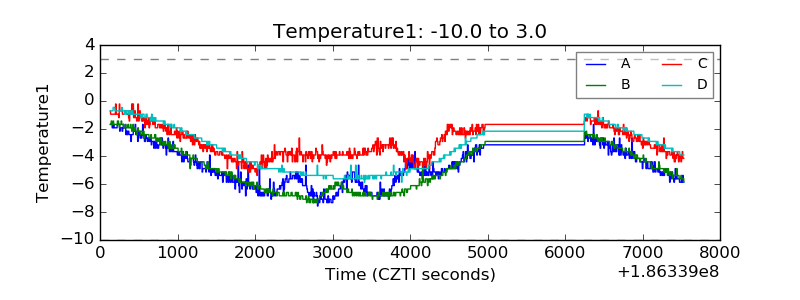 |
| Veto HV Monitor | 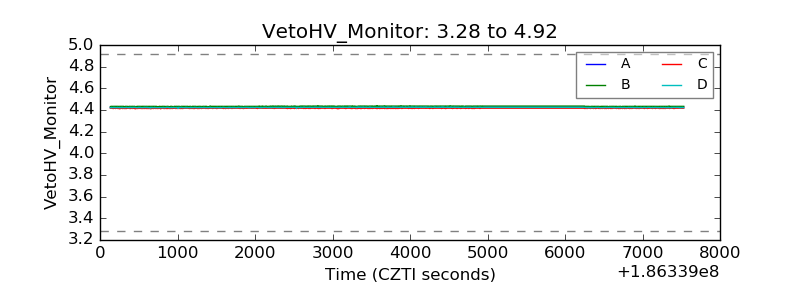 |
| Veto LLD |  |
| Alpha Counter | 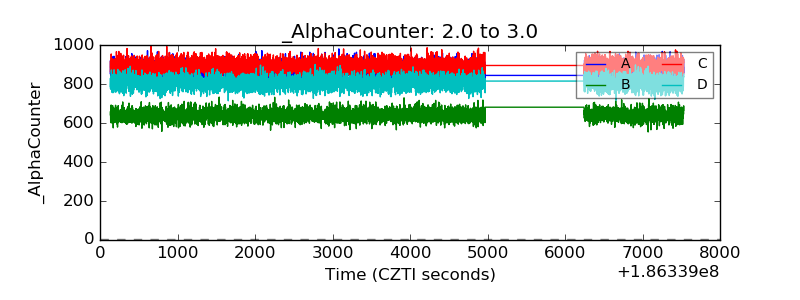 |
| _CPM_Rate | 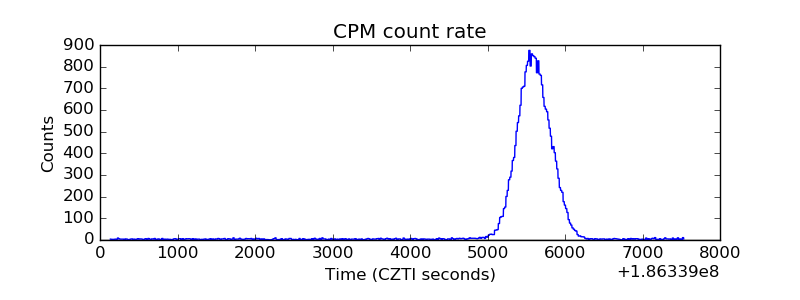 |
| CZT Counter | 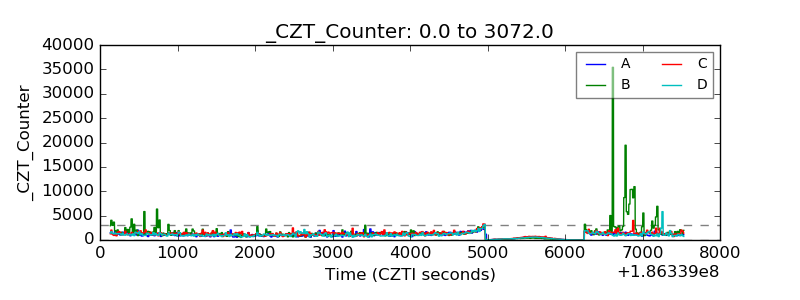 |
| +2.5 Volts monitor |  |
| +5 Volts monitor |  |
| _ROLL_ROT | 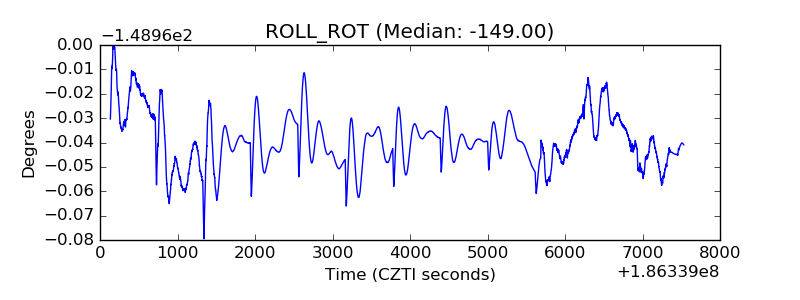 |
| _Roll_DEC | 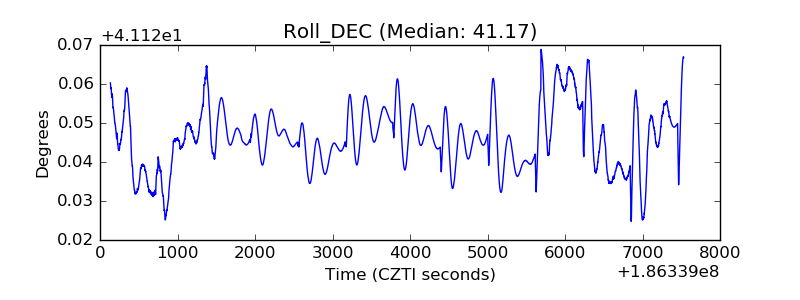 |
| _Roll_RA | 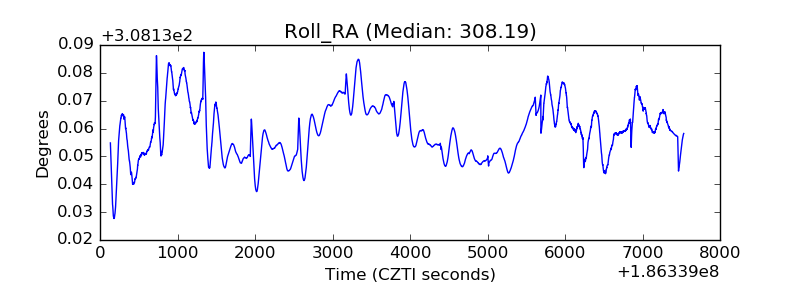 |
| Veto Counter | 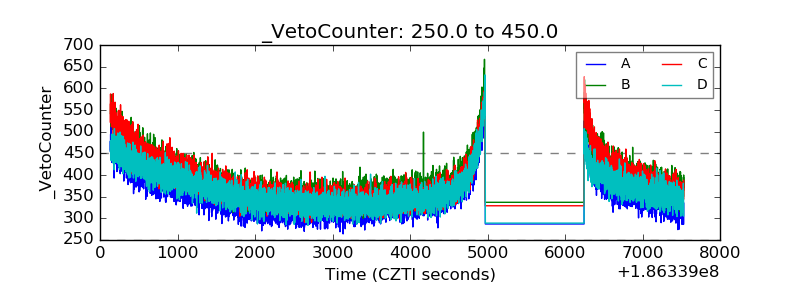 |