| Param | Original file | Final file |
|---|---|---|
| Filename | modeM0/AS1P01_161T05_9000000180_00899cztM0_level2.evt | modeM0/AS1P01_161T05_9000000180_00899cztM0_level2_quad_clean.evt |
| Size (bytes) | 1,093,821,120 | 65,787,840 |
| Size | 1.0 GB | 62.7 MB |
| Events in quadrant A | 7,237,236 | 414,526 |
| Events in quadrant B | 10,610,664 | 342,981 |
| Events in quadrant C | 8,293,396 | 408,689 |
| Events in quadrant D | 6,582,143 | 399,896 |
| Mode M9 | |||
|---|---|---|---|
| Quadrant | BADHDUFLAG | Total packets | Discarded packets |
| A | 0 | 11 | 0 |
| B | 0 | 11 | 0 |
| C | 0 | 11 | 0 |
| D | 0 | 11 | 0 |
| Mode SS | |||
|---|---|---|---|
| Quadrant | BADHDUFLAG | Total packets | Discarded packets |
| A | 0 | 124 | 0 |
| B | 0 | 124 | 0 |
| C | 0 | 124 | 0 |
| D | 0 | 124 | 0 |
| Mode M0 | |||
|---|---|---|---|
| Quadrant | BADHDUFLAG | Total packets | Discarded packets |
| A | 0 | 25836 | 0 |
| B | 0 | 35996 | 0 |
| C | 0 | 28945 | 0 |
| D | 0 | 23865 | 0 |
| Quadrant | Total seconds | Saturated seconds | Saturation percentage |
|---|---|---|---|
| A | 6089 | 4 | 0.065692% |
| B | 6090 | 1145 | 18.801314% |
| C | 6090 | 40 | 0.656814% |
| D | 6090 | 14 | 0.229885% |
Noise dominated data is calculated using 1-second bins in cleaned event files. If a bin has >2000 counts, and if more than 50% of those come from <1% of pixels, then it is considered to be noise-dominated and hence unusable.
| Quadrant | # 1 sec bins | Bins with >0 counts | Bins with >2000 counts | High rate bins dominated by noise | Noise dominated (total time) | Noise dominated (detector-on time) | Marked lightcurve |
|---|---|---|---|---|---|---|---|
| A | 7169 | 6090 | 168 | 168 | 2.34% | 2.76% | 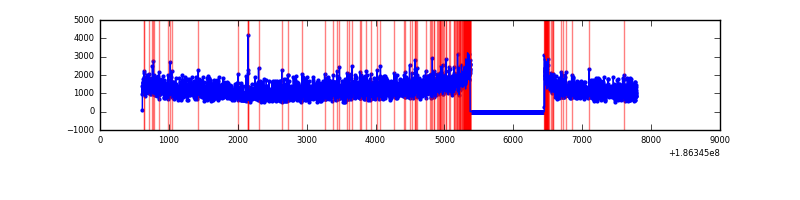 |
| B | 7170 | 6091 | 1739 | 1739 | 24.25% | 28.55% |  |
| C | 7170 | 6091 | 397 | 397 | 5.54% | 6.52% | 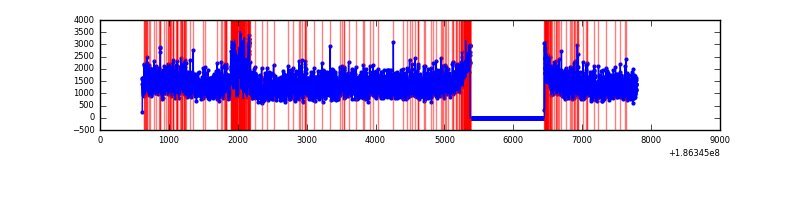 |
| D | 7170 | 6091 | 115 | 115 | 1.60% | 1.89% |  |
Top three noisy pixels from each quadrant. If the there are fewer than three noisy pixels in the level2.evt file, extra rows are filled as -1
| Pixel properties | Quadrant properties | ||||||
|---|---|---|---|---|---|---|---|
| Quadrant | DetID | PixID | Counts | Sigma | Mean | Median | Sigma |
| A | 15 | 127 | 209441 | 475.5 | 1810 | 1825 | 436.6 |
| A | 14 | 170 | 68699 | 153.16 | 1810 | 1825 | 436.6 |
| A | 15 | 233 | 12525 | 24.5 | 1810 | 1825 | 436.6 |
| B | 3 | 0 | 3956706 | 9911.37 | 1699 | 1708 | 399.0 |
| B | 0 | 220 | 62375 | 152.03 | 1699 | 1708 | 399.0 |
| B | 5 | 191 | 51098 | 123.77 | 1699 | 1708 | 399.0 |
| C | 9 | 83 | 1347859 | 2760.64 | 1762 | 1831 | 487.6 |
| C | 15 | 241 | 22514 | 42.42 | 1762 | 1831 | 487.6 |
| C | 3 | 111 | 21053 | 39.42 | 1762 | 1831 | 487.6 |
| D | 1 | 4 | 134235 | 252.67 | 1689 | 1745 | 524.4 |
| D | 13 | 169 | 55411 | 102.35 | 1689 | 1745 | 524.4 |
| D | 7 | 207 | 38386 | 69.88 | 1689 | 1745 | 524.4 |
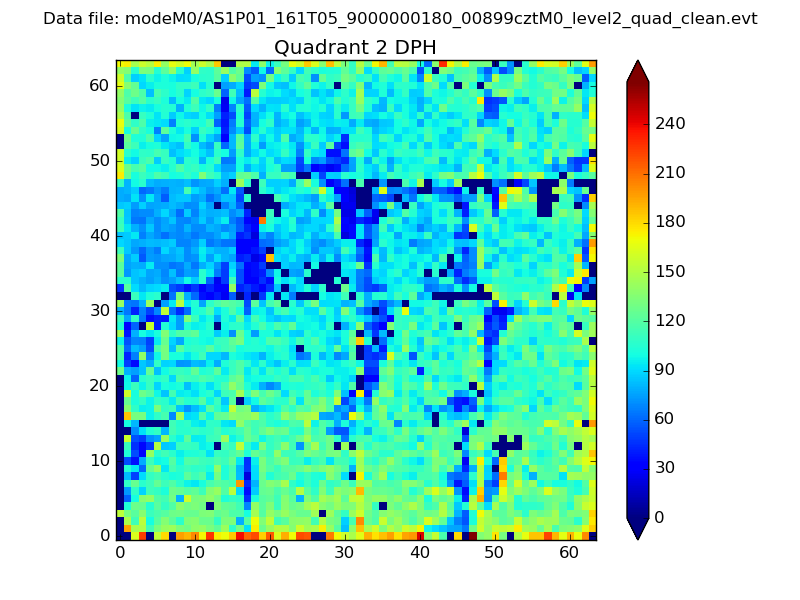
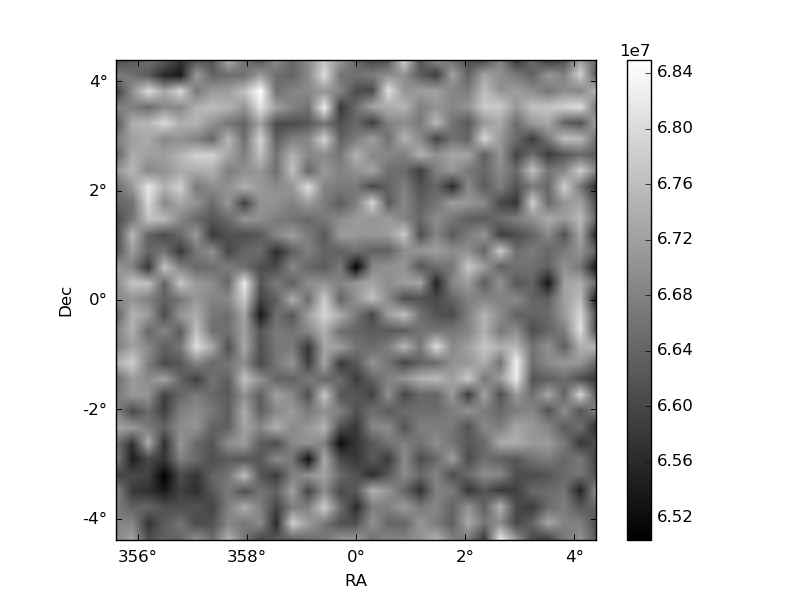
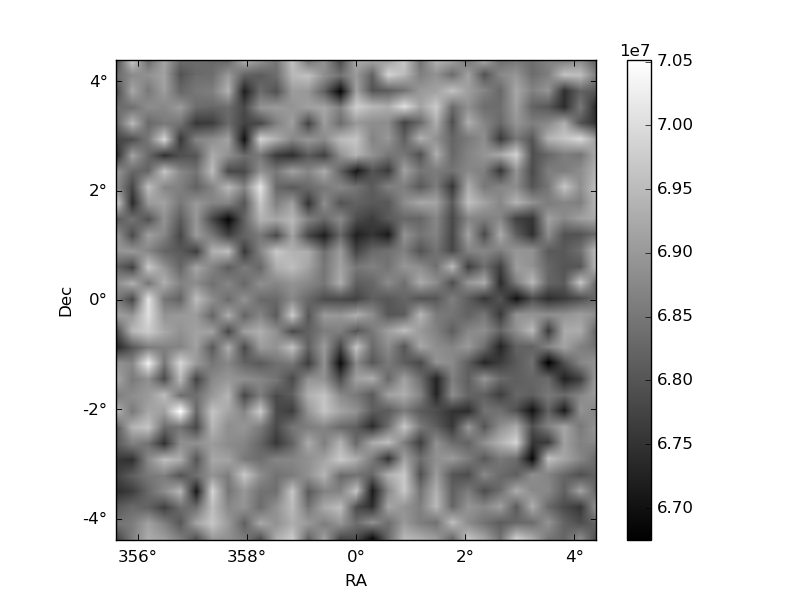
Histogram calculated using DETX and DETY for each event in the final _common_clean file
| Quadrant A | 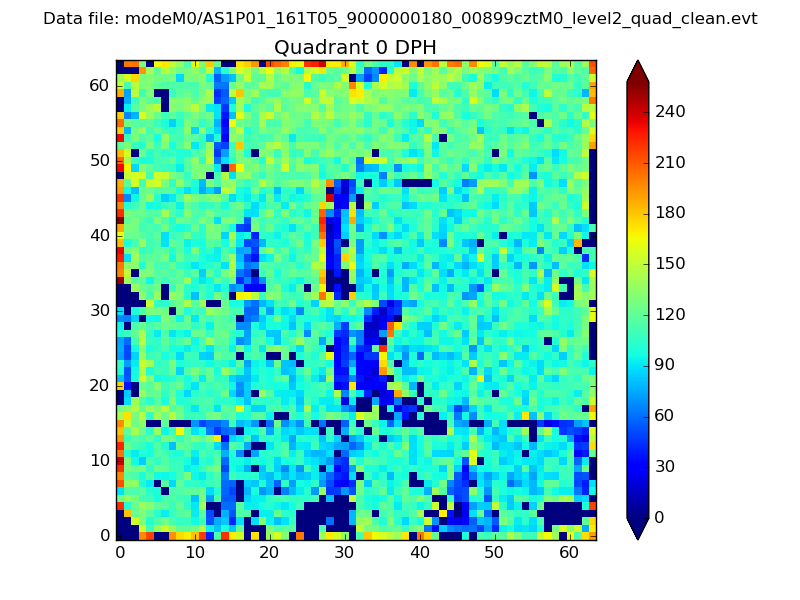 |
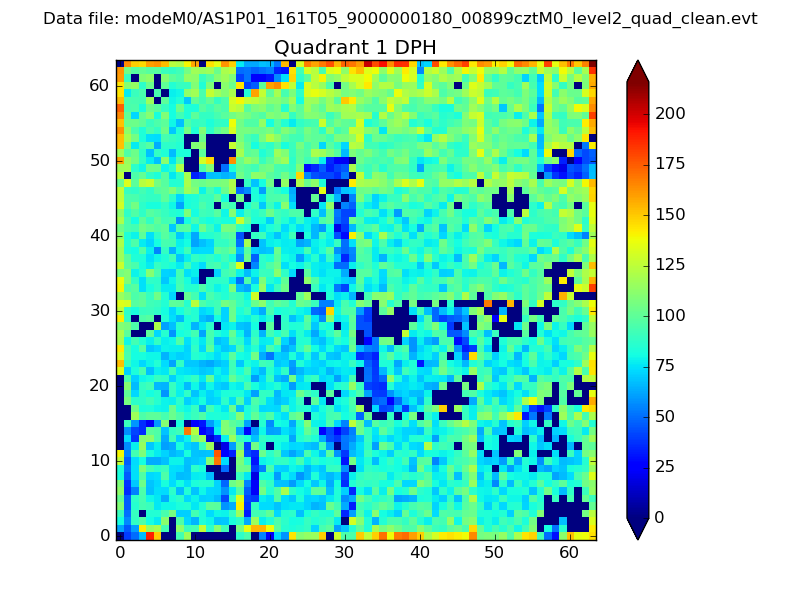 |
Quadrant B |
|---|---|---|---|
| Quadrant D | 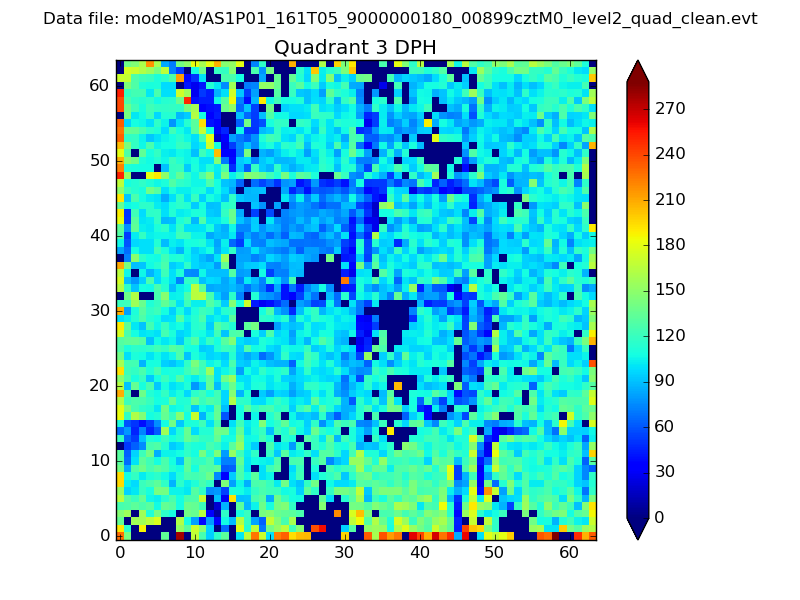 |
 |
Quadrant C |
| Plot type | Count rate plots | Images |
|---|---|---|
| Comparison with Poisson distribution Blue bars denote a histogram of data divided into 1 sec bins. Red curve is a Poisson curve with rate = median count rate of data. |
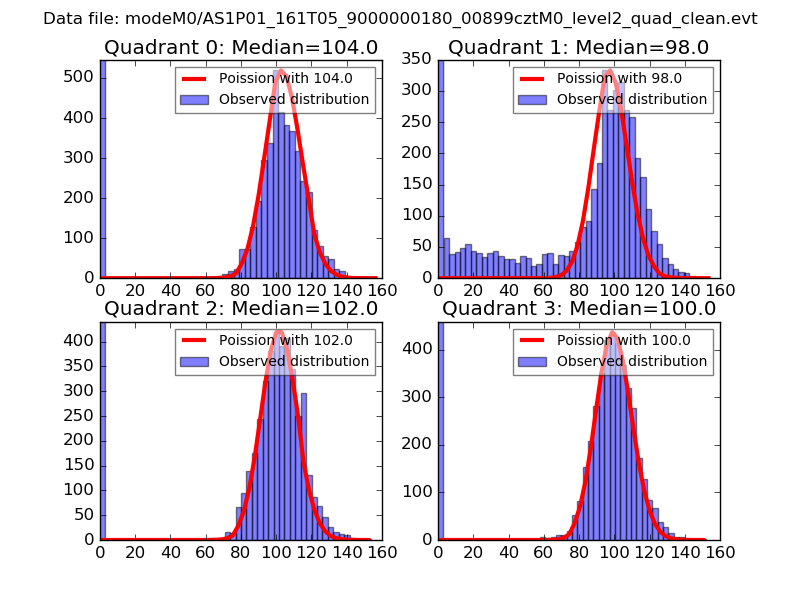 |
 |
| Quadrant-wise count rates Data is divided into 100 sec bins |
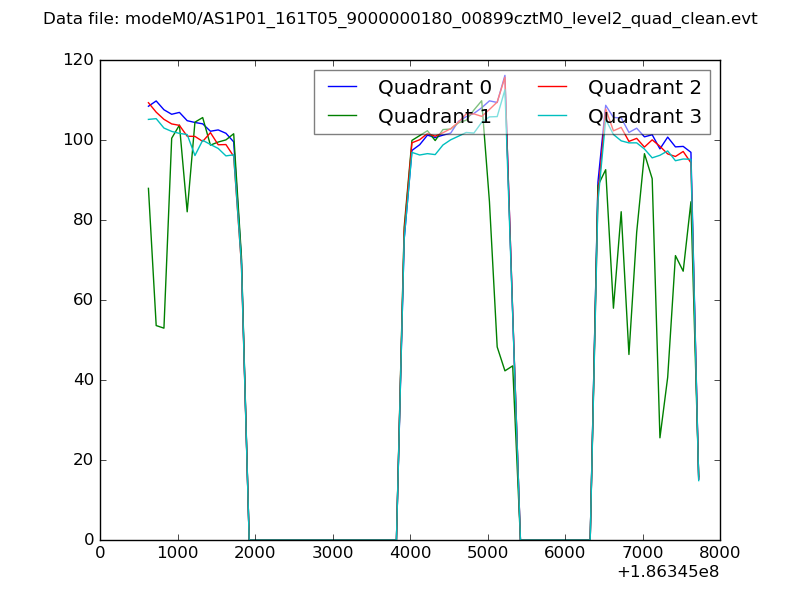 |
|
| Module-wise count rates for Quadrant A Data is divided into 100 sec bins |
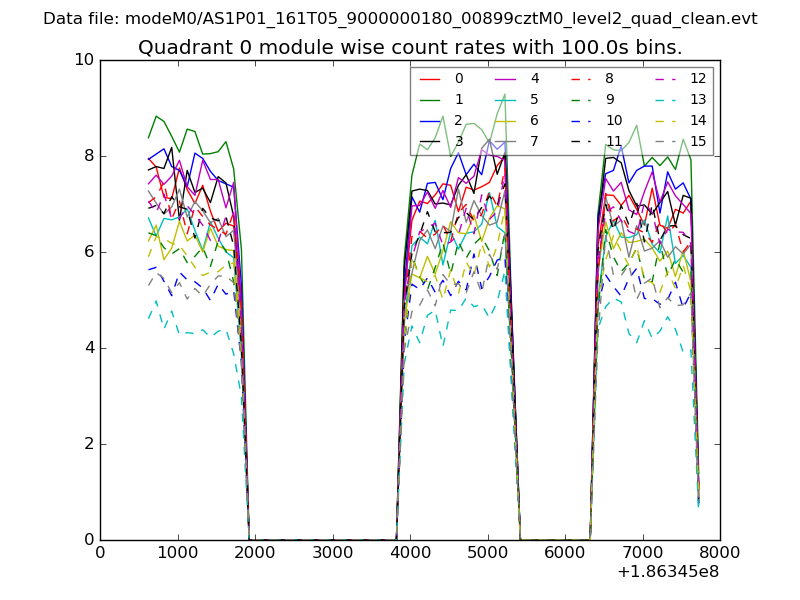 |
 |
| Module-wise count rates for Quadrant B Data is divided into 100 sec bins |
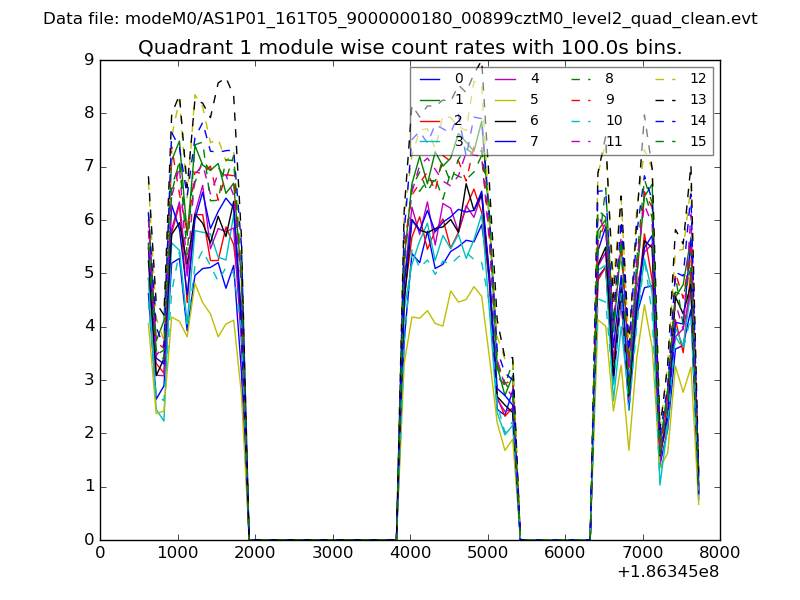 |
 |
| Module-wise count rates for Quadrant C Data is divided into 100 sec bins |
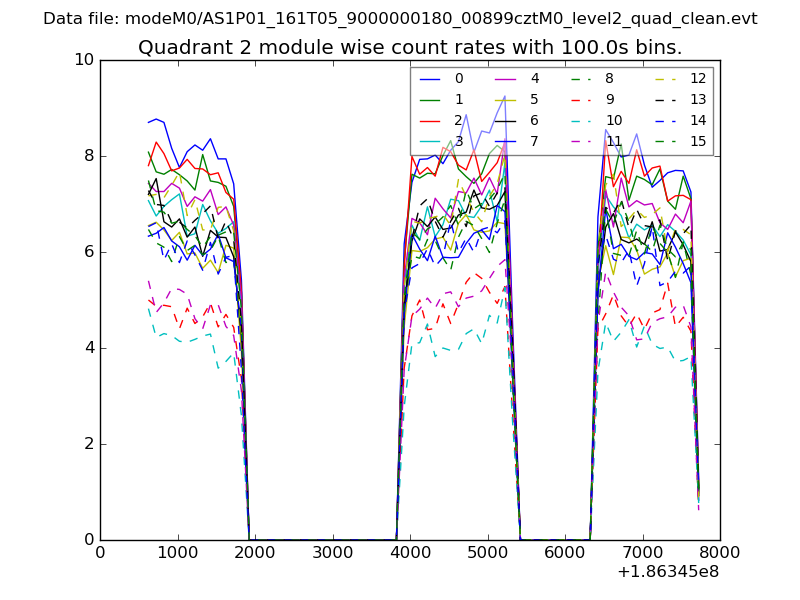 |
 |
| Module-wise count rates for Quadrant D Data is divided into 100 sec bins |
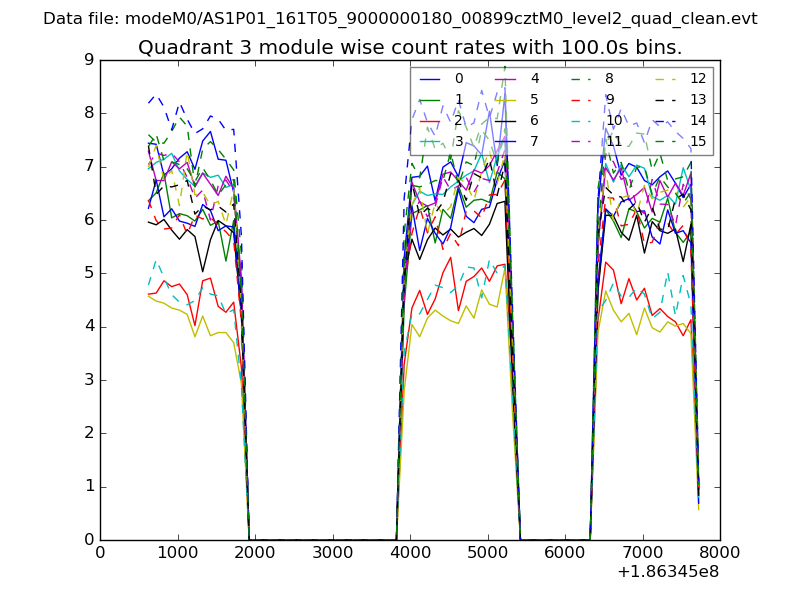 |
 |
| Parameter | Plot |
|---|---|
| CZT HV Monitor | 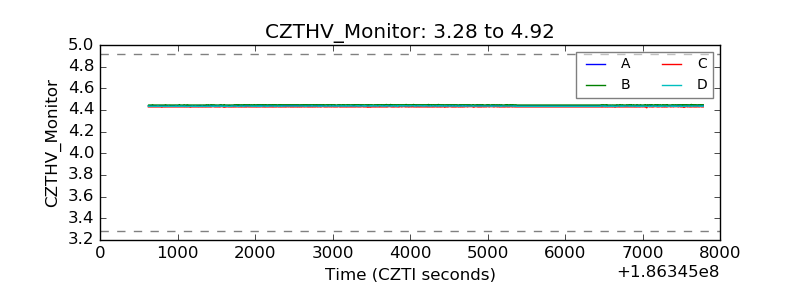 |
| D_VDD | 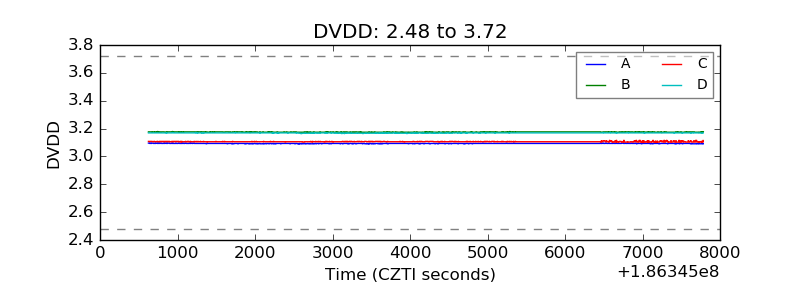 |
| Temperature 1 | 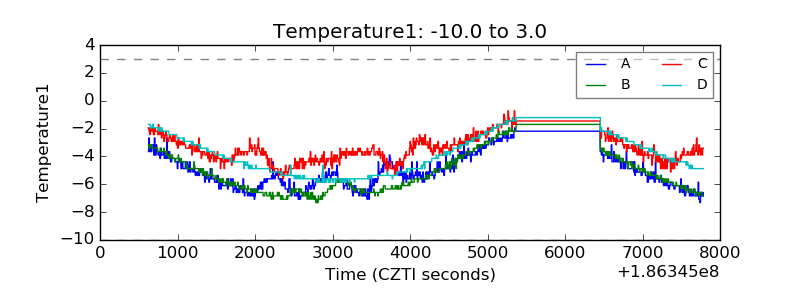 |
| Veto HV Monitor | 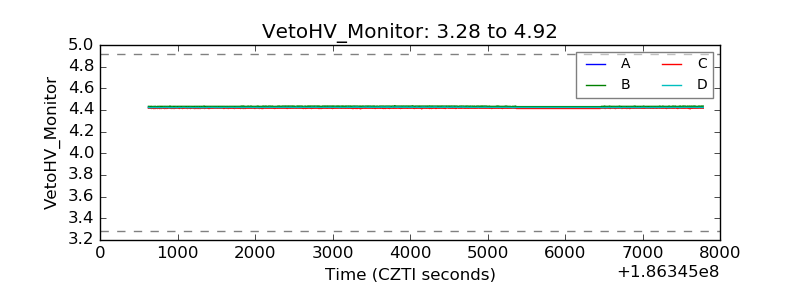 |
| Veto LLD | 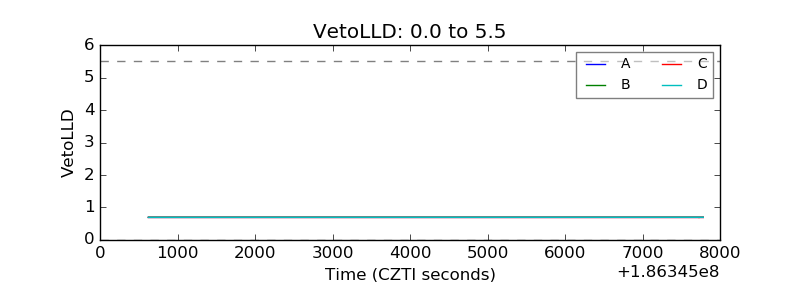 |
| Alpha Counter | 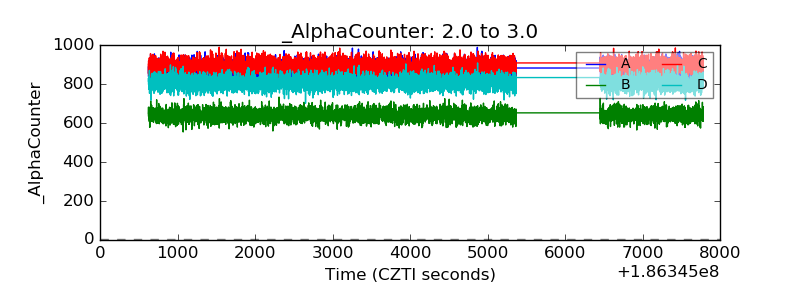 |
| _CPM_Rate | 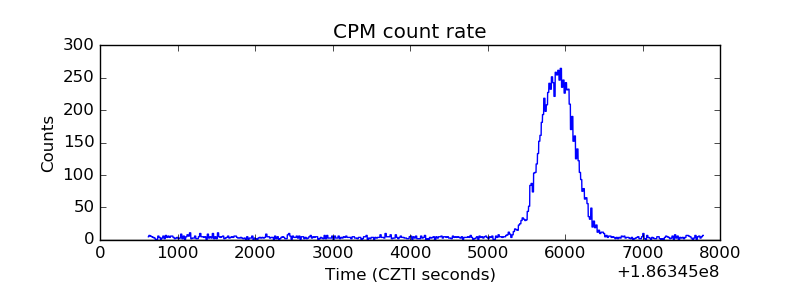 |
| CZT Counter | 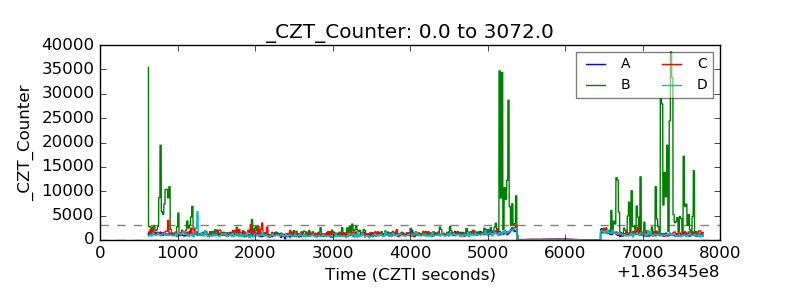 |
| +2.5 Volts monitor | 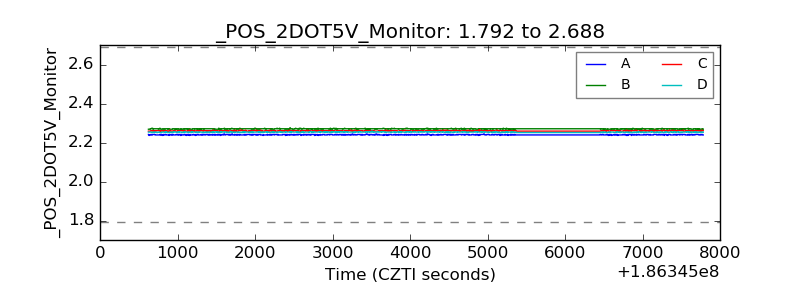 |
| +5 Volts monitor |  |
| _ROLL_ROT | 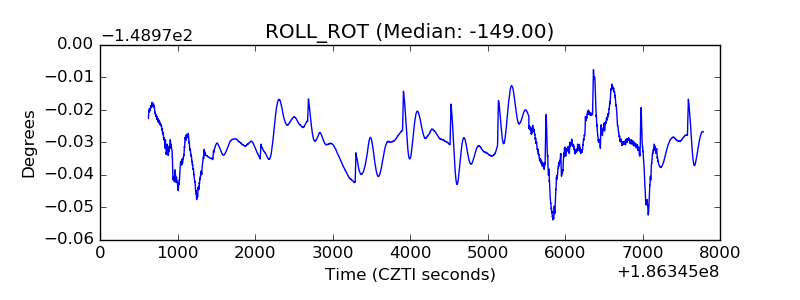 |
| _Roll_DEC | 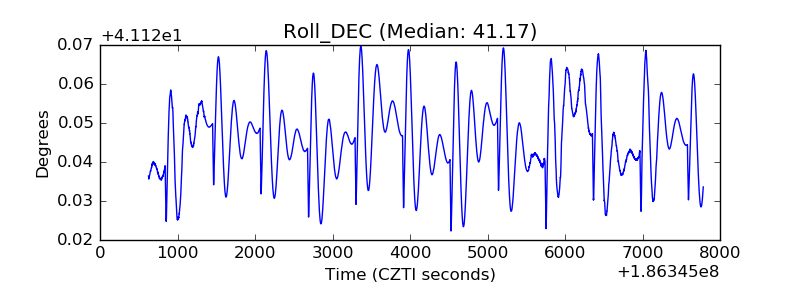 |
| _Roll_RA | 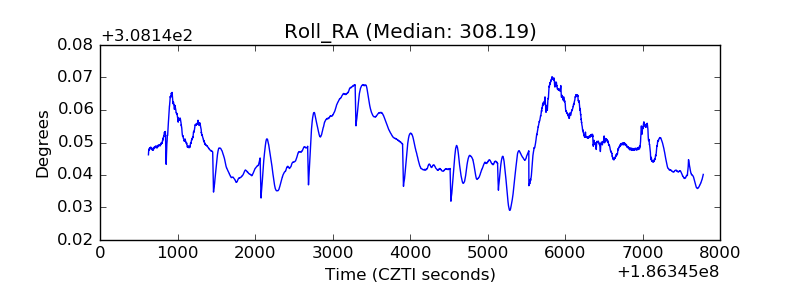 |
| Veto Counter | 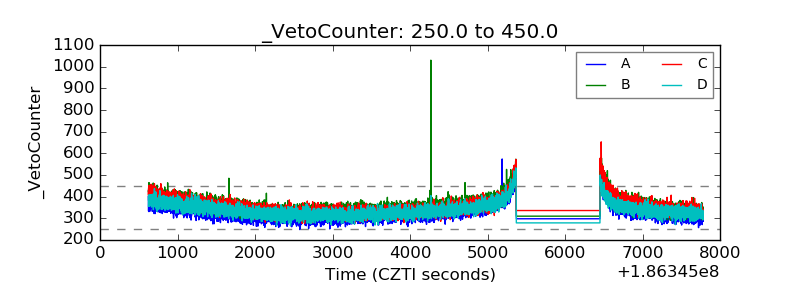 |