| Param | Original file | Final file |
|---|---|---|
| Filename | modeM0/AS1P01_161T05_9000000180_00900cztM0_level2.evt | modeM0/AS1P01_161T05_9000000180_00900cztM0_level2_quad_clean.evt |
| Size (bytes) | 1,301,296,320 | 72,959,040 |
| Size | 1.2 GB | 69.6 MB |
| Events in quadrant A | 8,567,643 | 452,623 |
| Events in quadrant B | 12,664,597 | 381,267 |
| Events in quadrant C | 9,465,985 | 444,281 |
| Events in quadrant D | 8,229,452 | 422,602 |
| Mode M9 | |||
|---|---|---|---|
| Quadrant | BADHDUFLAG | Total packets | Discarded packets |
| A | 0 | 9 | 0 |
| B | 0 | 9 | 0 |
| C | 0 | 9 | 0 |
| D | 0 | 9 | 0 |
| Mode SS | |||
|---|---|---|---|
| Quadrant | BADHDUFLAG | Total packets | Discarded packets |
| A | 0 | 148 | 0 |
| B | 0 | 148 | 0 |
| C | 0 | 148 | 0 |
| D | 0 | 148 | 0 |
| Mode M0 | |||
|---|---|---|---|
| Quadrant | BADHDUFLAG | Total packets | Discarded packets |
| A | 0 | 30625 | 0 |
| B | 0 | 42977 | 0 |
| C | 0 | 33301 | 0 |
| D | 0 | 29661 | 0 |
| Quadrant | Total seconds | Saturated seconds | Saturation percentage |
|---|---|---|---|
| A | 7292 | 7 | 0.095996% |
| B | 7292 | 1397 | 19.157981% |
| C | 7291 | 17 | 0.233164% |
| D | 7291 | 189 | 2.592237% |
Noise dominated data is calculated using 1-second bins in cleaned event files. If a bin has >2000 counts, and if more than 50% of those come from <1% of pixels, then it is considered to be noise-dominated and hence unusable.
| Quadrant | # 1 sec bins | Bins with >0 counts | Bins with >2000 counts | High rate bins dominated by noise | Noise dominated (total time) | Noise dominated (detector-on time) | Marked lightcurve |
|---|---|---|---|---|---|---|---|
| A | 7972 | 7295 | 214 | 214 | 2.68% | 2.93% | 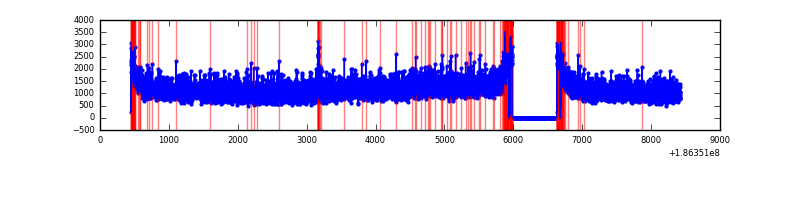 |
| B | 7972 | 7294 | 2050 | 2050 | 25.72% | 28.11% | 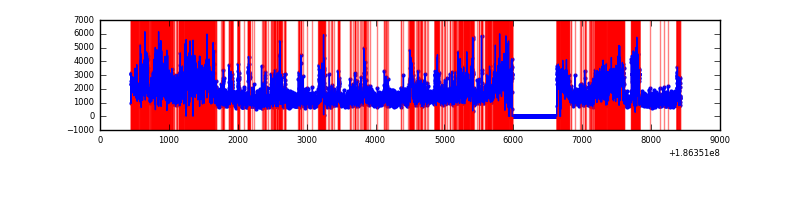 |
| C | 7971 | 7294 | 329 | 329 | 4.13% | 4.51% | 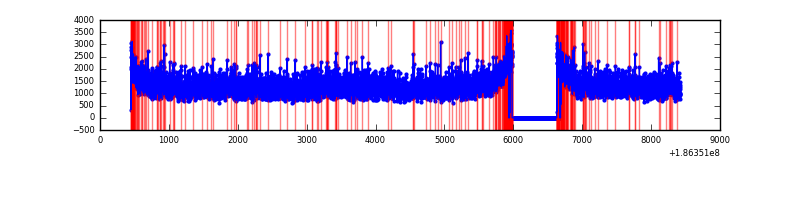 |
| D | 7971 | 7294 | 329 | 329 | 4.13% | 4.51% | 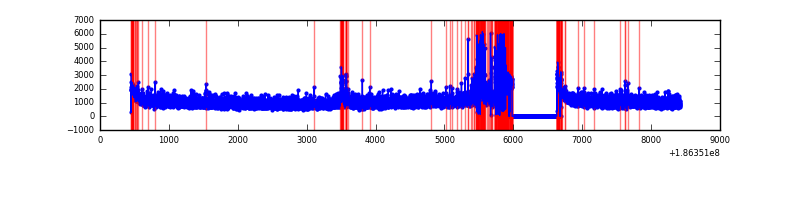 |
Top three noisy pixels from each quadrant. If the there are fewer than three noisy pixels in the level2.evt file, extra rows are filled as -1
| Pixel properties | Quadrant properties | ||||||
|---|---|---|---|---|---|---|---|
| Quadrant | DetID | PixID | Counts | Sigma | Mean | Median | Sigma |
| A | 15 | 127 | 110692 | 206.56 | 2191 | 2211 | 525.2 |
| A | 14 | 170 | 27864 | 48.85 | 2191 | 2211 | 525.2 |
| A | 15 | 233 | 26554 | 46.35 | 2191 | 2211 | 525.2 |
| B | 3 | 0 | 4525787 | 9332.08 | 2071 | 2084 | 484.7 |
| B | 0 | 220 | 90862 | 183.14 | 2071 | 2084 | 484.7 |
| B | 15 | 22 | 59744 | 118.95 | 2071 | 2084 | 484.7 |
| C | 9 | 83 | 1074080 | 1818.48 | 2126 | 2209 | 589.4 |
| C | 3 | 111 | 27980 | 43.72 | 2126 | 2209 | 589.4 |
| C | 15 | 241 | 25316 | 39.2 | 2126 | 2209 | 589.4 |
| D | 2 | 16 | 126780 | 202.28 | 2091 | 2113 | 616.3 |
| D | 1 | 4 | 48586 | 75.4 | 2091 | 2113 | 616.3 |
| D | 13 | 169 | 46519 | 72.05 | 2091 | 2113 | 616.3 |
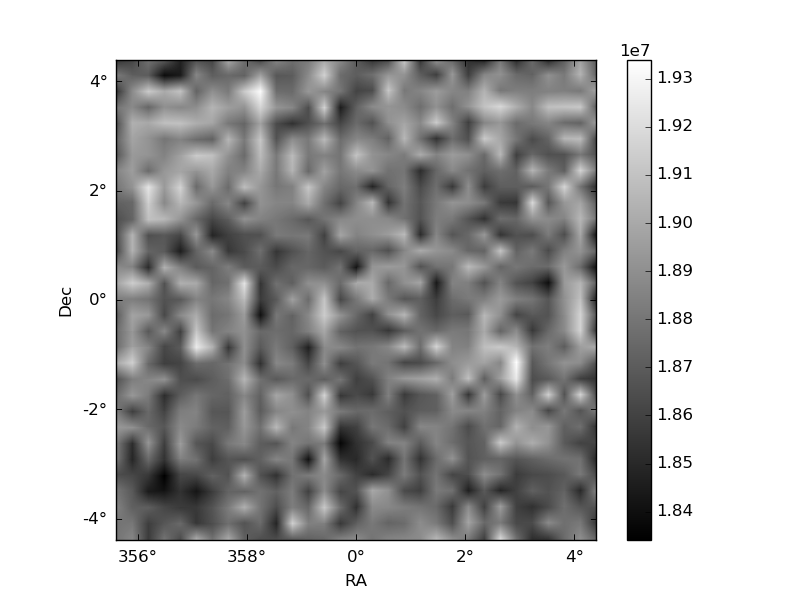
Histogram calculated using DETX and DETY for each event in the final _common_clean file
| Quadrant A |  |
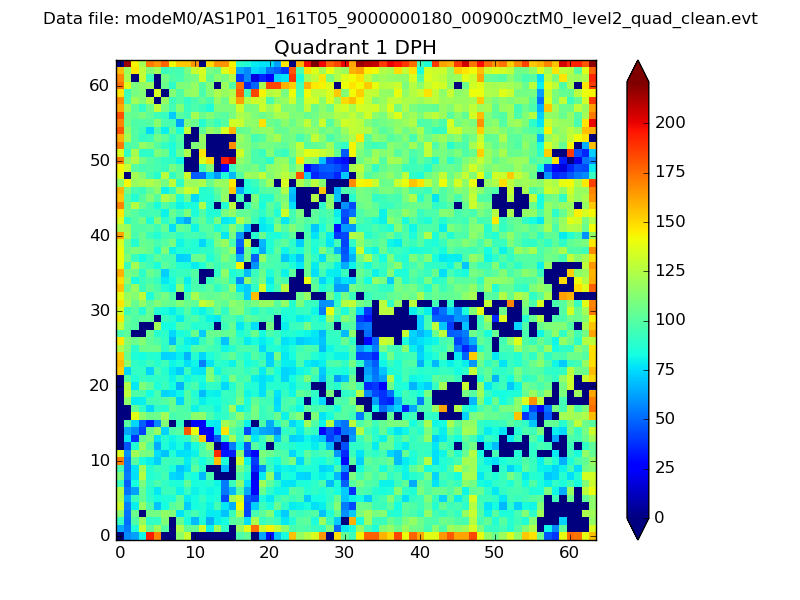 |
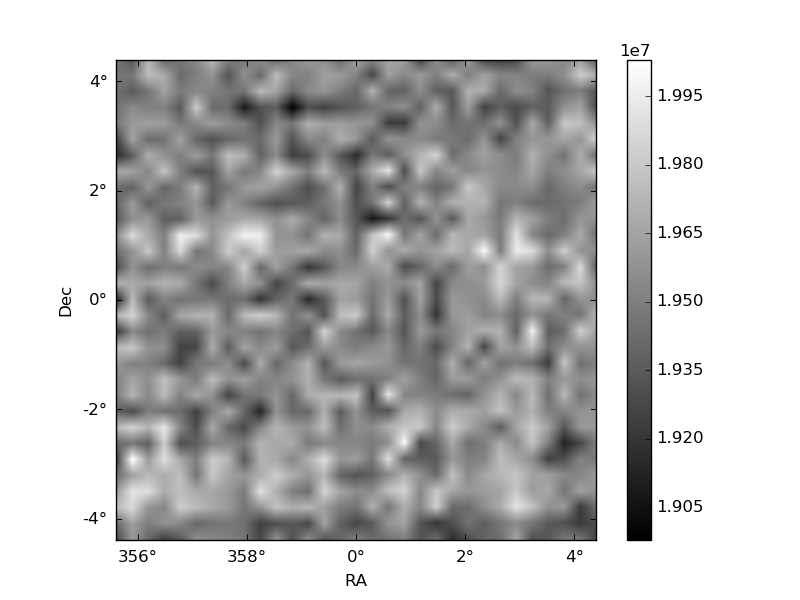
Quadrant B |
|---|---|---|---|
| Quadrant D |  |
 |
Quadrant C |
| Plot type | Count rate plots | Images |
|---|---|---|
| Comparison with Poisson distribution Blue bars denote a histogram of data divided into 1 sec bins. Red curve is a Poisson curve with rate = median count rate of data. |
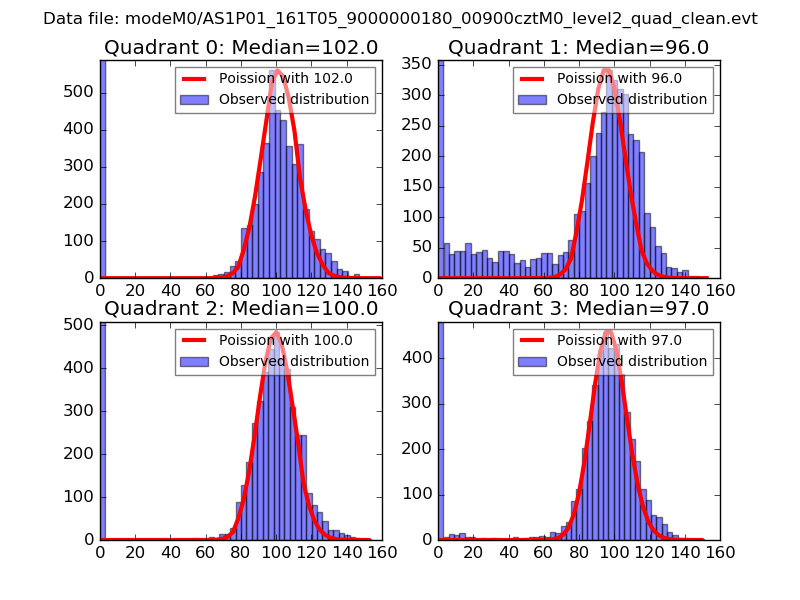 |
 |
| Quadrant-wise count rates Data is divided into 100 sec bins |
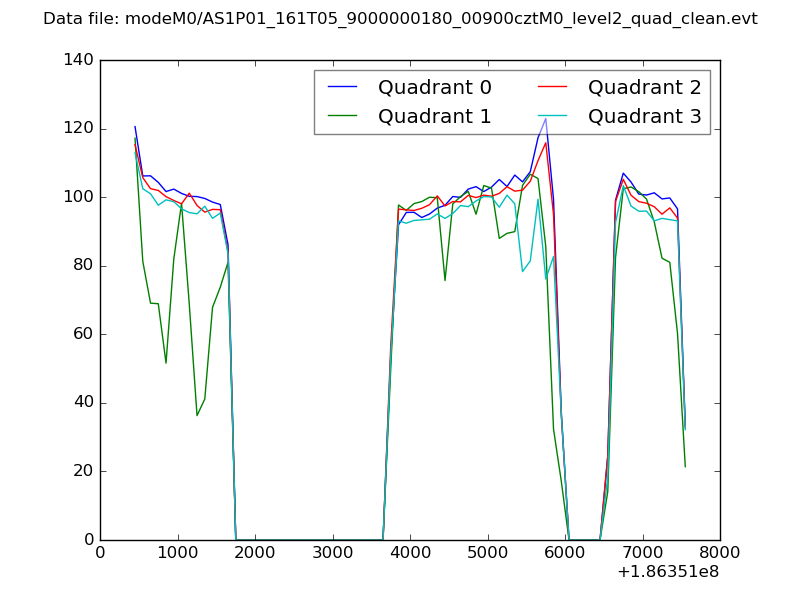 |
|
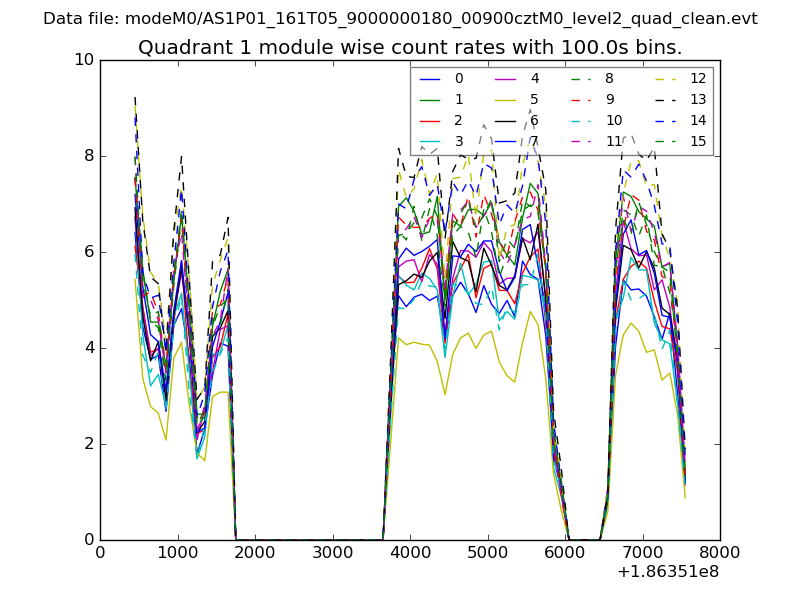
| Module-wise count rates for Quadrant A Data is divided into 100 sec bins |
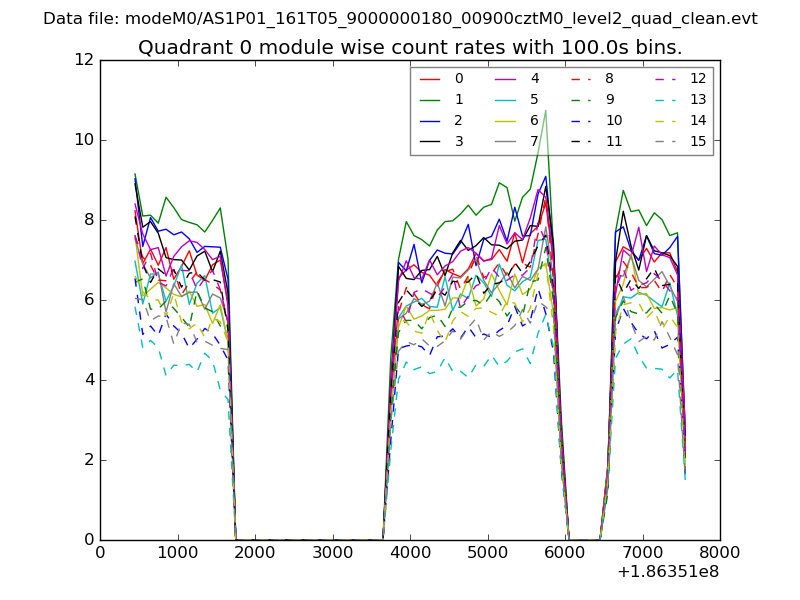 |
 |
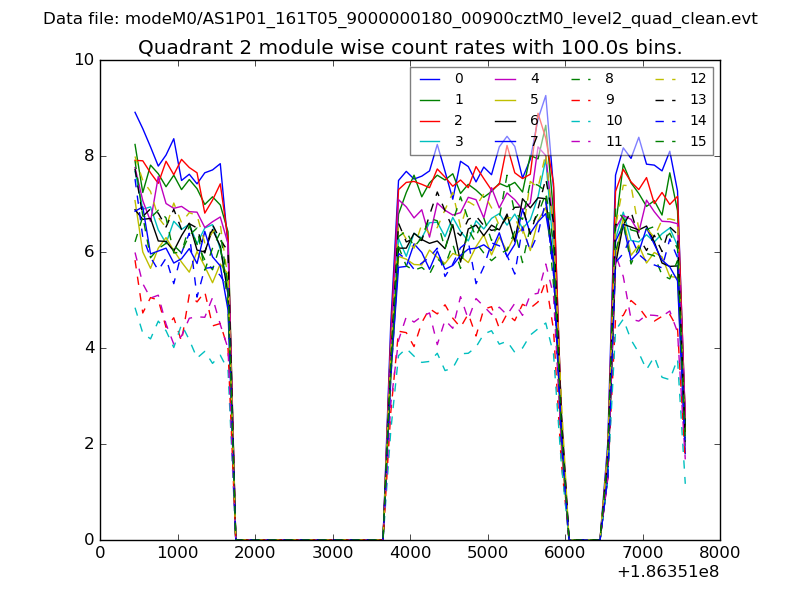
| Module-wise count rates for Quadrant B Data is divided into 100 sec bins |
 |
 |
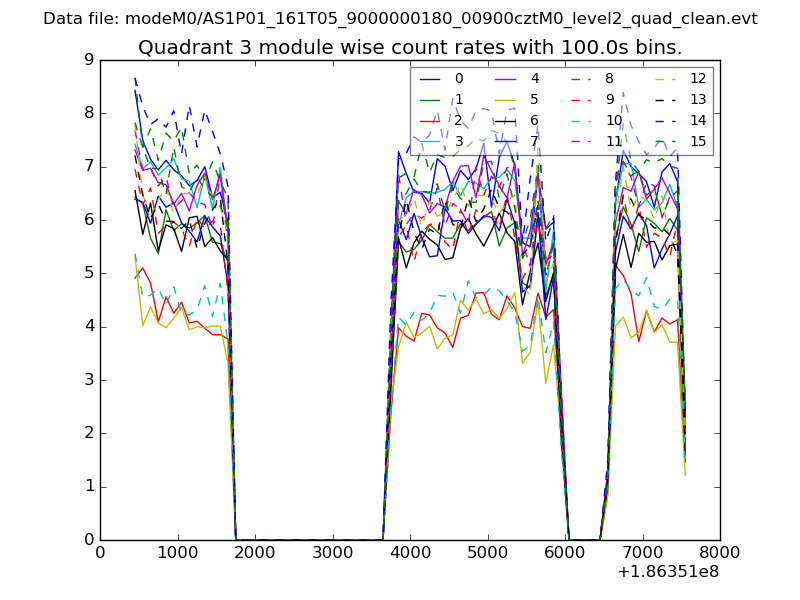
| Module-wise count rates for Quadrant C Data is divided into 100 sec bins |
 |
 |
| Module-wise count rates for Quadrant D Data is divided into 100 sec bins |
 |
 |
| Parameter | Plot |
|---|---|
| CZT HV Monitor | 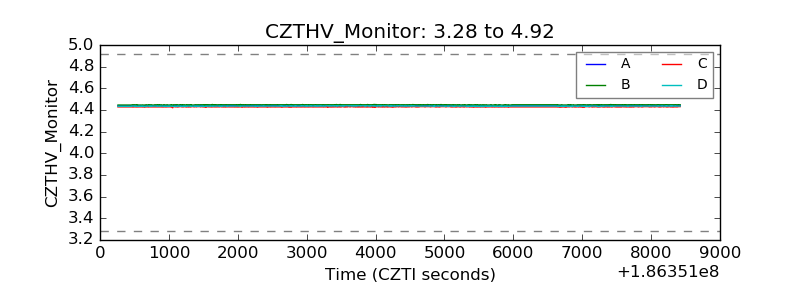 |
| D_VDD | 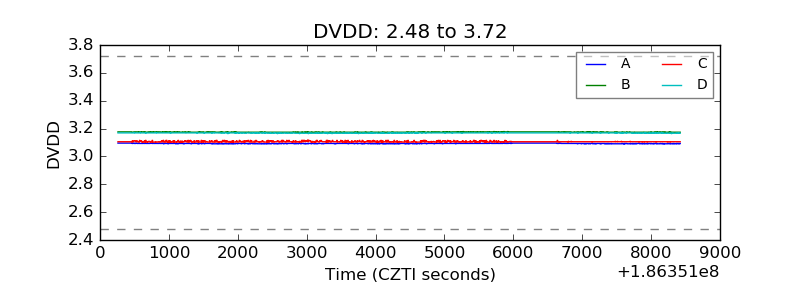 |
| Temperature 1 | 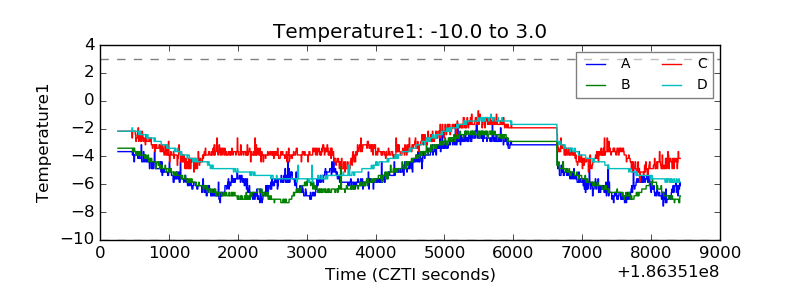 |
| Veto HV Monitor | 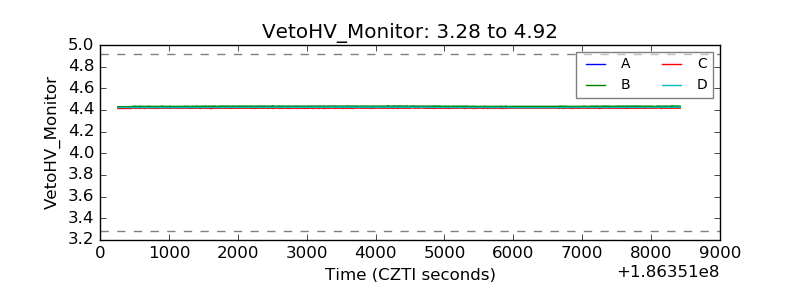 |
| Veto LLD | 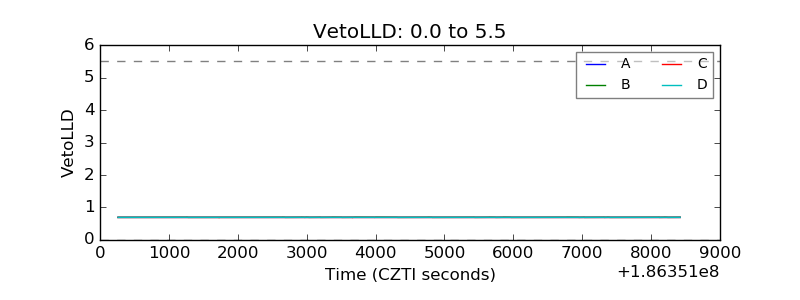 |
| Alpha Counter | 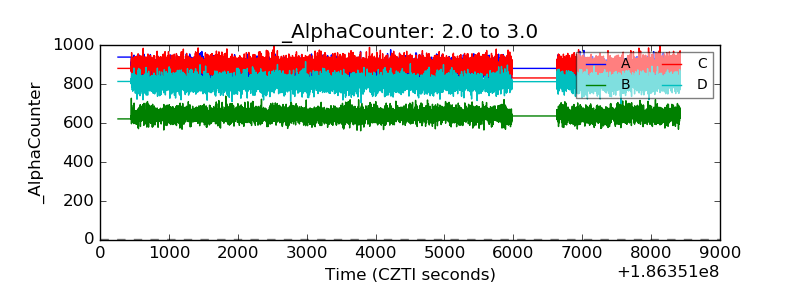 |
| _CPM_Rate | 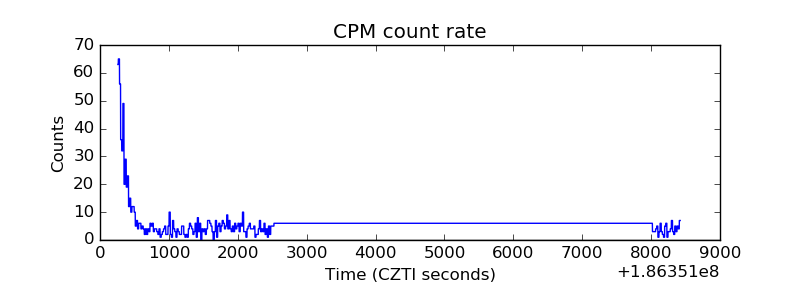 |
| CZT Counter | 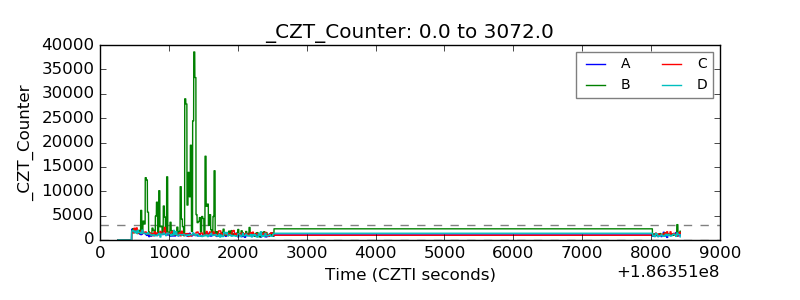 |
| +2.5 Volts monitor |  |
| +5 Volts monitor | 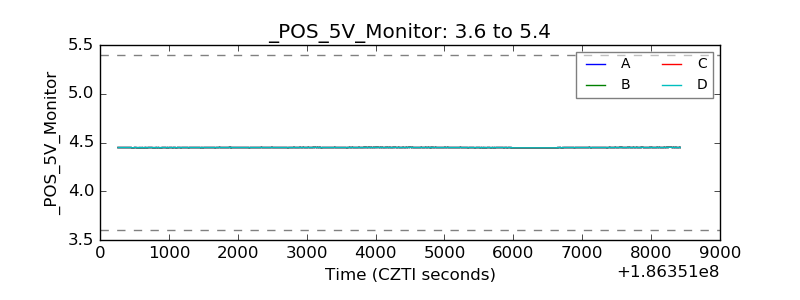 |
| _ROLL_ROT | 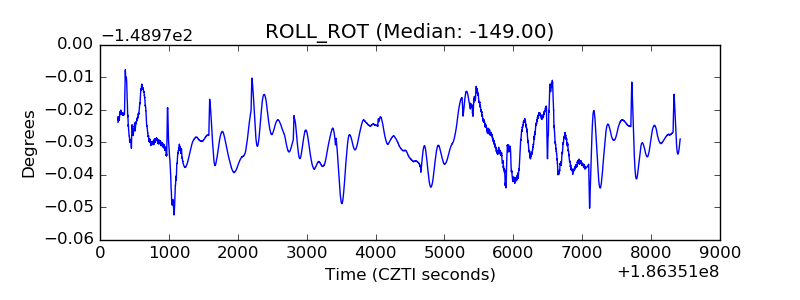 |
| _Roll_DEC | 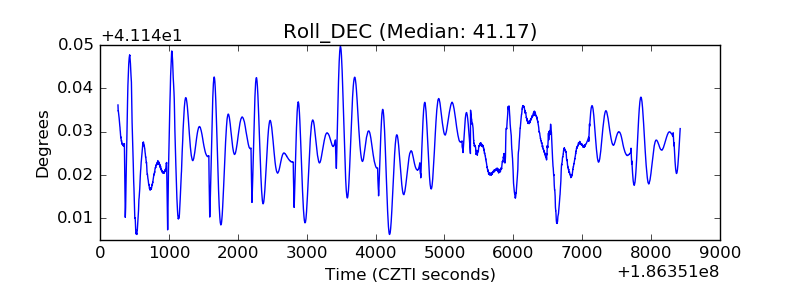 |
| _Roll_RA |  |
| Veto Counter | 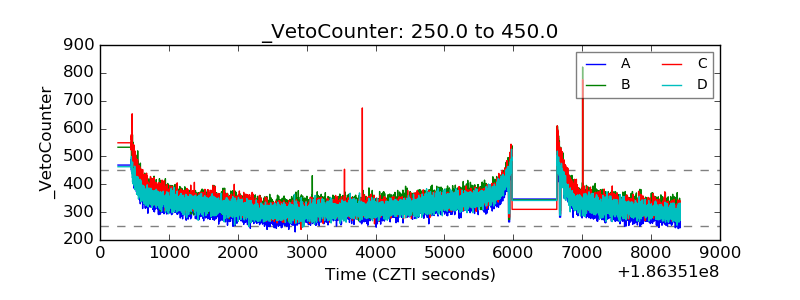 |