| Param | Original file | Final file |
|---|---|---|
| Filename | modeM0/AS1P01_161T05_9000000180_00901cztM0_level2.evt | modeM0/AS1P01_161T05_9000000180_00901cztM0_level2_quad_clean.evt |
| Size (bytes) | 1,504,779,840 | 76,305,600 |
| Size | 1.4 GB | 72.8 MB |
| Events in quadrant A | 9,568,672 | 473,976 |
| Events in quadrant B | 15,268,455 | 381,913 |
| Events in quadrant C | 10,958,023 | 463,891 |
| Events in quadrant D | 9,259,210 | 443,458 |
| Mode M9 | |||
|---|---|---|---|
| Quadrant | BADHDUFLAG | Total packets | Discarded packets |
| A | 0 | 3 | 0 |
| B | 0 | 3 | 0 |
| C | 0 | 3 | 0 |
| D | 0 | 3 | 0 |
| Mode SS | |||
|---|---|---|---|
| Quadrant | BADHDUFLAG | Total packets | Discarded packets |
| A | 0 | 160 | 0 |
| B | 0 | 160 | 0 |
| C | 0 | 160 | 0 |
| D | 0 | 160 | 0 |
| Mode M0 | |||
|---|---|---|---|
| Quadrant | BADHDUFLAG | Total packets | Discarded packets |
| A | 0 | 33973 | 0 |
| B | 0 | 51245 | 0 |
| C | 0 | 38138 | 0 |
| D | 0 | 33130 | 0 |
| Quadrant | Total seconds | Saturated seconds | Saturation percentage |
|---|---|---|---|
| A | 7855 | 22 | 0.280076% |
| B | 7855 | 2093 | 26.645449% |
| C | 7855 | 34 | 0.432845% |
| D | 7855 | 197 | 2.507957% |
Noise dominated data is calculated using 1-second bins in cleaned event files. If a bin has >2000 counts, and if more than 50% of those come from <1% of pixels, then it is considered to be noise-dominated and hence unusable.
| Quadrant | # 1 sec bins | Bins with >0 counts | Bins with >2000 counts | High rate bins dominated by noise | Noise dominated (total time) | Noise dominated (detector-on time) | Marked lightcurve |
|---|---|---|---|---|---|---|---|
| A | 7975 | 7857 | 403 | 403 | 5.05% | 5.13% |  |
| B | 7975 | 7857 | 3096 | 3096 | 38.82% | 39.40% | 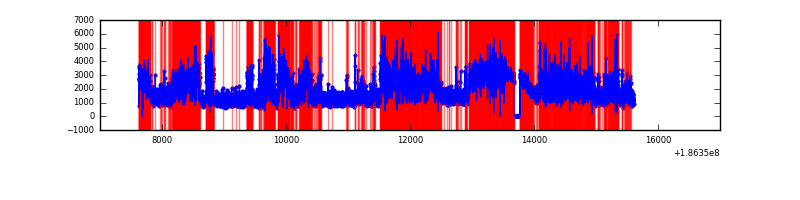 |
| C | 7975 | 7857 | 682 | 682 | 8.55% | 8.68% |  |
| D | 7975 | 7857 | 519 | 519 | 6.51% | 6.61% | 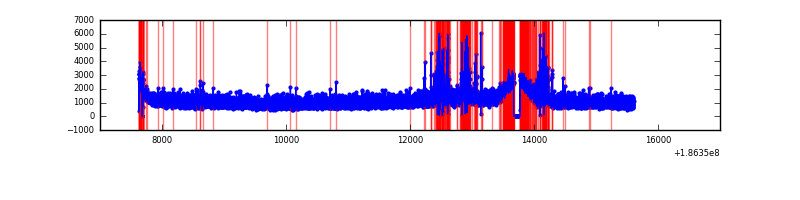 |
Top three noisy pixels from each quadrant. If the there are fewer than three noisy pixels in the level2.evt file, extra rows are filled as -1
| Pixel properties | Quadrant properties | ||||||
|---|---|---|---|---|---|---|---|
| Quadrant | DetID | PixID | Counts | Sigma | Mean | Median | Sigma |
| A | 15 | 127 | 100764 | 164.78 | 2460 | 2470 | 596.5 |
| A | 14 | 170 | 29928 | 46.03 | 2460 | 2470 | 596.5 |
| A | 11 | 79 | 10000 | 12.62 | 2460 | 2470 | 596.5 |
| B | 3 | 0 | 6693344 | 12908.09 | 2198 | 2216 | 518.4 |
| B | 0 | 220 | 59466 | 110.44 | 2198 | 2216 | 518.4 |
| B | 15 | 22 | 53417 | 98.77 | 2198 | 2216 | 518.4 |
| C | 9 | 83 | 1648818 | 2484.33 | 2365 | 2448 | 662.7 |
| C | 3 | 111 | 28411 | 39.18 | 2365 | 2448 | 662.7 |
| C | 15 | 241 | 22939 | 30.92 | 2365 | 2448 | 662.7 |
| D | 1 | 4 | 61669 | 82.39 | 2356 | 2371 | 719.7 |
| D | 12 | 188 | 61232 | 81.78 | 2356 | 2371 | 719.7 |
| D | 2 | 16 | 54669 | 72.67 | 2356 | 2371 | 719.7 |
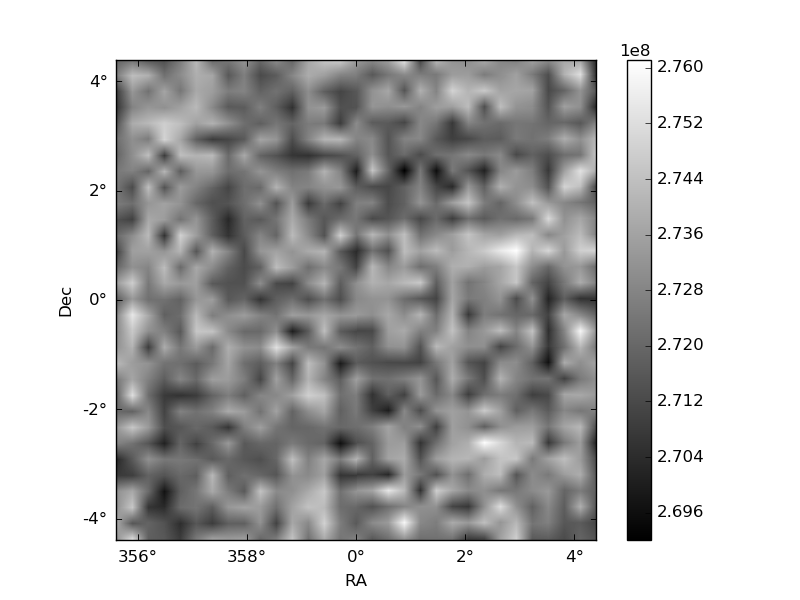
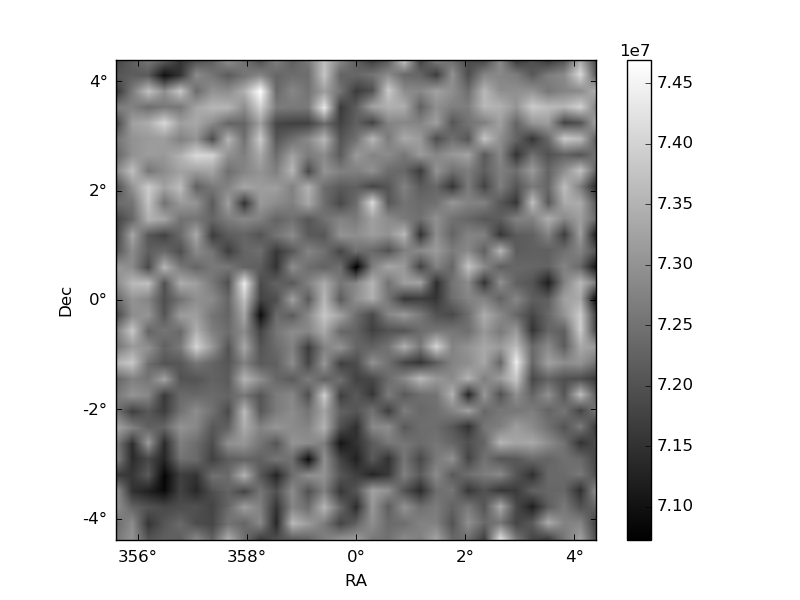
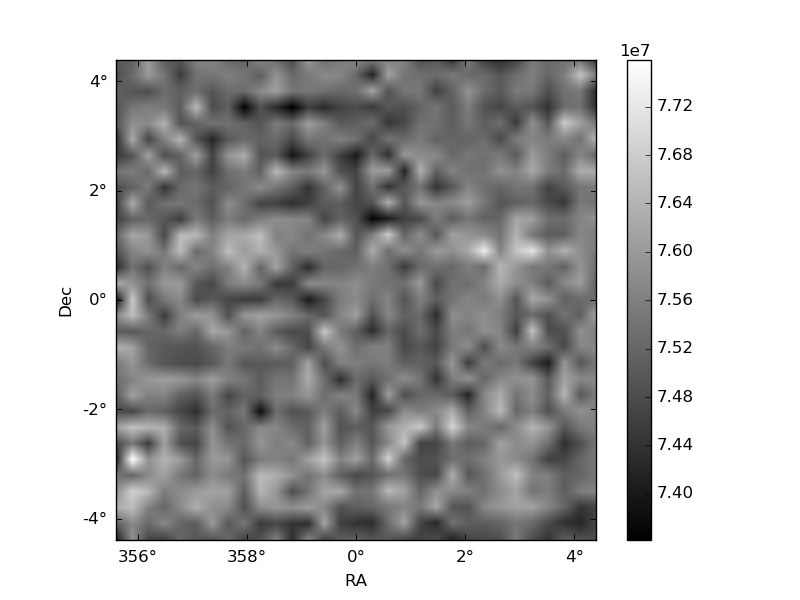
Histogram calculated using DETX and DETY for each event in the final _common_clean file
| Quadrant A | 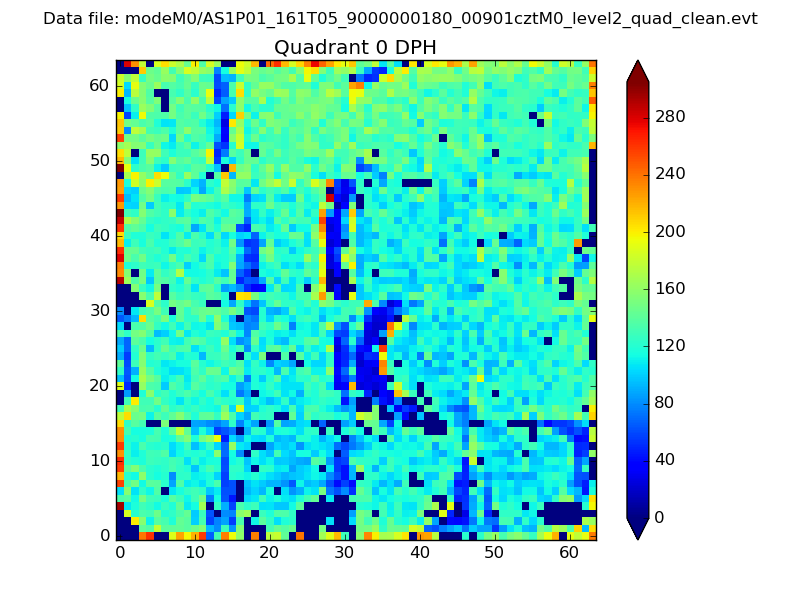 |
 |
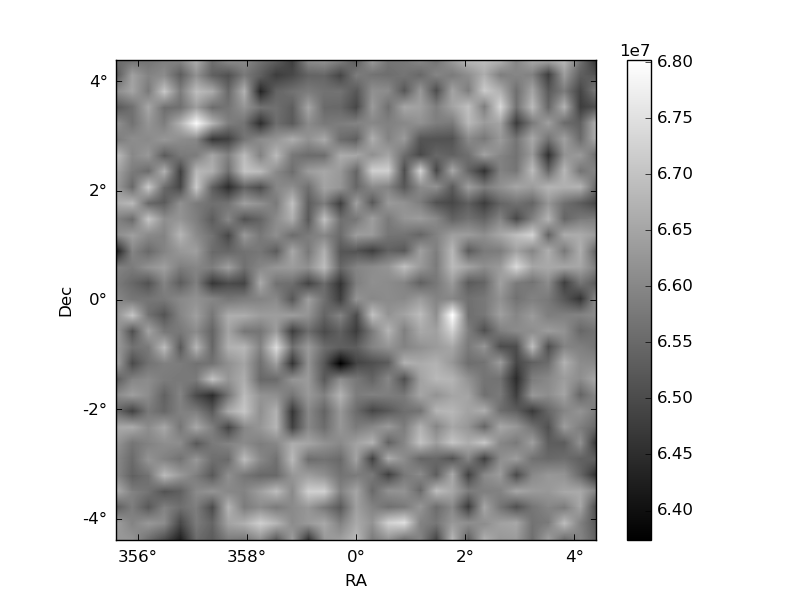
Quadrant B |
|---|---|---|---|
| Quadrant D | 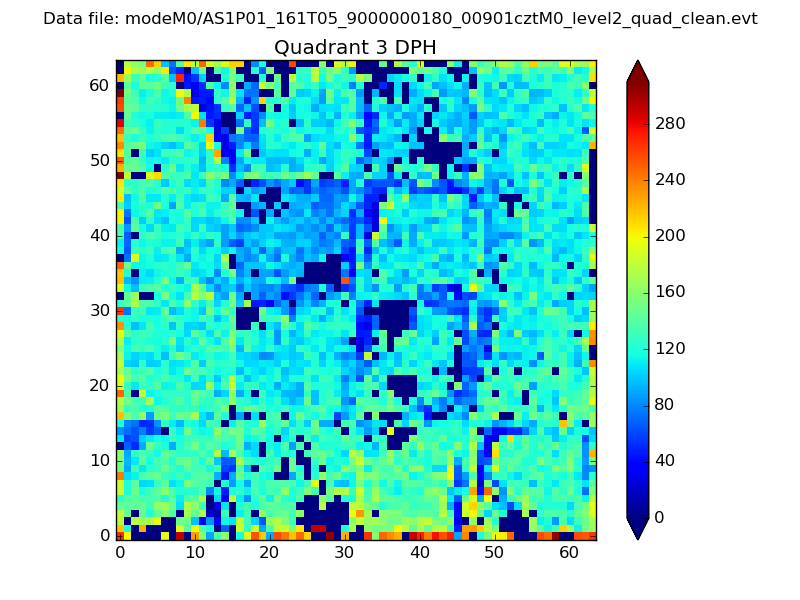 |
 |
Quadrant C |
| Plot type | Count rate plots | Images |
|---|---|---|
| Comparison with Poisson distribution Blue bars denote a histogram of data divided into 1 sec bins. Red curve is a Poisson curve with rate = median count rate of data. |
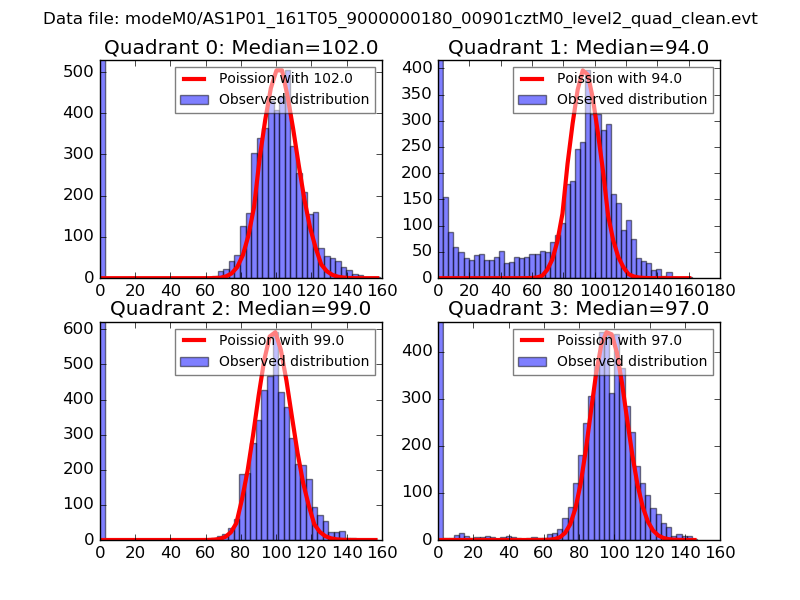 |
 |
| Quadrant-wise count rates Data is divided into 100 sec bins |
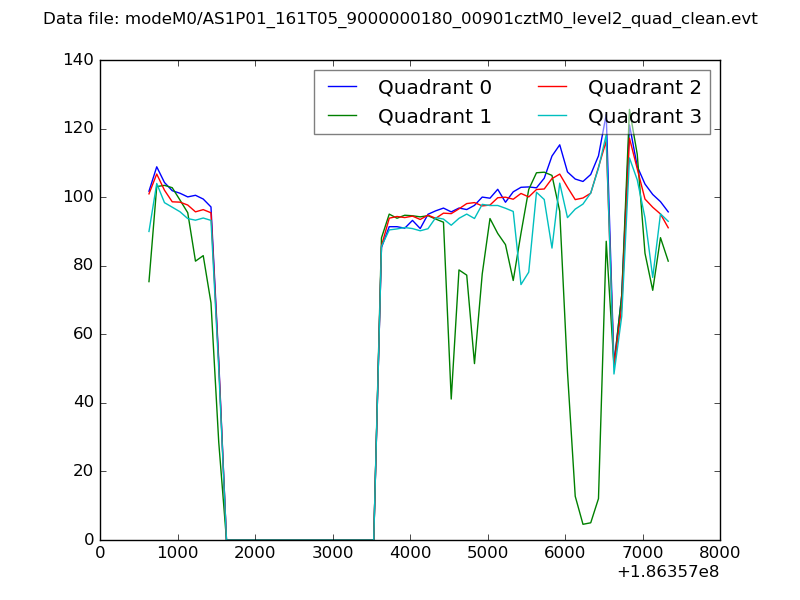 |
|
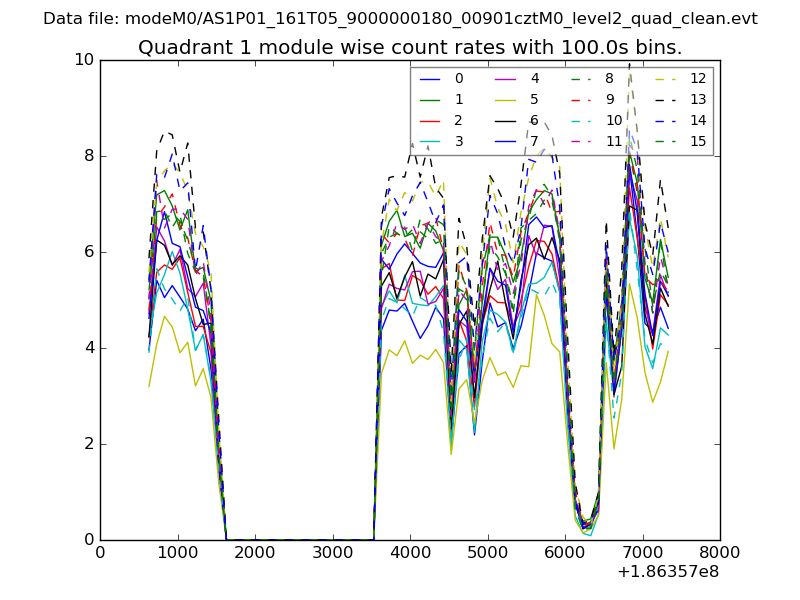
| Module-wise count rates for Quadrant A Data is divided into 100 sec bins |
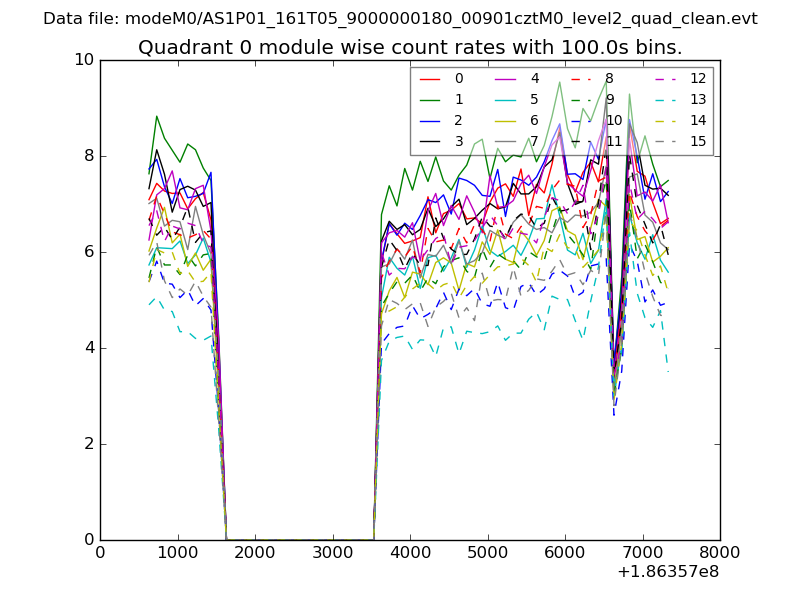 |
 |
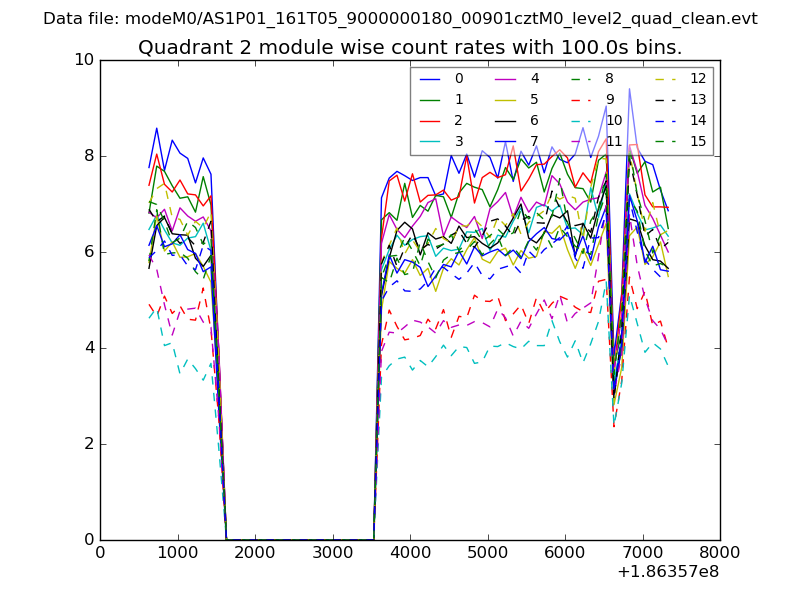
| Module-wise count rates for Quadrant B Data is divided into 100 sec bins |
 |
 |
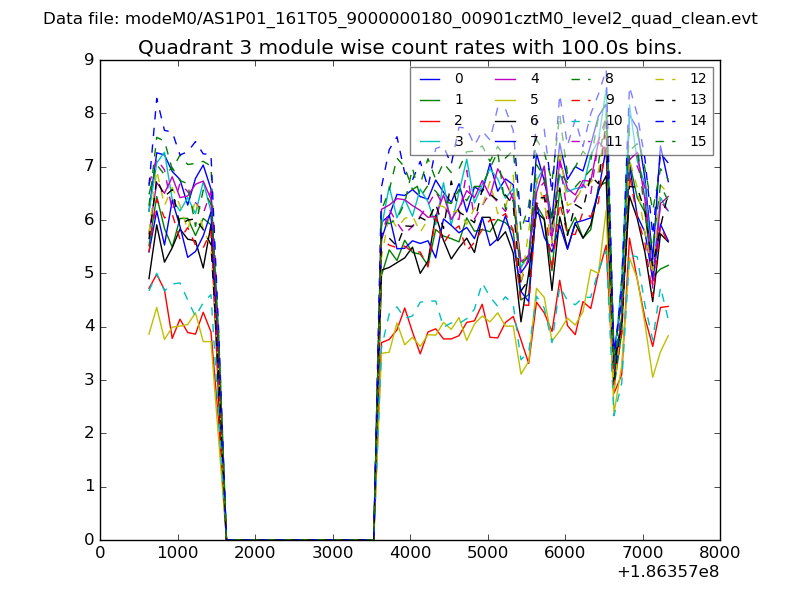
| Module-wise count rates for Quadrant C Data is divided into 100 sec bins |
 |
 |
| Module-wise count rates for Quadrant D Data is divided into 100 sec bins |
 |
 |
| Parameter | Plot |
|---|---|
| CZT HV Monitor | 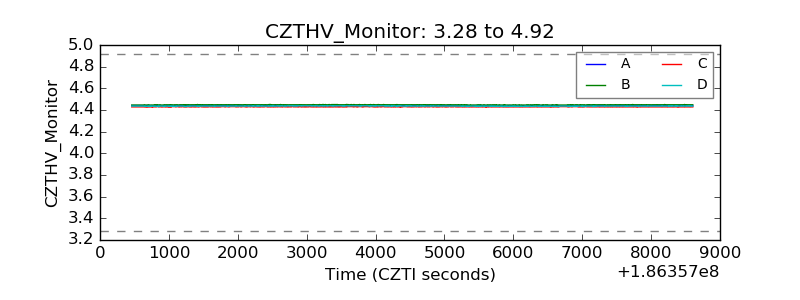 |
| D_VDD | 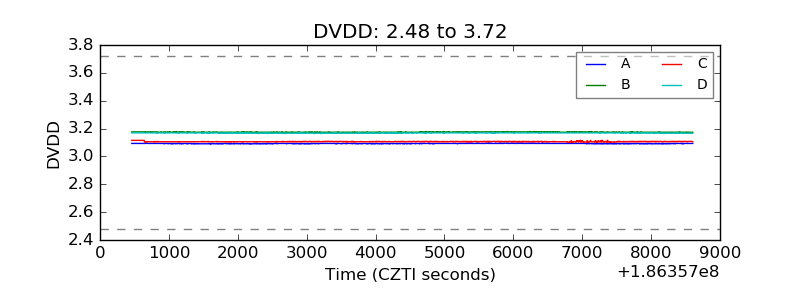 |
| Temperature 1 | 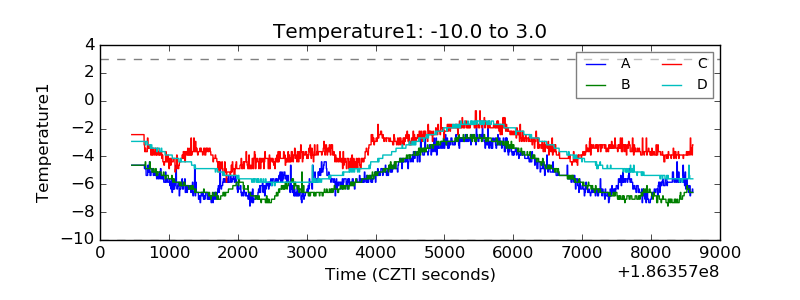 |
| Veto HV Monitor | 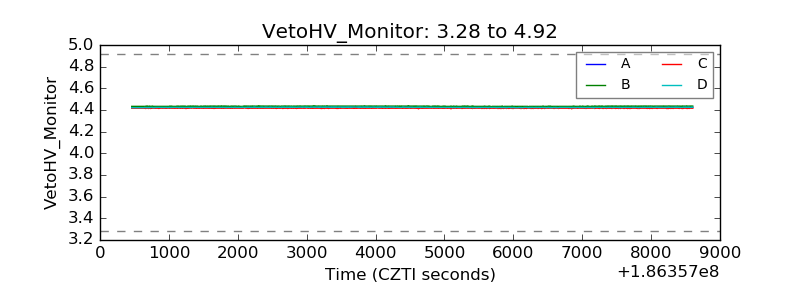 |
| Veto LLD | 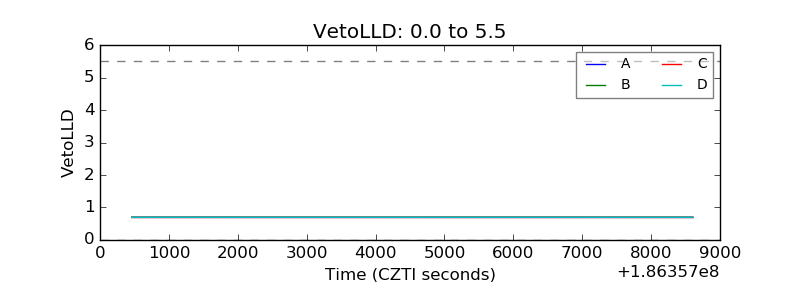 |
| Alpha Counter | 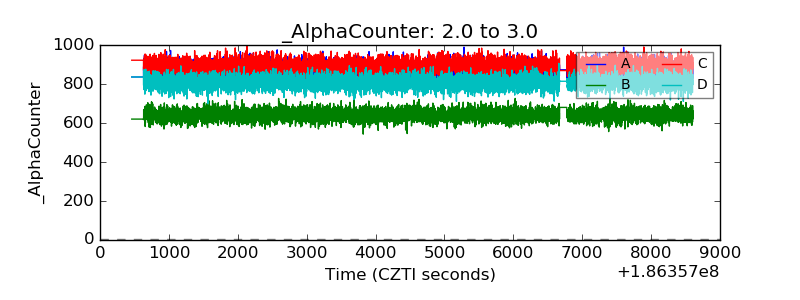 |
| _CPM_Rate | 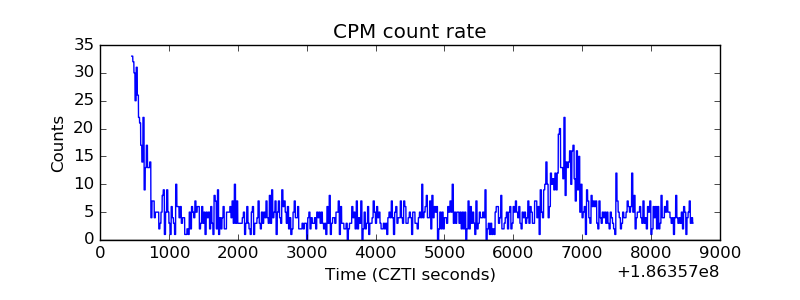 |
| CZT Counter |  |
| +2.5 Volts monitor |  |
| +5 Volts monitor |  |
| _ROLL_ROT | 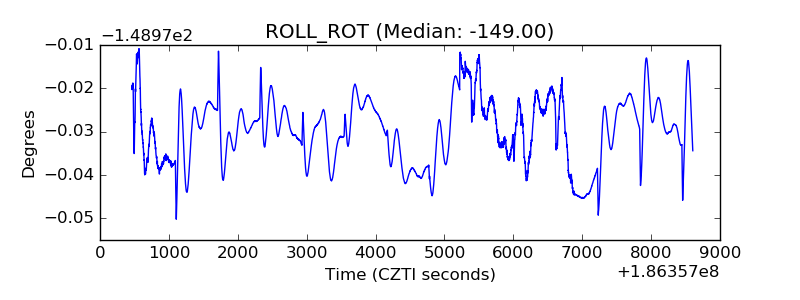 |
| _Roll_DEC | 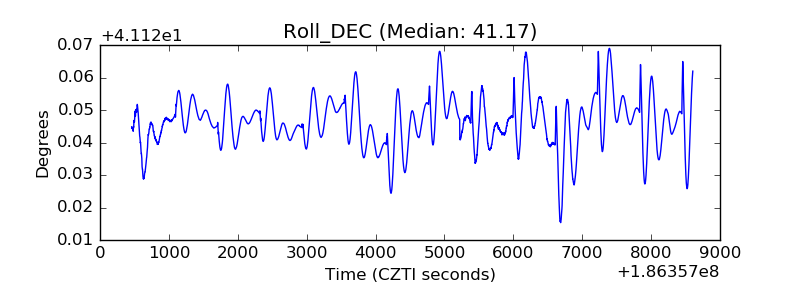 |
| _Roll_RA | 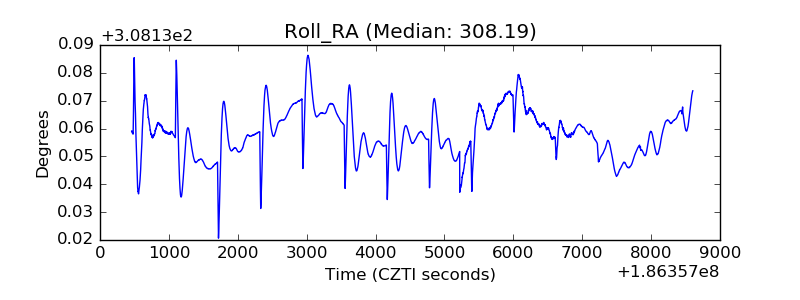 |
| Veto Counter | 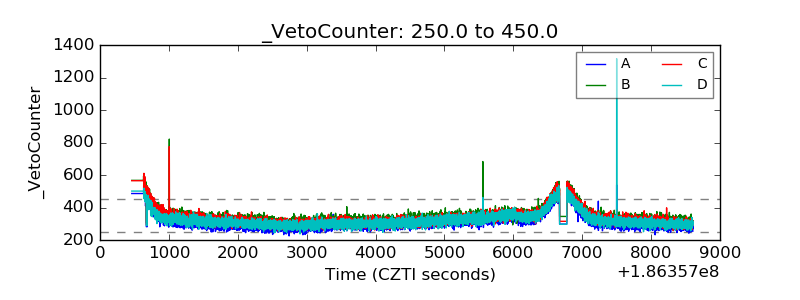 |