| Param | Original file | Final file |
|---|---|---|
| Filename | modeM0/AS1P01_161T05_9000000180_00902cztM0_level2.evt | modeM0/AS1P01_161T05_9000000180_00902cztM0_level2_quad_clean.evt |
| Size (bytes) | 1,300,570,560 | 65,407,680 |
| Size | 1.2 GB | 62.4 MB |
| Events in quadrant A | 8,807,383 | 377,531 |
| Events in quadrant B | 11,412,719 | 363,861 |
| Events in quadrant C | 10,154,360 | 372,164 |
| Events in quadrant D | 8,530,480 | 357,414 |
| Mode M9 | |||
|---|---|---|---|
| Quadrant | BADHDUFLAG | Total packets | Discarded packets |
| A | 0 | 1 | 0 |
| B | 0 | 1 | 0 |
| C | 0 | 1 | 0 |
| D | 0 | 1 | 0 |
| Mode SS | |||
|---|---|---|---|
| Quadrant | BADHDUFLAG | Total packets | Discarded packets |
| A | 0 | 146 | 0 |
| B | 0 | 146 | 0 |
| C | 0 | 146 | 0 |
| D | 0 | 146 | 0 |
| Mode M0 | |||
|---|---|---|---|
| Quadrant | BADHDUFLAG | Total packets | Discarded packets |
| A | 0 | 31360 | 0 |
| B | 0 | 39207 | 0 |
| C | 0 | 35300 | 0 |
| D | 0 | 30549 | 0 |
| Quadrant | Total seconds | Saturated seconds | Saturation percentage |
|---|---|---|---|
| A | 7323 | 6 | 0.081934% |
| B | 7322 | 565 | 7.716471% |
| C | 7322 | 25 | 0.341437% |
| D | 7322 | 116 | 1.584267% |
Noise dominated data is calculated using 1-second bins in cleaned event files. If a bin has >2000 counts, and if more than 50% of those come from <1% of pixels, then it is considered to be noise-dominated and hence unusable.
| Quadrant | # 1 sec bins | Bins with >0 counts | Bins with >2000 counts | High rate bins dominated by noise | Noise dominated (total time) | Noise dominated (detector-on time) | Marked lightcurve |
|---|---|---|---|---|---|---|---|
| A | 7373 | 7324 | 308 | 308 | 4.18% | 4.21% | 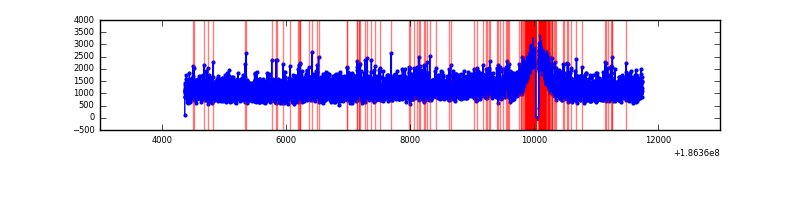 |
| B | 7372 | 7323 | 1394 | 1394 | 18.91% | 19.04% | 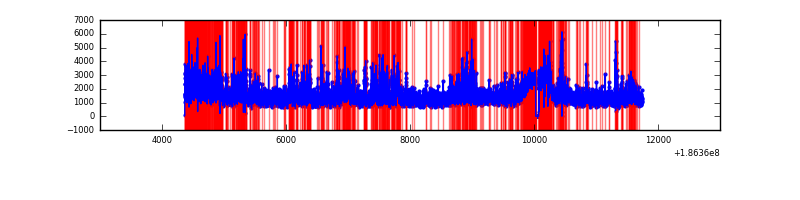 |
| C | 7372 | 7323 | 562 | 562 | 7.62% | 7.67% | 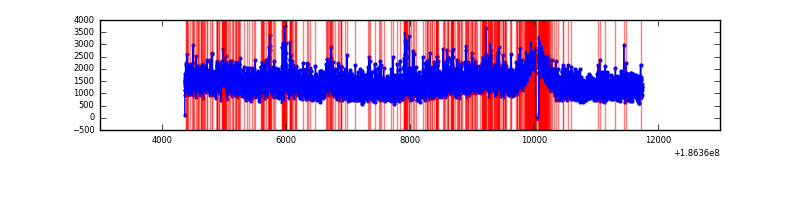 |
| D | 7372 | 7323 | 338 | 338 | 4.58% | 4.62% | 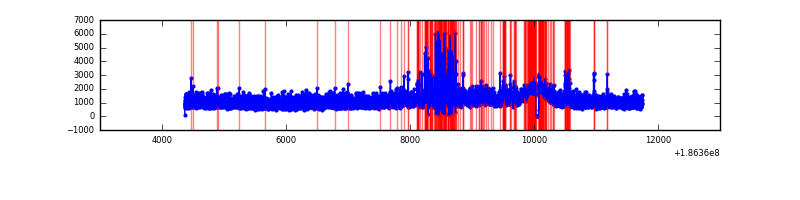 |
Top three noisy pixels from each quadrant. If the there are fewer than three noisy pixels in the level2.evt file, extra rows are filled as -1
| Pixel properties | Quadrant properties | ||||||
|---|---|---|---|---|---|---|---|
| Quadrant | DetID | PixID | Counts | Sigma | Mean | Median | Sigma |
| A | 15 | 127 | 81477 | 144.23 | 2272 | 2288 | 549.1 |
| A | 11 | 79 | 9029 | 12.28 | 2272 | 2288 | 549.1 |
| A | 12 | 133 | 7589 | 9.65 | 2272 | 2288 | 549.1 |
| B | 3 | 0 | 2317939 | 4233.46 | 2300 | 2310 | 547.0 |
| B | 5 | 191 | 179237 | 323.46 | 2300 | 2310 | 547.0 |
| B | 0 | 220 | 76429 | 135.5 | 2300 | 2310 | 547.0 |
| C | 9 | 83 | 1614203 | 2662.95 | 2167 | 2247 | 605.3 |
| C | 3 | 111 | 29867 | 45.63 | 2167 | 2247 | 605.3 |
| C | 15 | 241 | 21679 | 32.1 | 2167 | 2247 | 605.3 |
| D | 12 | 188 | 191670 | 306.07 | 2145 | 2174 | 619.1 |
| D | 2 | 16 | 169433 | 270.16 | 2145 | 2174 | 619.1 |
| D | 10 | 157 | 28966 | 43.27 | 2145 | 2174 | 619.1 |
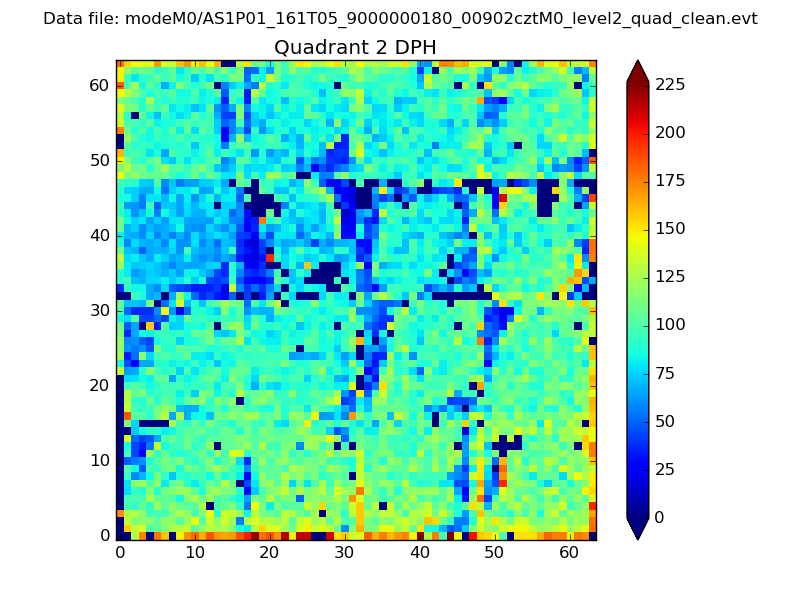
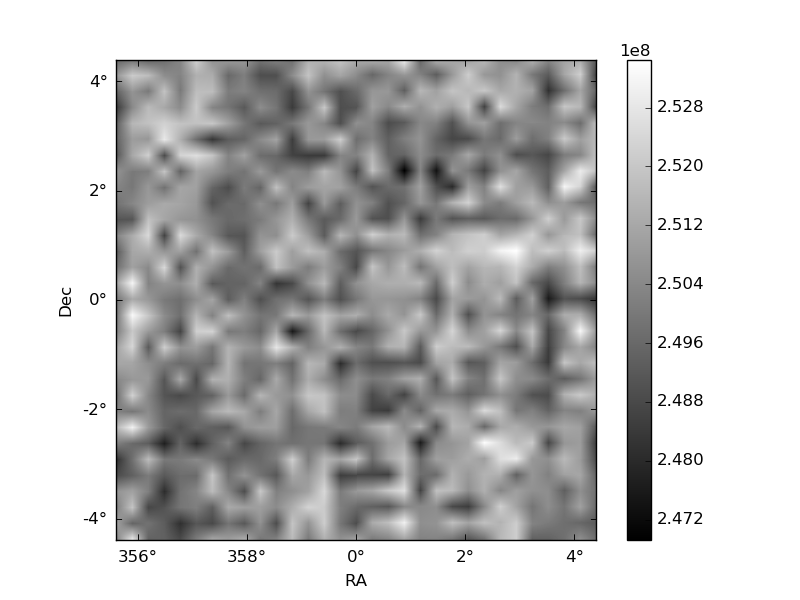
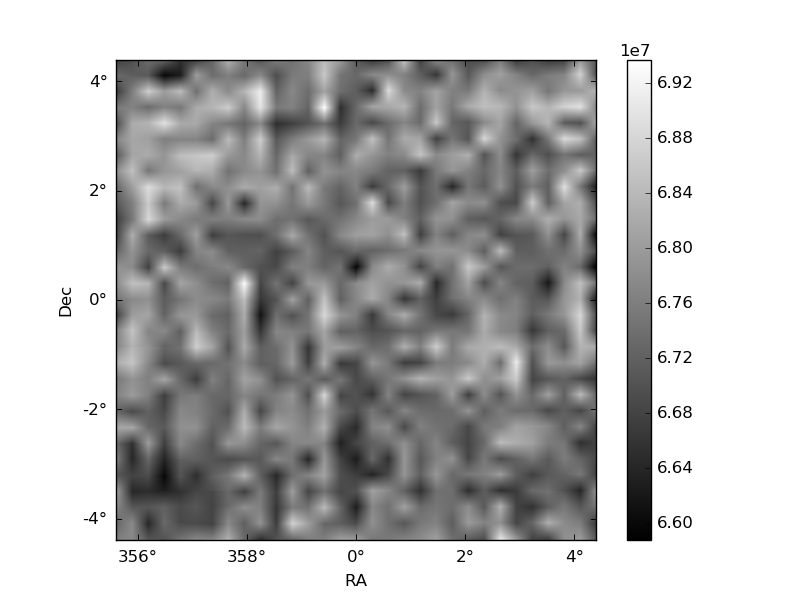
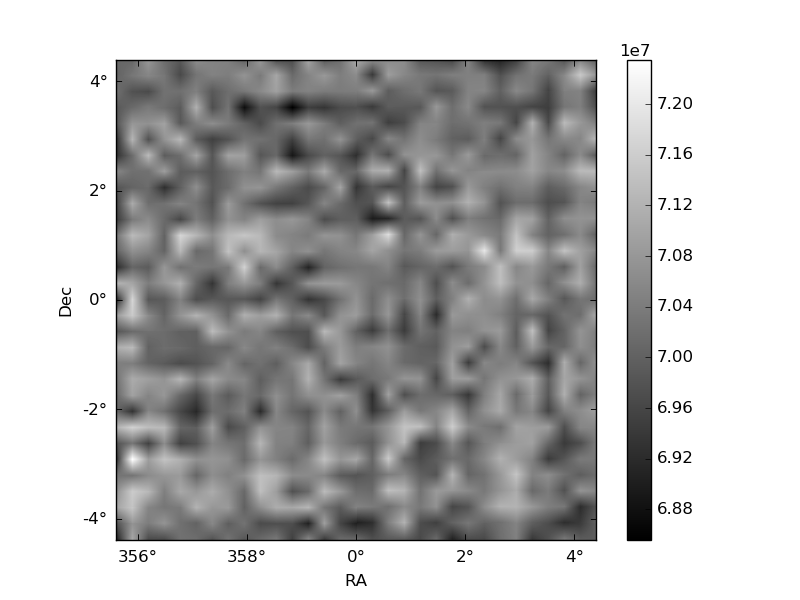
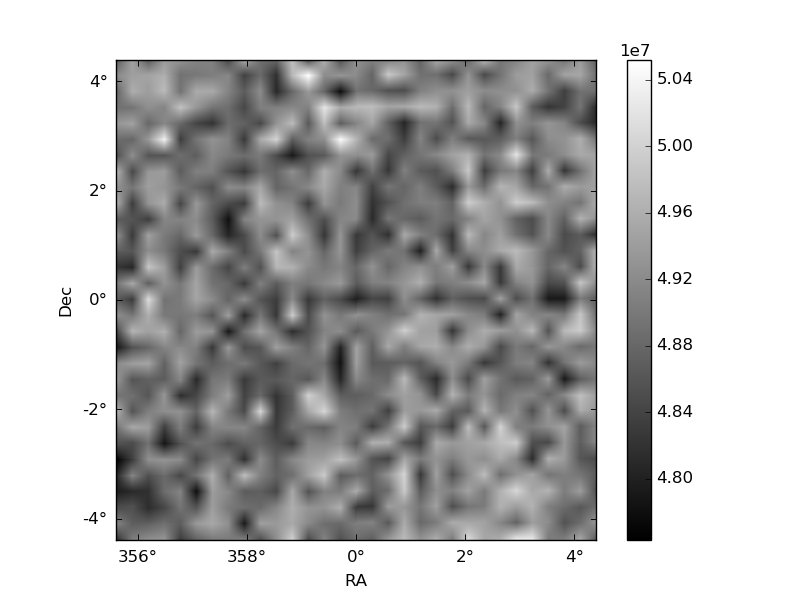
Histogram calculated using DETX and DETY for each event in the final _common_clean file
| Quadrant A | 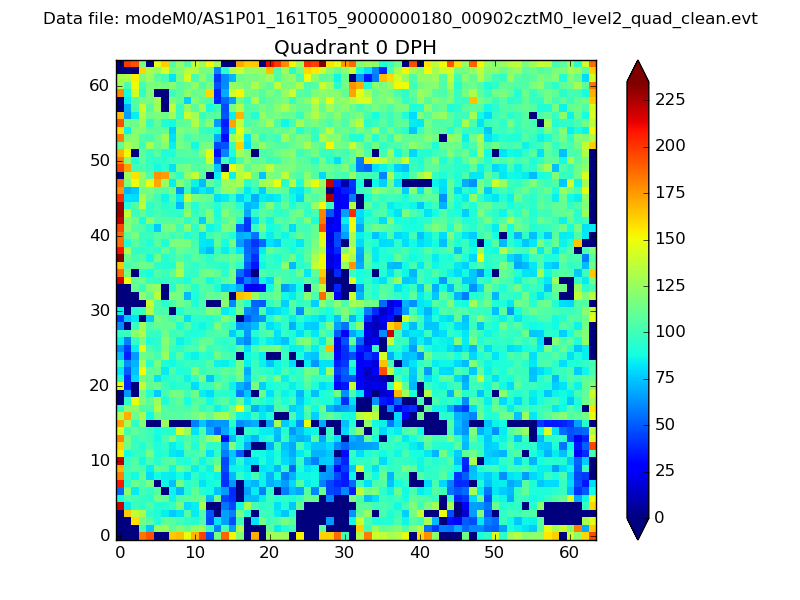 |
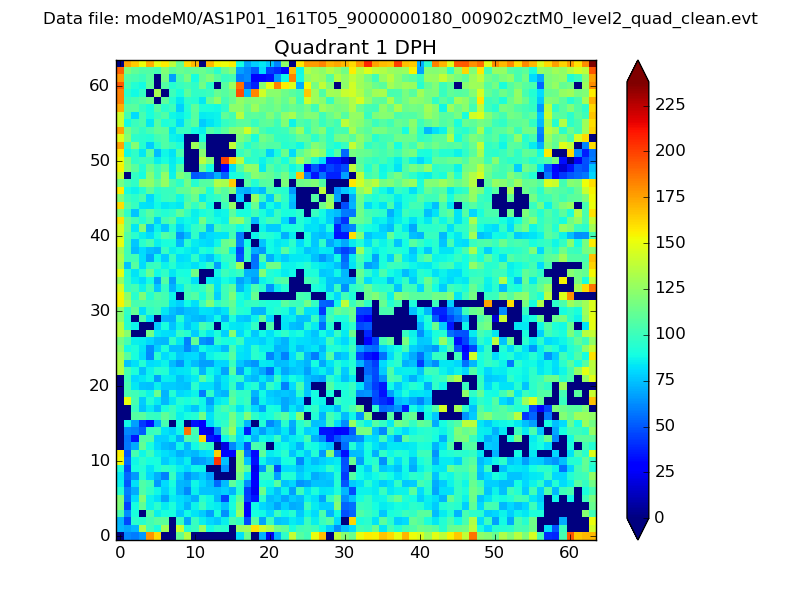 |
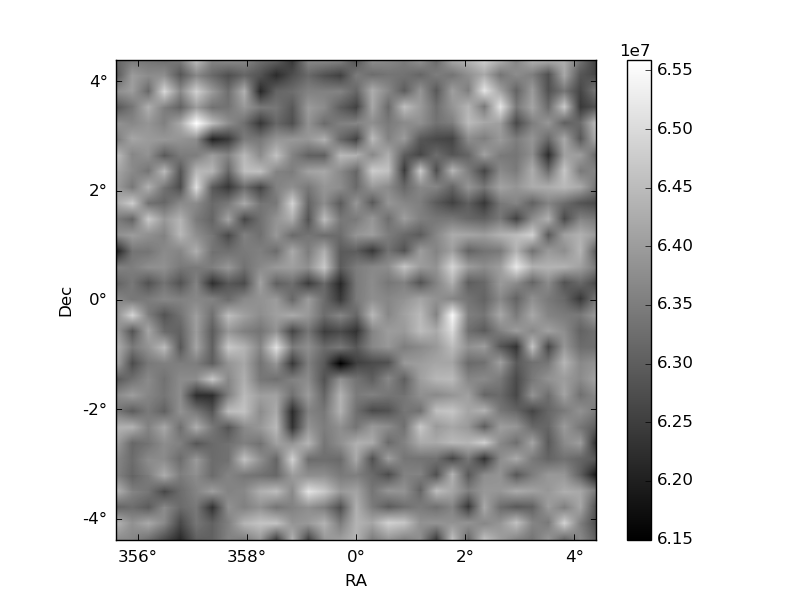
Quadrant B |
|---|---|---|---|
| Quadrant D | 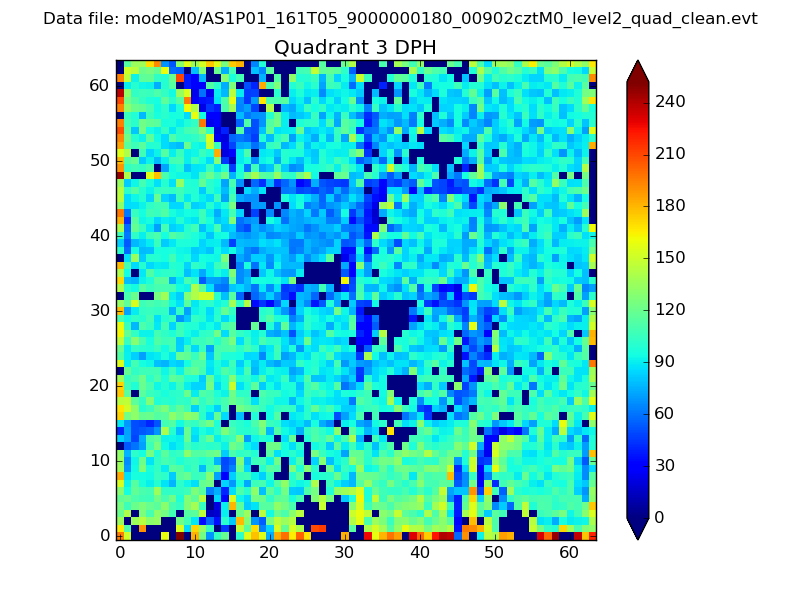 |
 |
Quadrant C |
| Plot type | Count rate plots | Images |
|---|---|---|
| Comparison with Poisson distribution Blue bars denote a histogram of data divided into 1 sec bins. Red curve is a Poisson curve with rate = median count rate of data. |
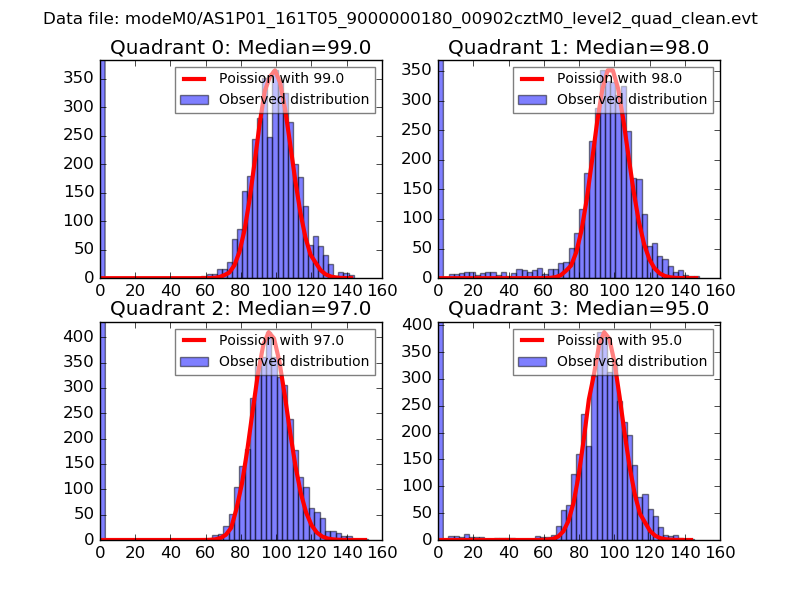 |
 |
| Quadrant-wise count rates Data is divided into 100 sec bins |
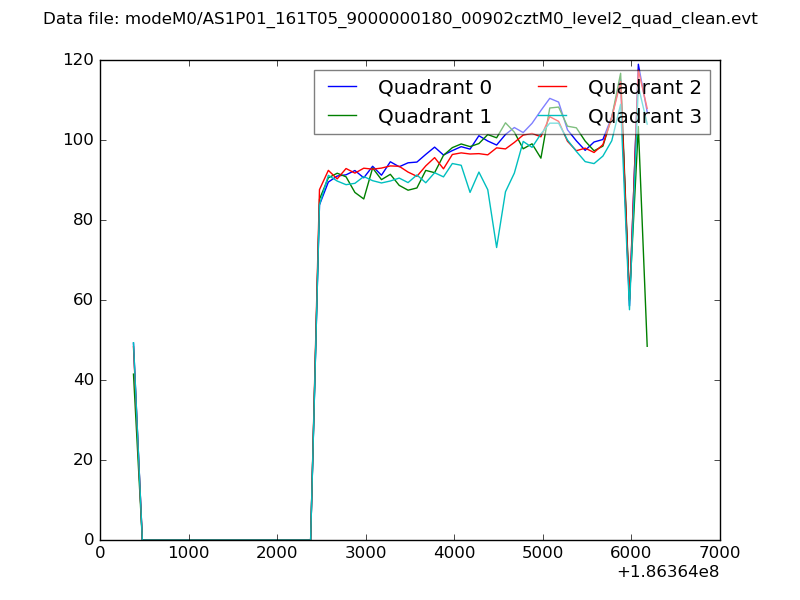 |
|
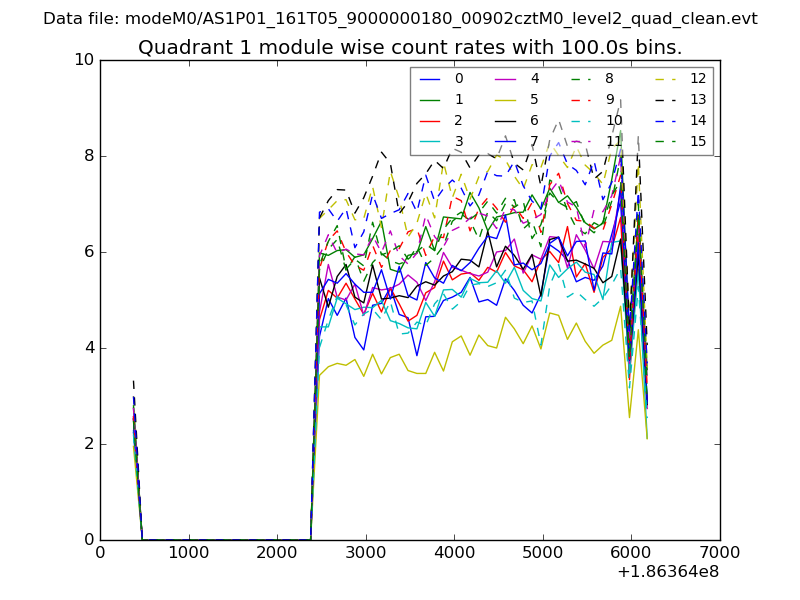
| Module-wise count rates for Quadrant A Data is divided into 100 sec bins |
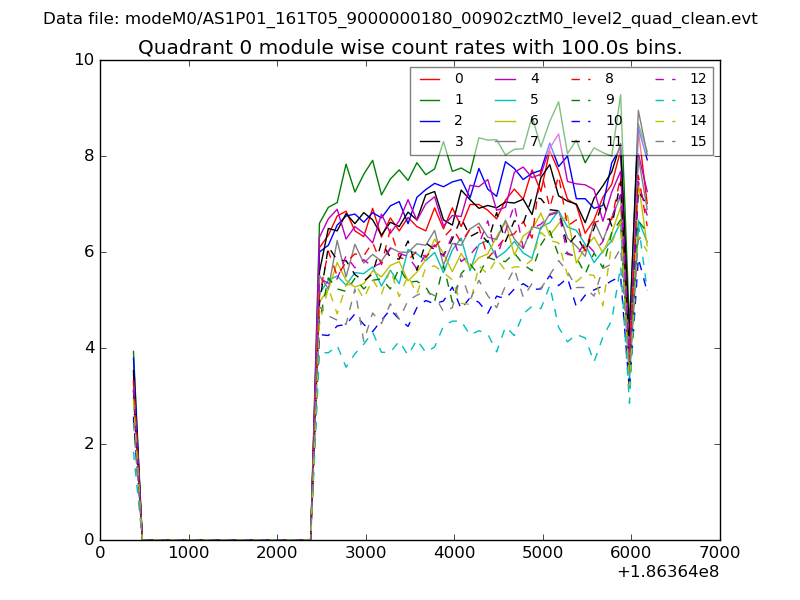 |
 |
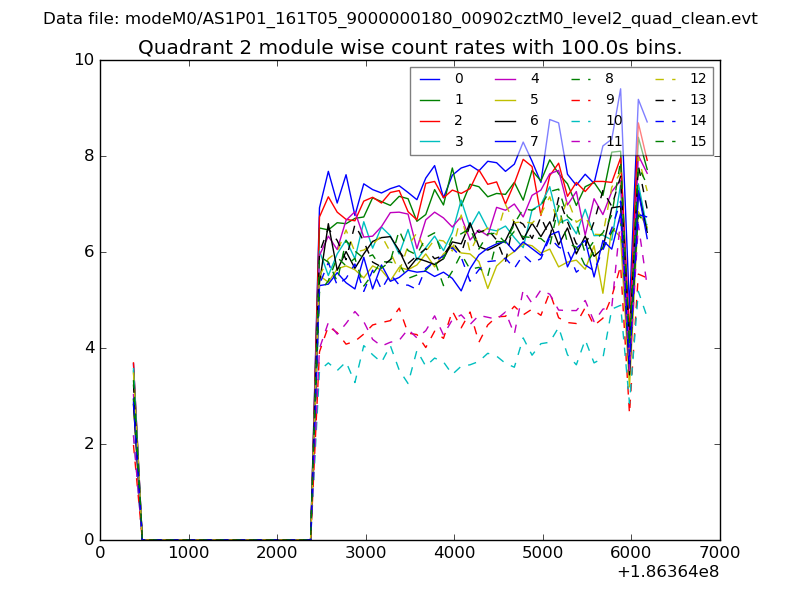
| Module-wise count rates for Quadrant B Data is divided into 100 sec bins |
 |
 |
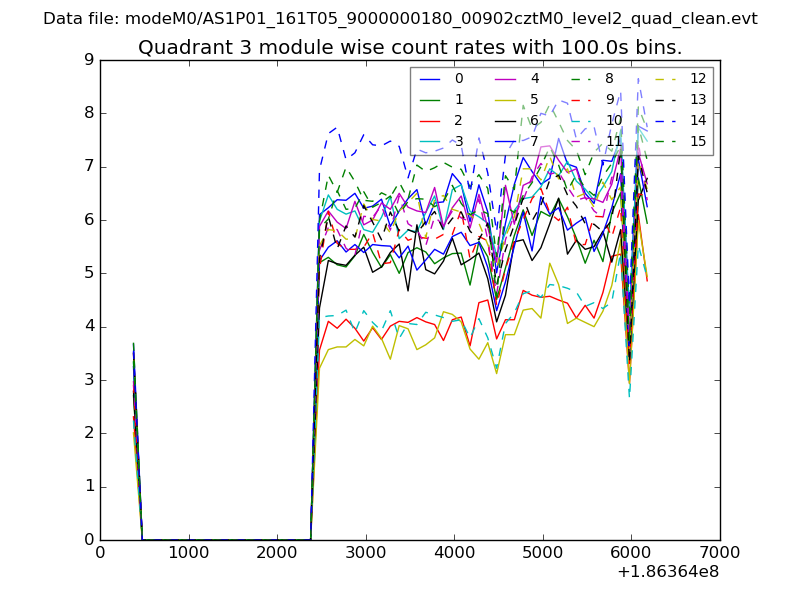
| Module-wise count rates for Quadrant C Data is divided into 100 sec bins |
 |
 |
| Module-wise count rates for Quadrant D Data is divided into 100 sec bins |
 |
 |
| Parameter | Plot |
|---|---|
| CZT HV Monitor | 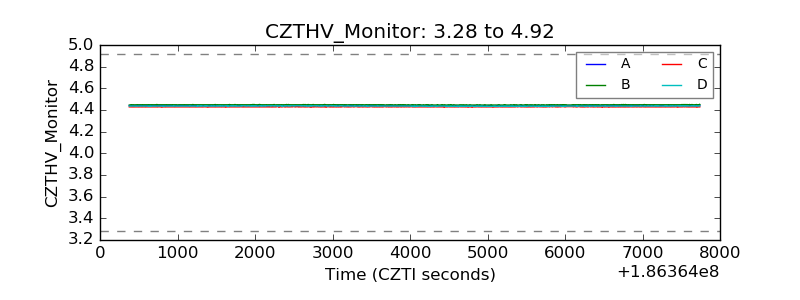 |
| D_VDD | 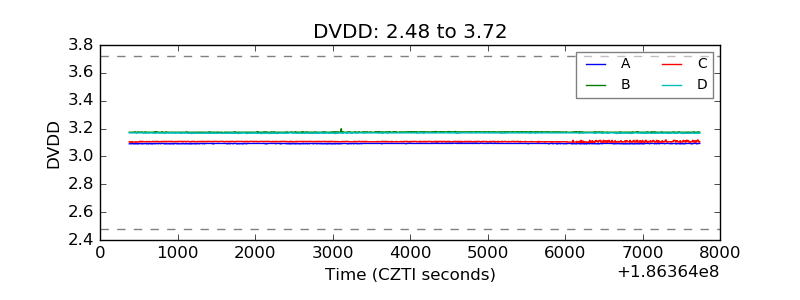 |
| Temperature 1 | 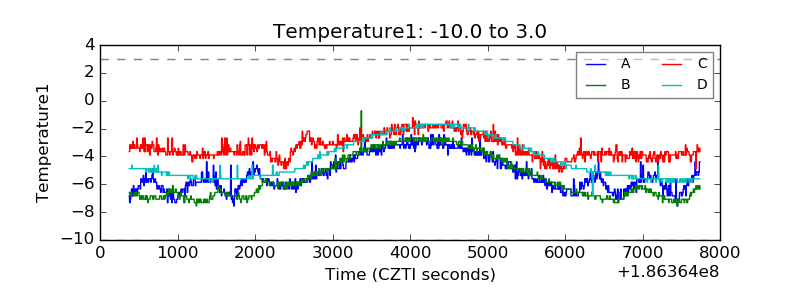 |
| Veto HV Monitor | 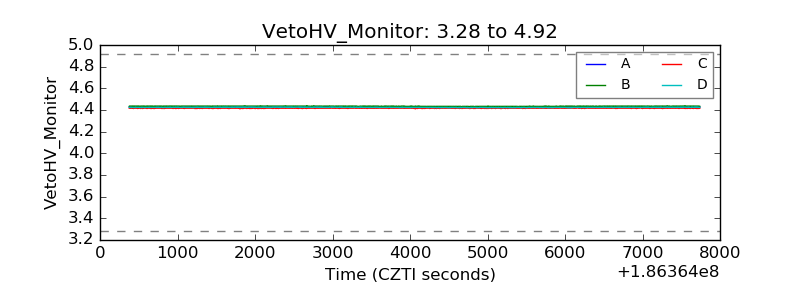 |
| Veto LLD | 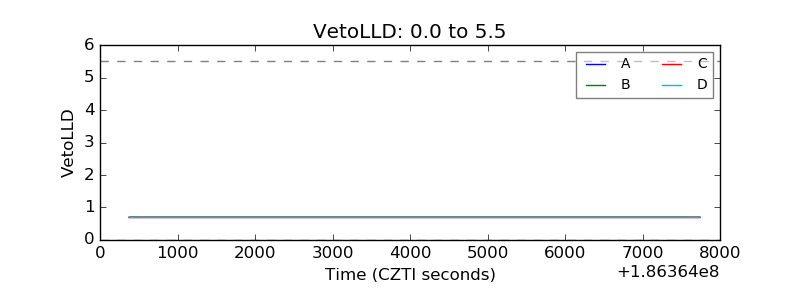 |
| Alpha Counter | 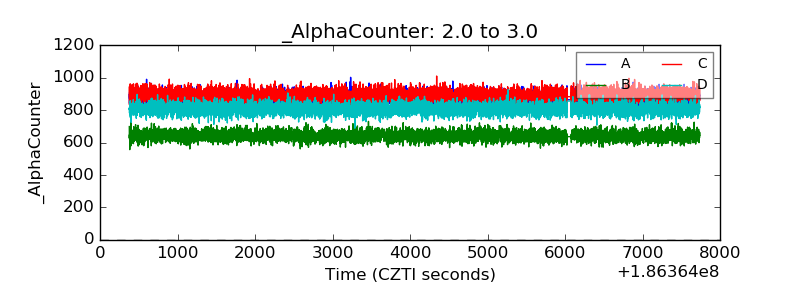 |
| _CPM_Rate | 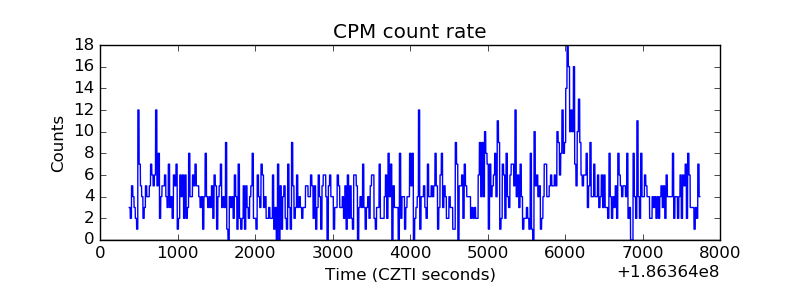 |
| CZT Counter | 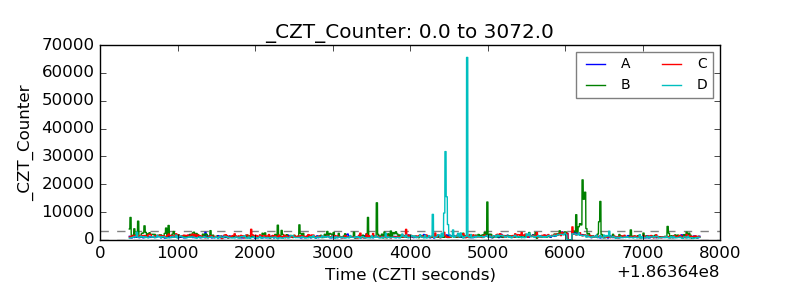 |
| +2.5 Volts monitor |  |
| +5 Volts monitor |  |
| _ROLL_ROT | 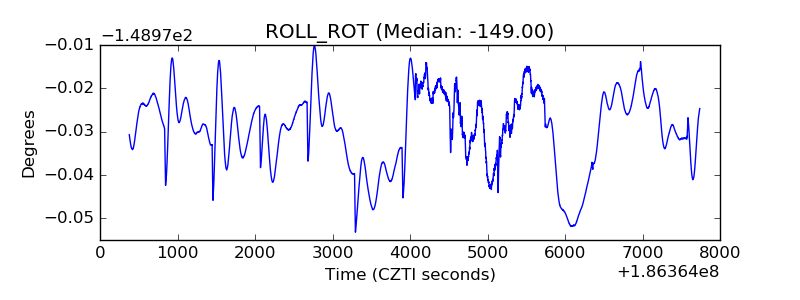 |
| _Roll_DEC | 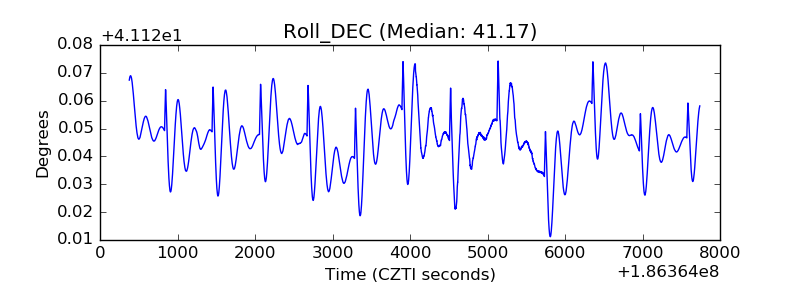 |
| _Roll_RA | 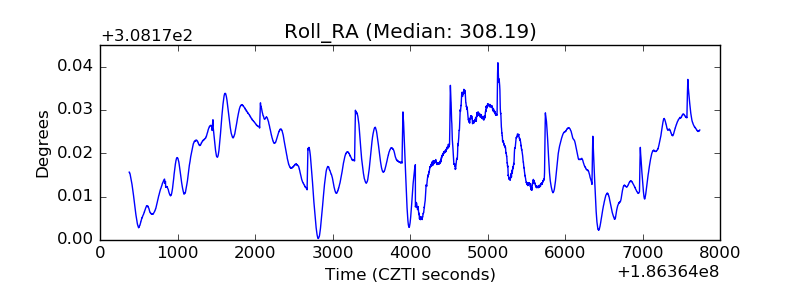 |
| Veto Counter | 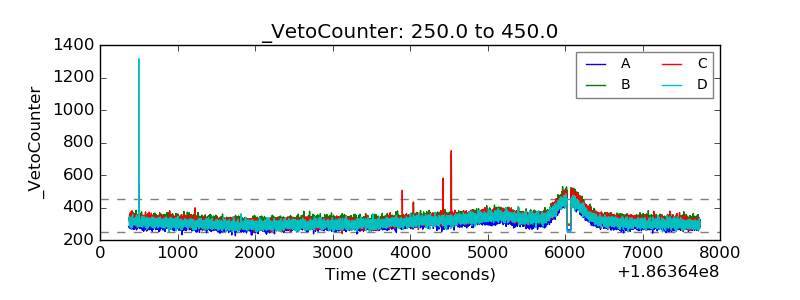 |