| Param | Original file | Final file |
|---|---|---|
| Filename | modeM0/AS1P01_161T05_9000000180_00903cztM0_level2.evt | modeM0/AS1P01_161T05_9000000180_00903cztM0_level2_quad_clean.evt |
| Size (bytes) | 1,387,189,440 | 63,815,040 |
| Size | 1.3 GB | 60.9 MB |
| Events in quadrant A | 9,262,566 | 368,725 |
| Events in quadrant B | 11,666,529 | 360,409 |
| Events in quadrant C | 9,377,488 | 367,750 |
| Events in quadrant D | 11,207,684 | 310,906 |
| Mode M9 | |||
|---|---|---|---|
| Quadrant | BADHDUFLAG | Total packets | Discarded packets |
| A | 0 | 1 | 0 |
| B | 0 | 1 | 0 |
| C | 0 | 1 | 0 |
| D | 0 | 1 | 0 |
| Mode SS | |||
|---|---|---|---|
| Quadrant | BADHDUFLAG | Total packets | Discarded packets |
| A | 0 | 152 | 0 |
| B | 0 | 152 | 0 |
| C | 0 | 152 | 0 |
| D | 0 | 152 | 0 |
| Mode M0 | |||
|---|---|---|---|
| Quadrant | BADHDUFLAG | Total packets | Discarded packets |
| A | 0 | 32876 | 0 |
| B | 0 | 40087 | 0 |
| C | 0 | 33204 | 0 |
| D | 0 | 38806 | 0 |
| Quadrant | Total seconds | Saturated seconds | Saturation percentage |
|---|---|---|---|
| A | 7529 | 118 | 1.567273% |
| B | 7529 | 495 | 6.574578% |
| C | 7530 | 86 | 1.142098% |
| D | 7530 | 1044 | 13.864542% |
Noise dominated data is calculated using 1-second bins in cleaned event files. If a bin has >2000 counts, and if more than 50% of those come from <1% of pixels, then it is considered to be noise-dominated and hence unusable.
| Quadrant | # 1 sec bins | Bins with >0 counts | Bins with >2000 counts | High rate bins dominated by noise | Noise dominated (total time) | Noise dominated (detector-on time) | Marked lightcurve |
|---|---|---|---|---|---|---|---|
| A | 7644 | 7530 | 378 | 378 | 4.95% | 5.02% | 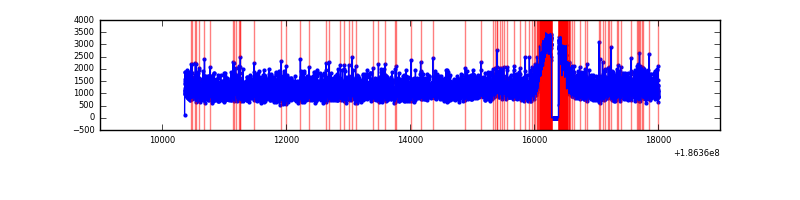 |
| B | 7644 | 7530 | 1307 | 1307 | 17.10% | 17.36% | 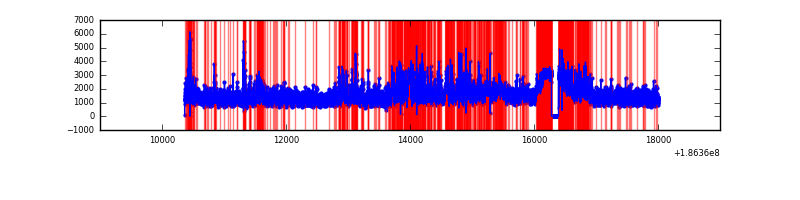 |
| C | 7645 | 7531 | 398 | 398 | 5.21% | 5.28% | 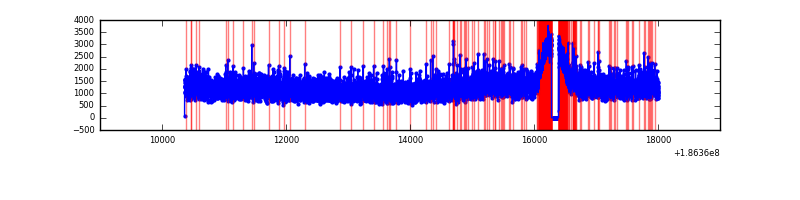 |
| D | 7645 | 7531 | 1623 | 1623 | 21.23% | 21.55% | 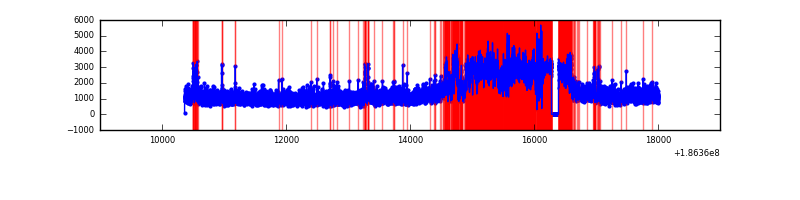 |
Top three noisy pixels from each quadrant. If the there are fewer than three noisy pixels in the level2.evt file, extra rows are filled as -1
| Pixel properties | Quadrant properties | ||||||
|---|---|---|---|---|---|---|---|
| Quadrant | DetID | PixID | Counts | Sigma | Mean | Median | Sigma |
| A | 15 | 127 | 95064 | 160.11 | 2389 | 2406 | 578.7 |
| A | 11 | 79 | 10317 | 13.67 | 2389 | 2406 | 578.7 |
| A | 3 | 111 | 7996 | 9.66 | 2389 | 2406 | 578.7 |
| B | 3 | 0 | 1472001 | 2556.64 | 2445 | 2457 | 574.8 |
| B | 0 | 87 | 566091 | 980.58 | 2445 | 2457 | 574.8 |
| B | 0 | 220 | 142025 | 242.81 | 2445 | 2457 | 574.8 |
| C | 9 | 83 | 337821 | 522.3 | 2281 | 2363 | 642.3 |
| C | 9 | 54 | 50342 | 74.7 | 2281 | 2363 | 642.3 |
| C | 3 | 111 | 34179 | 49.54 | 2281 | 2363 | 642.3 |
| D | 13 | 73 | 2419131 | 3768.99 | 2051 | 2117 | 641.3 |
| D | 12 | 188 | 948608 | 1475.92 | 2051 | 2117 | 641.3 |
| D | 2 | 16 | 122621 | 187.91 | 2051 | 2117 | 641.3 |
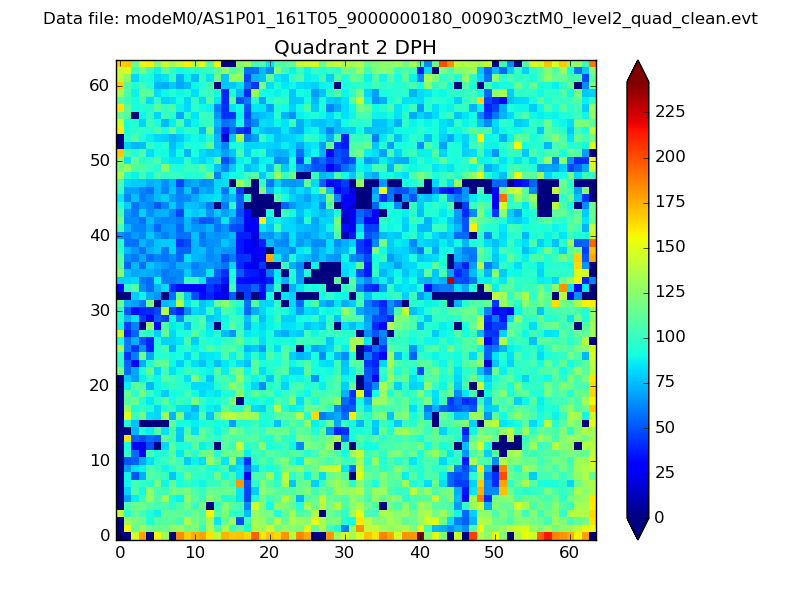
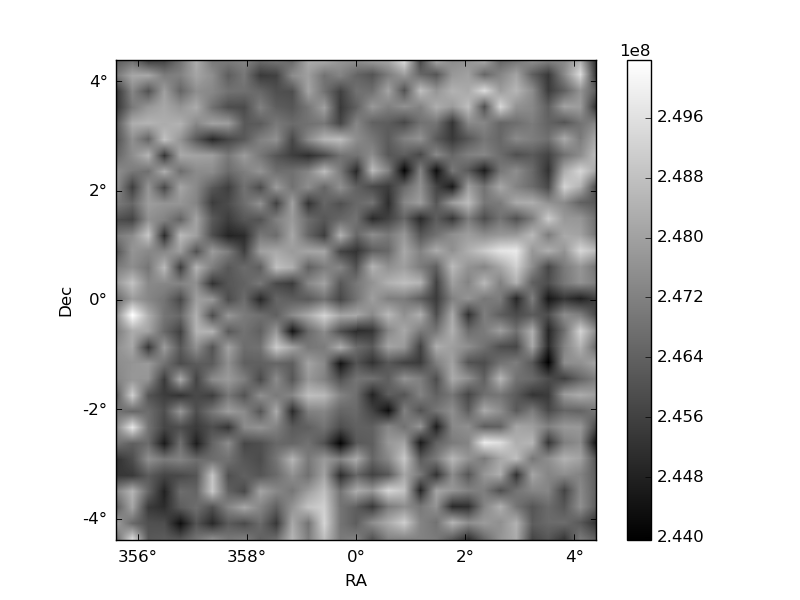
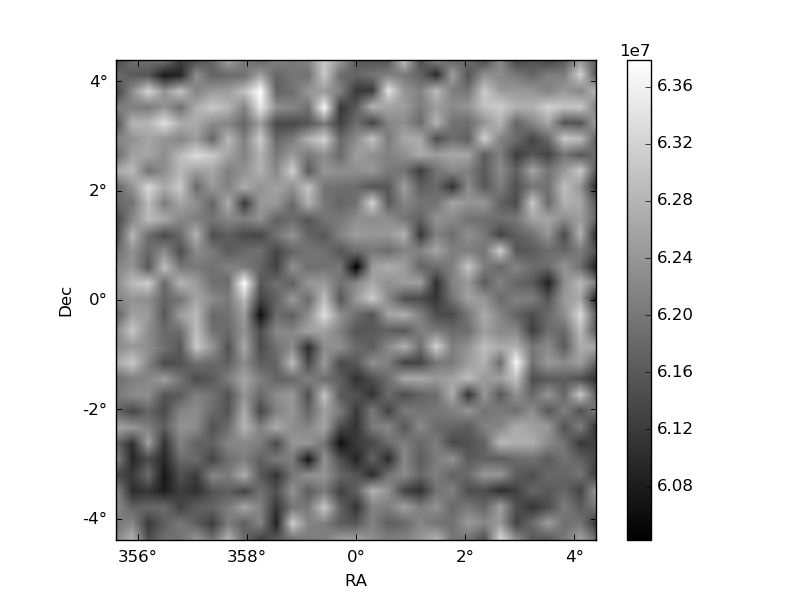
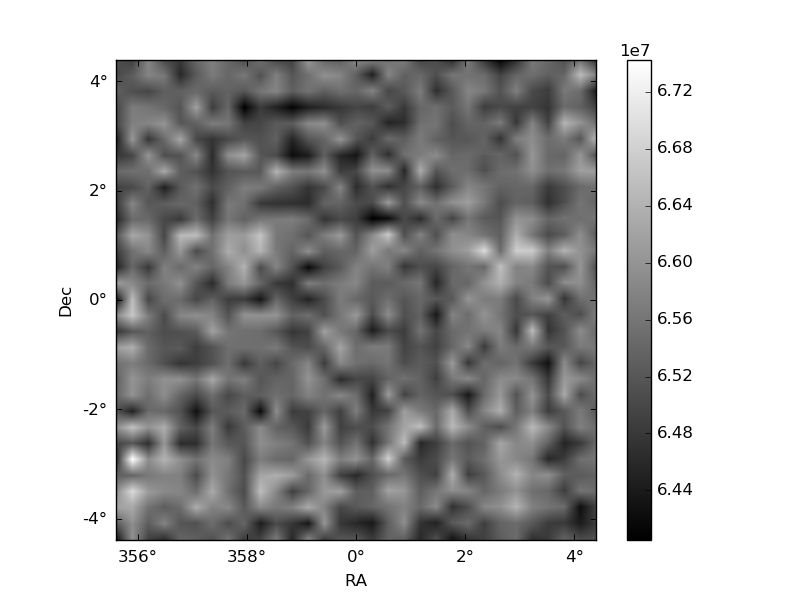
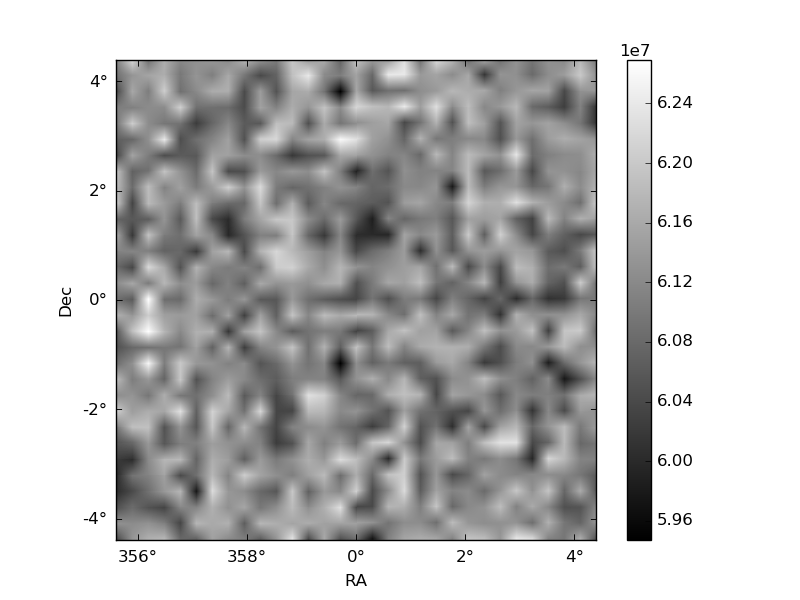
Histogram calculated using DETX and DETY for each event in the final _common_clean file
| Quadrant A | 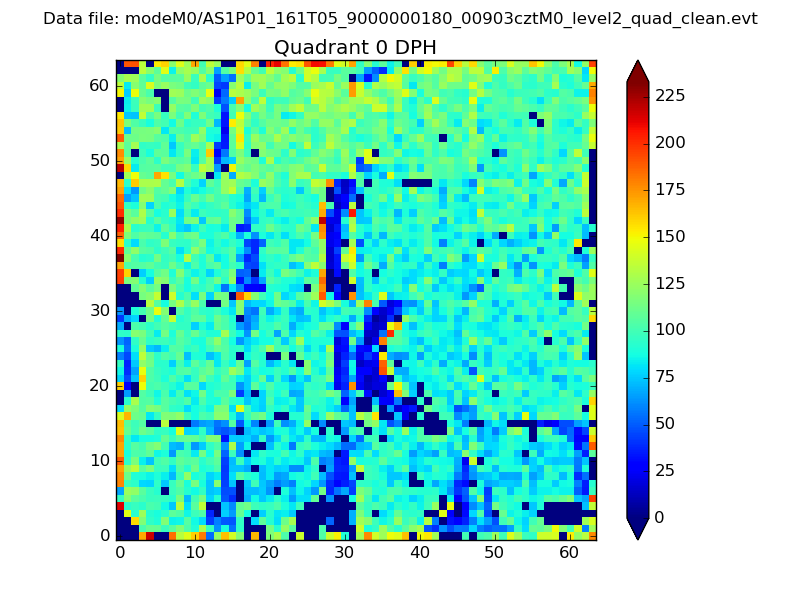 |
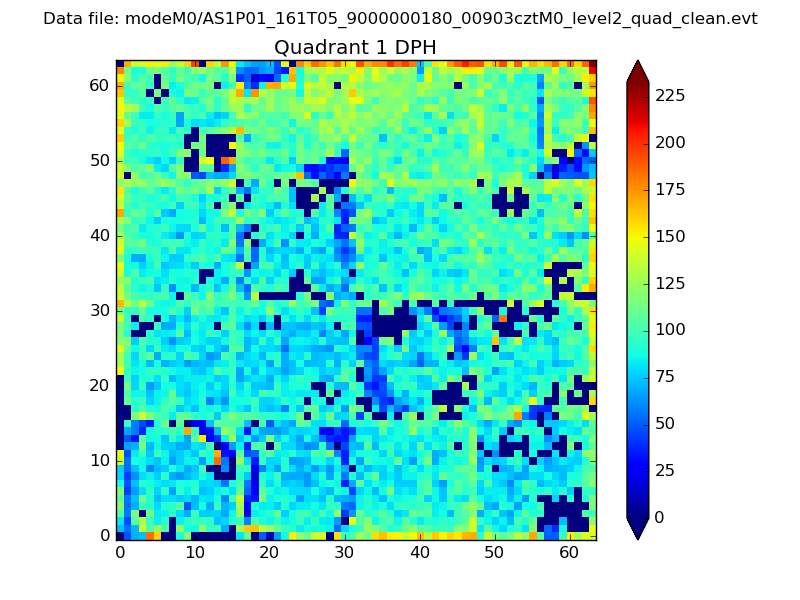 |
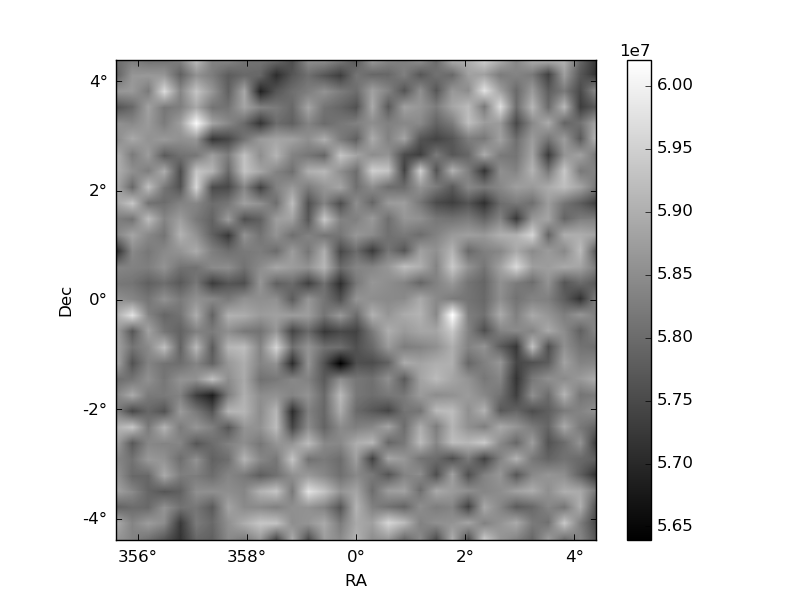
Quadrant B |
|---|---|---|---|
| Quadrant D | 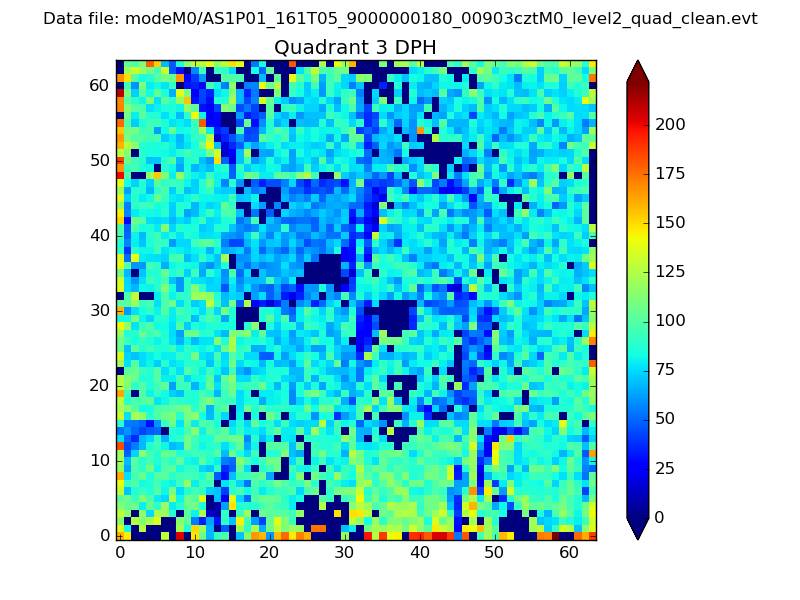 |
 |
Quadrant C |
| Plot type | Count rate plots | Images |
|---|---|---|
| Comparison with Poisson distribution Blue bars denote a histogram of data divided into 1 sec bins. Red curve is a Poisson curve with rate = median count rate of data. |
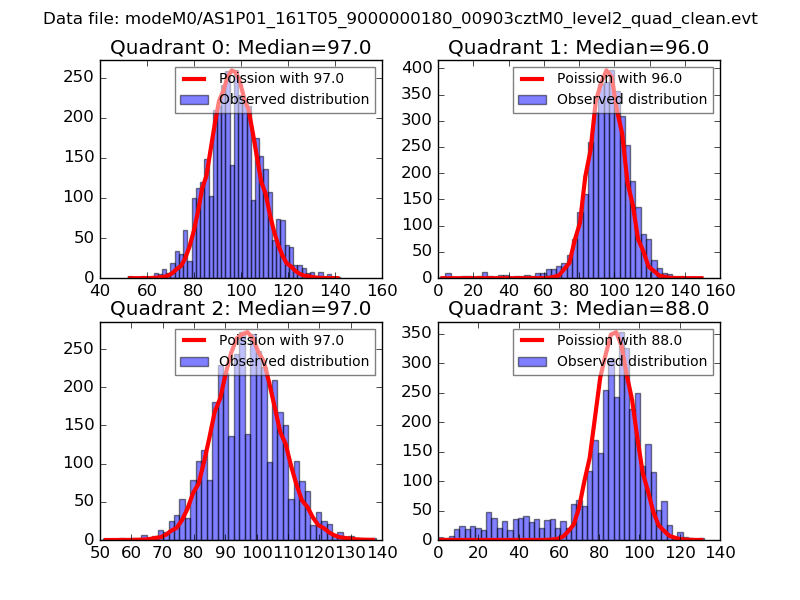 |
 |
| Quadrant-wise count rates Data is divided into 100 sec bins |
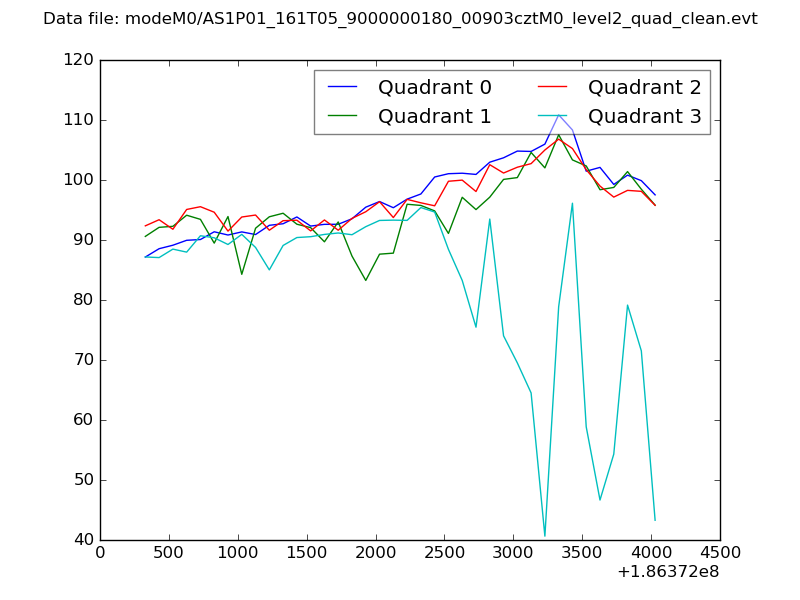 |
|
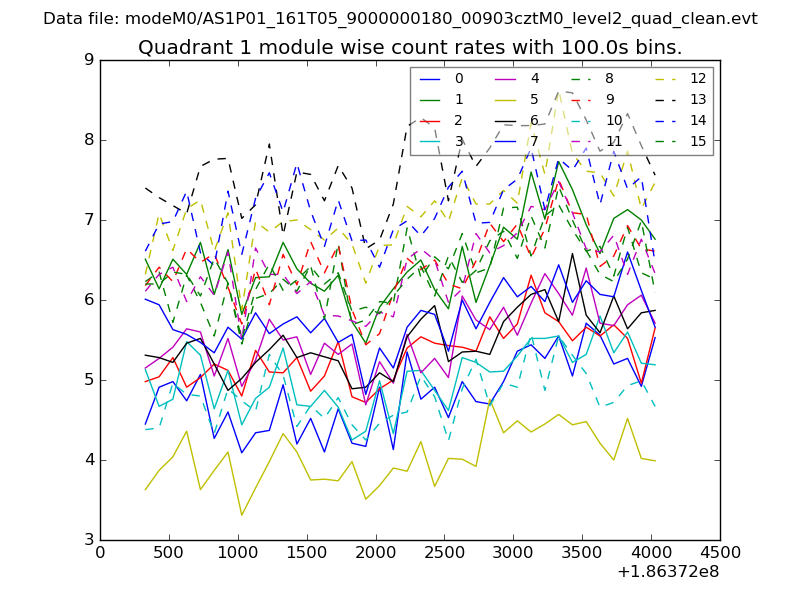
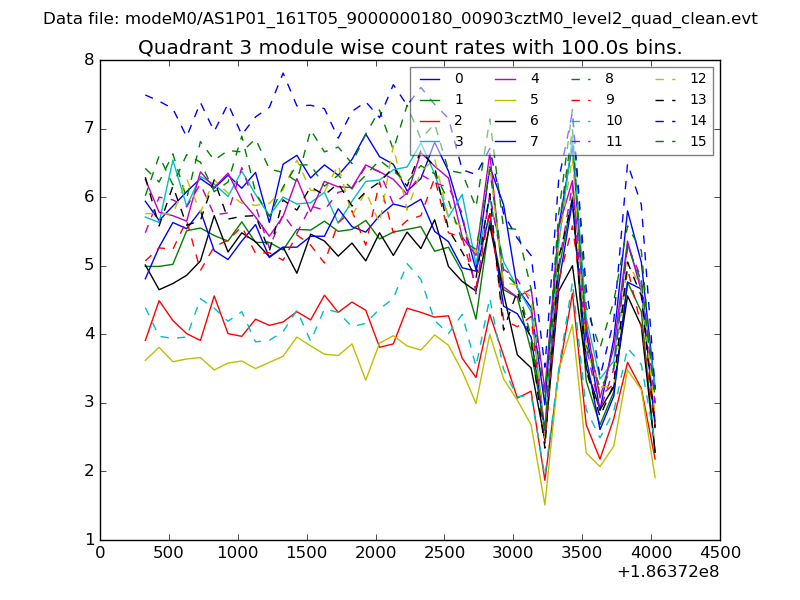
| Module-wise count rates for Quadrant A Data is divided into 100 sec bins |
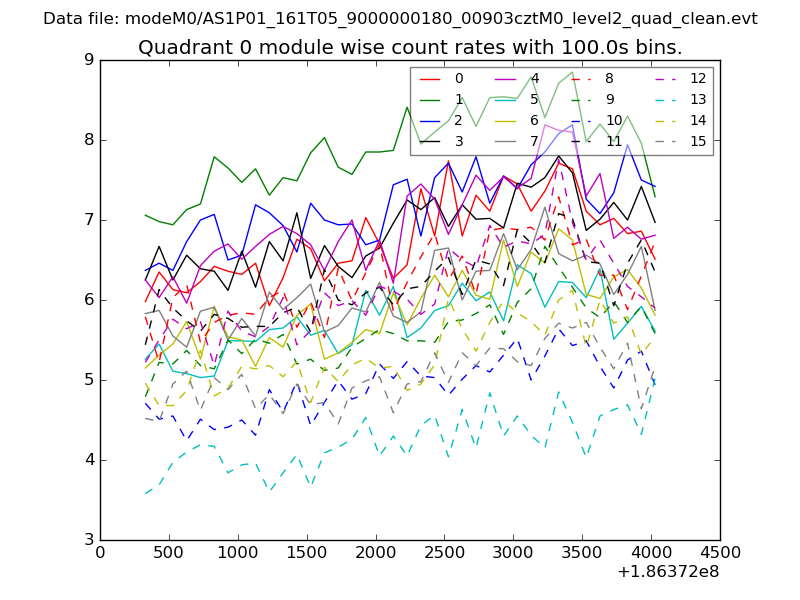 |
 |
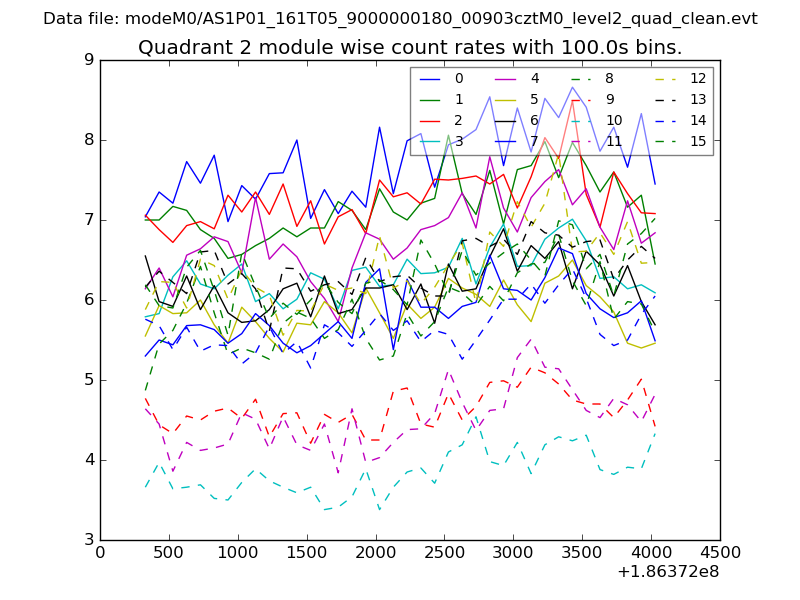
| Module-wise count rates for Quadrant B Data is divided into 100 sec bins |
 |
 |
| Module-wise count rates for Quadrant C Data is divided into 100 sec bins |
 |
 |
| Module-wise count rates for Quadrant D Data is divided into 100 sec bins |
 |
 |
| Parameter | Plot |
|---|---|
| CZT HV Monitor | 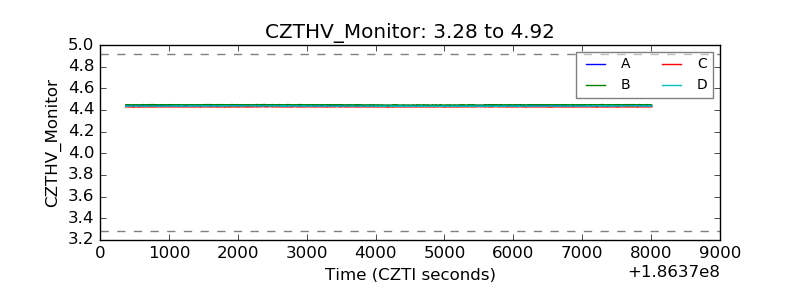 |
| D_VDD | 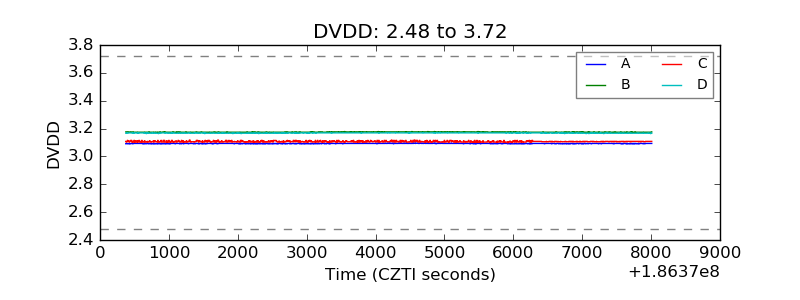 |
| Temperature 1 | 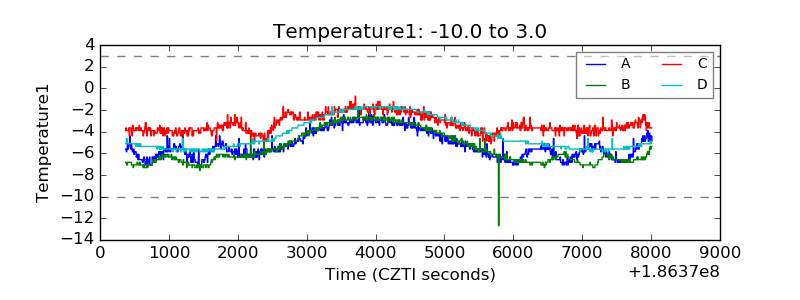 |
| Veto HV Monitor | 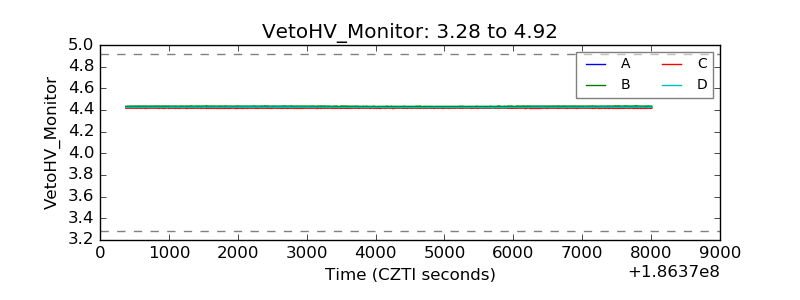 |
| Veto LLD | 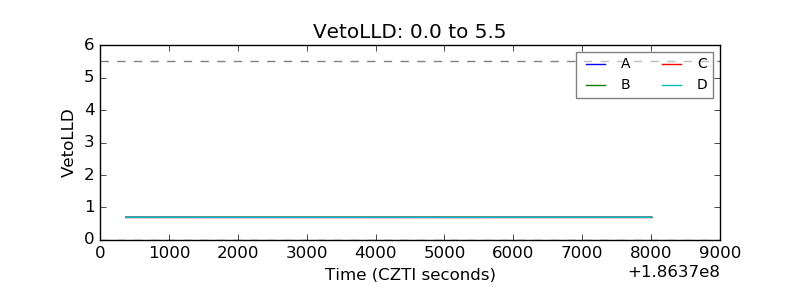 |
| Alpha Counter | 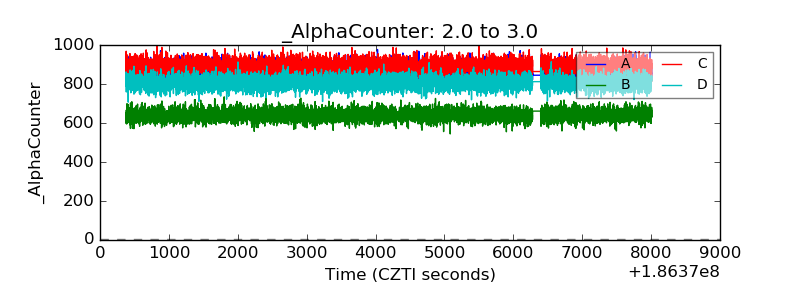 |
| _CPM_Rate | 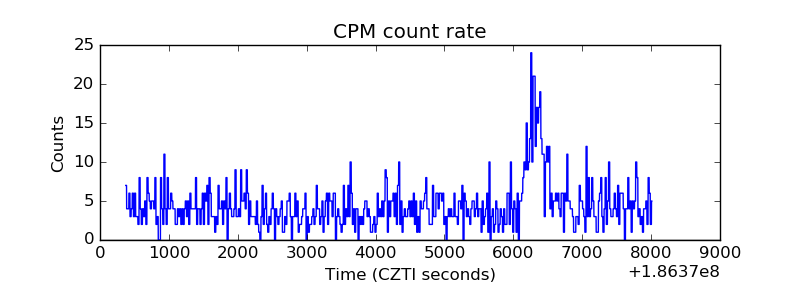 |
| CZT Counter | 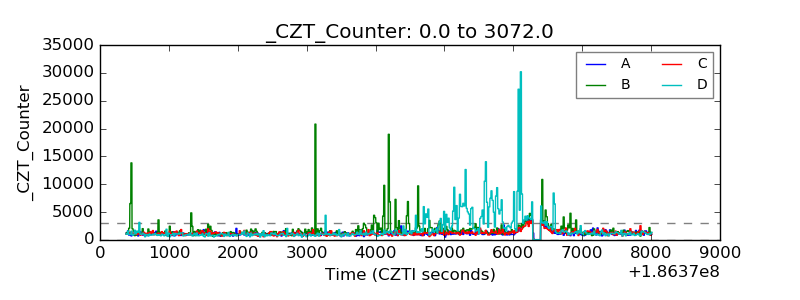 |
| +2.5 Volts monitor |  |
| +5 Volts monitor | 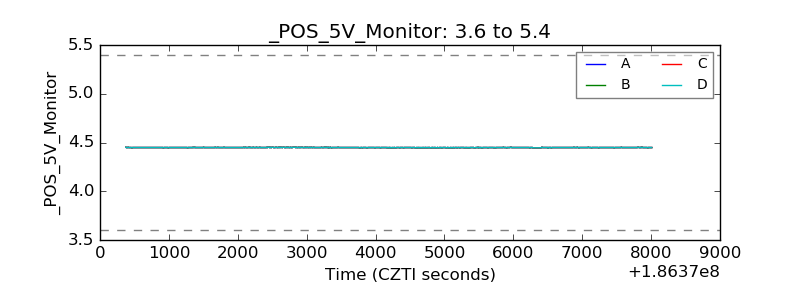 |
| _ROLL_ROT | 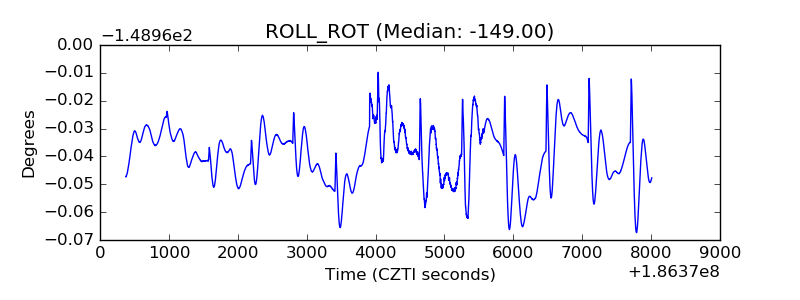 |
| _Roll_DEC | 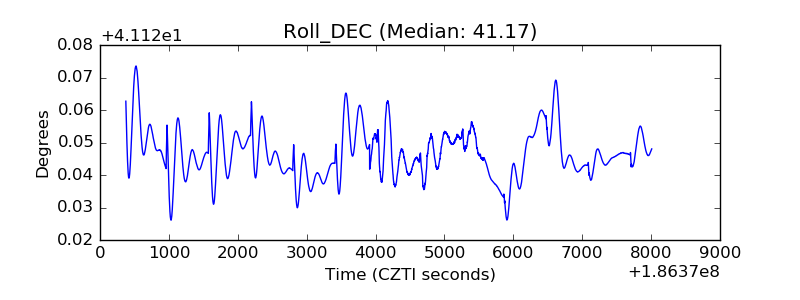 |
| _Roll_RA | 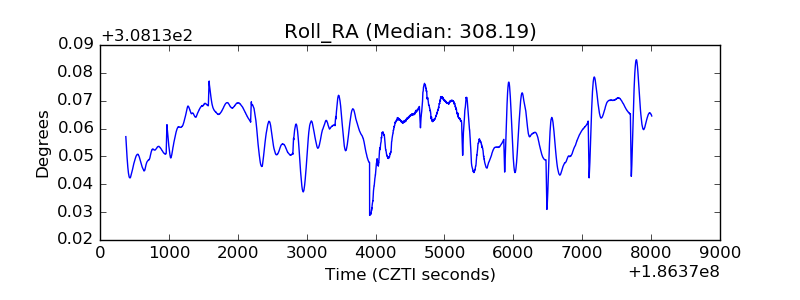 |
| Veto Counter | 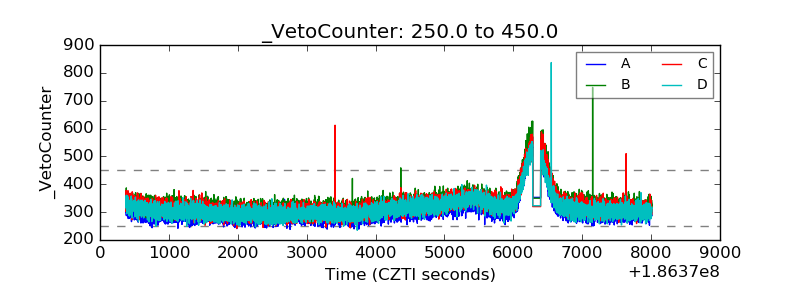 |