| Param | Original file | Final file |
|---|---|---|
| Filename | modeM0/AS1P01_161T05_9000000180_00904cztM0_level2.evt | modeM0/AS1P01_161T05_9000000180_00904cztM0_level2_quad_clean.evt |
| Size (bytes) | 512,994,240 | 30,890,880 |
| Size | 489.2 MB | 29.5 MB |
| Events in quadrant A | 3,523,508 | 183,433 |
| Events in quadrant B | 4,303,001 | 173,866 |
| Events in quadrant C | 3,385,950 | 184,602 |
| Events in quadrant D | 4,119,038 | 175,086 |
| Mode SS | |||
|---|---|---|---|
| Quadrant | BADHDUFLAG | Total packets | Discarded packets |
| A | 0 | 62 | 0 |
| B | 0 | 62 | 0 |
| C | 0 | 62 | 0 |
| D | 0 | 62 | 0 |
| Mode M0 | |||
|---|---|---|---|
| Quadrant | BADHDUFLAG | Total packets | Discarded packets |
| A | 0 | 12642 | 0 |
| B | 0 | 15032 | 0 |
| C | 0 | 12242 | 0 |
| D | 0 | 14381 | 0 |
| Quadrant | Total seconds | Saturated seconds | Saturation percentage |
|---|---|---|---|
| A | 3053 | 0 | 0.000000% |
| B | 3053 | 224 | 7.337046% |
| C | 3053 | 2 | 0.065509% |
| D | 3053 | 22 | 0.720603% |
Noise dominated data is calculated using 1-second bins in cleaned event files. If a bin has >2000 counts, and if more than 50% of those come from <1% of pixels, then it is considered to be noise-dominated and hence unusable.
| Quadrant | # 1 sec bins | Bins with >0 counts | Bins with >2000 counts | High rate bins dominated by noise | Noise dominated (total time) | Noise dominated (detector-on time) | Marked lightcurve |
|---|---|---|---|---|---|---|---|
| A | 3053 | 3053 | 38 | 38 | 1.24% | 1.24% | 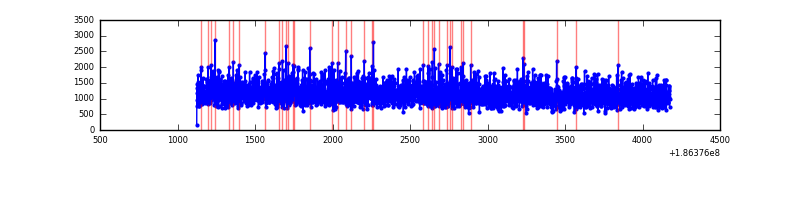 |
| B | 3053 | 3053 | 339 | 339 | 11.10% | 11.10% | 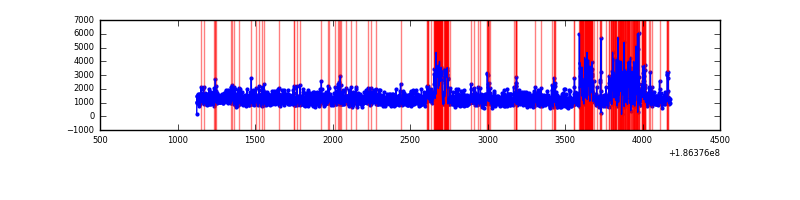 |
| C | 3053 | 3053 | 43 | 43 | 1.41% | 1.41% | 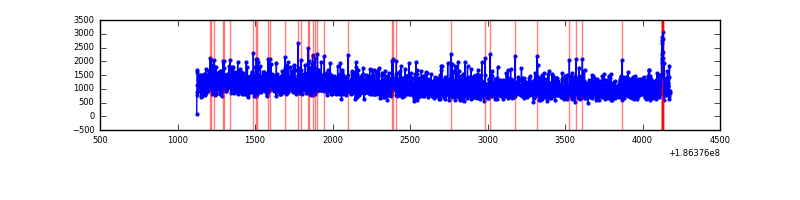 |
| D | 3053 | 3053 | 246 | 246 | 8.06% | 8.06% | 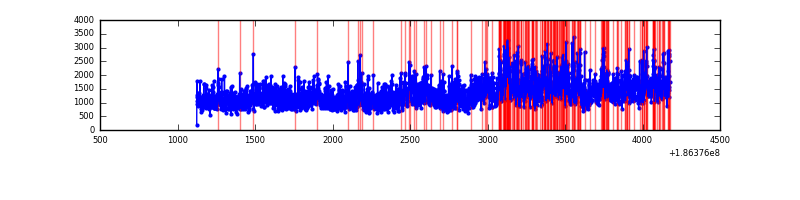 |
Top three noisy pixels from each quadrant. If the there are fewer than three noisy pixels in the level2.evt file, extra rows are filled as -1
| Pixel properties | Quadrant properties | ||||||
|---|---|---|---|---|---|---|---|
| Quadrant | DetID | PixID | Counts | Sigma | Mean | Median | Sigma |
| A | 15 | 127 | 26318 | 113.86 | 910 | 920 | 223.1 |
| A | 8 | 192 | 4872 | 17.72 | 910 | 920 | 223.1 |
| A | 11 | 79 | 3613 | 12.07 | 910 | 920 | 223.1 |
| B | 3 | 0 | 770479 | 3581.28 | 901 | 909 | 214.9 |
| B | 0 | 220 | 36973 | 167.83 | 901 | 909 | 214.9 |
| B | 5 | 249 | 25032 | 112.26 | 901 | 909 | 214.9 |
| C | 9 | 83 | 142296 | 617.18 | 815 | 843 | 229.2 |
| C | 9 | 54 | 23740 | 99.9 | 815 | 843 | 229.2 |
| C | 15 | 241 | 11844 | 48.0 | 815 | 843 | 229.2 |
| D | 12 | 188 | 1060803 | 4193.77 | 806 | 835 | 252.7 |
| D | 13 | 169 | 25436 | 97.33 | 806 | 835 | 252.7 |
| D | 10 | 125 | 10275 | 37.35 | 806 | 835 | 252.7 |
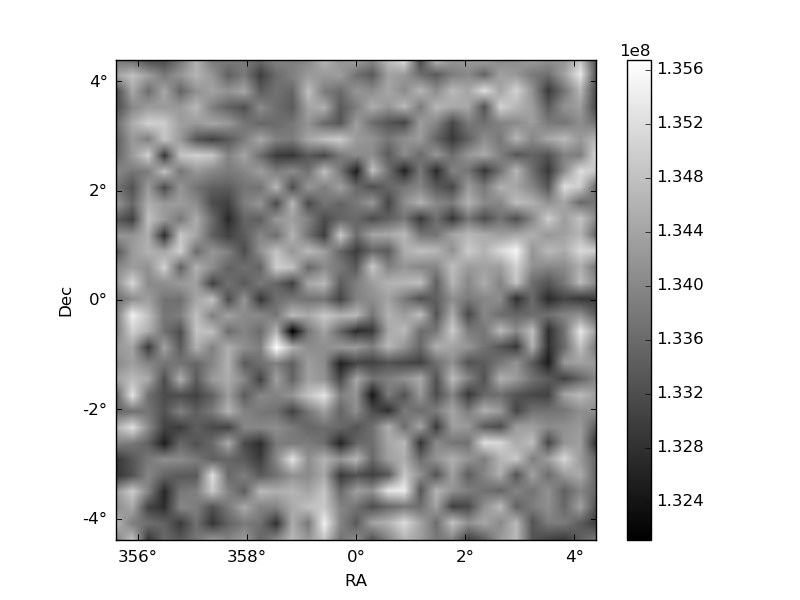
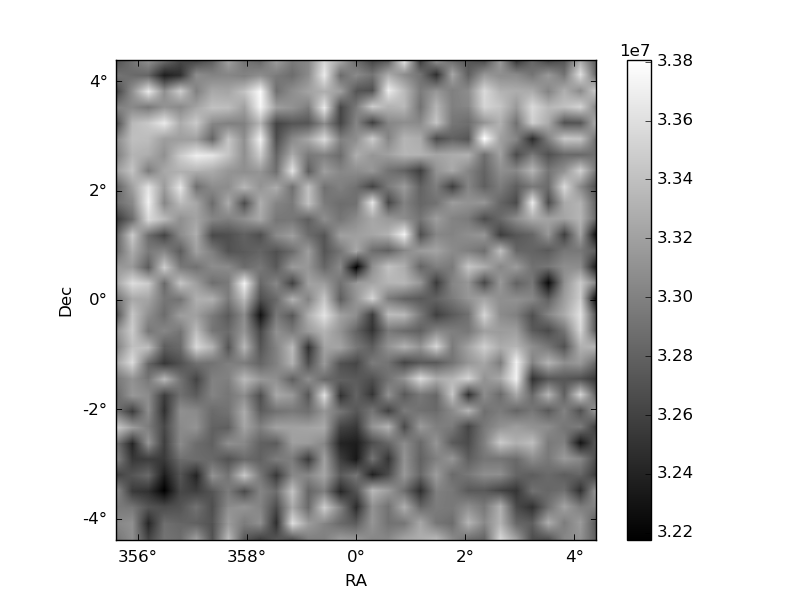
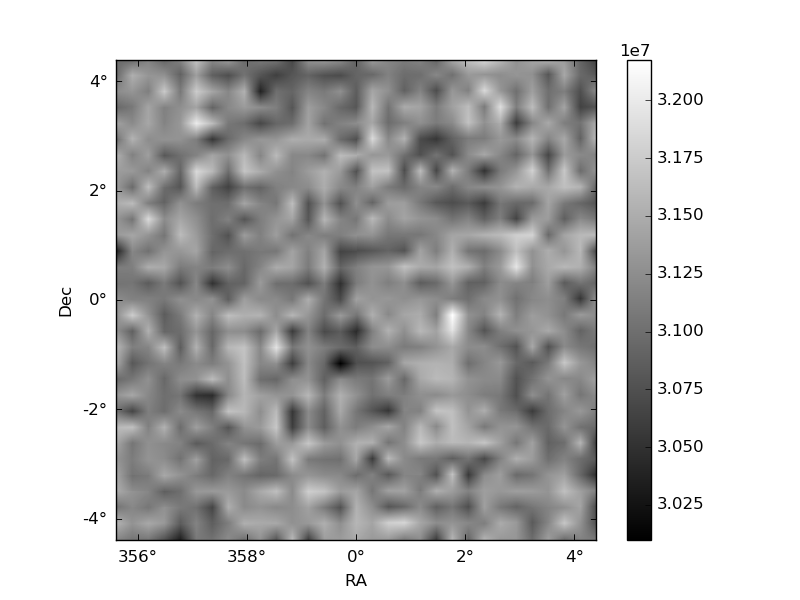
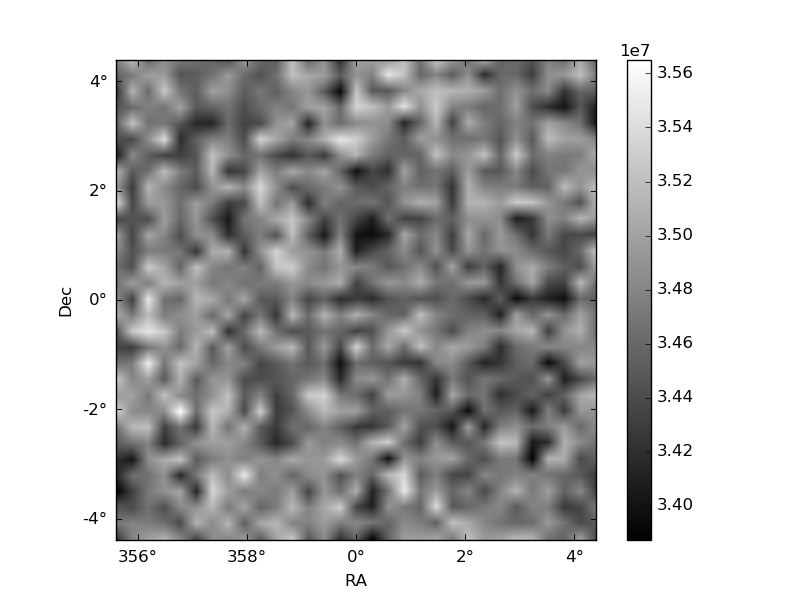
Histogram calculated using DETX and DETY for each event in the final _common_clean file
| Quadrant A | 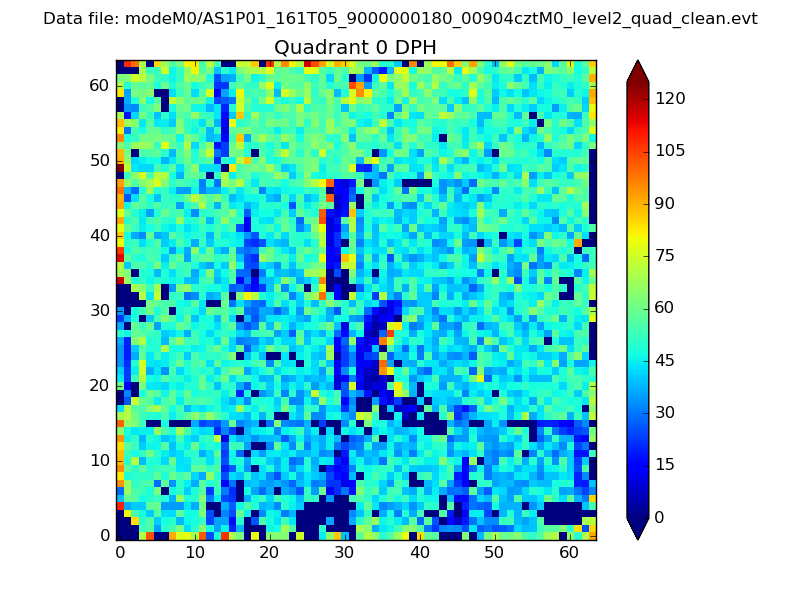 |
 |
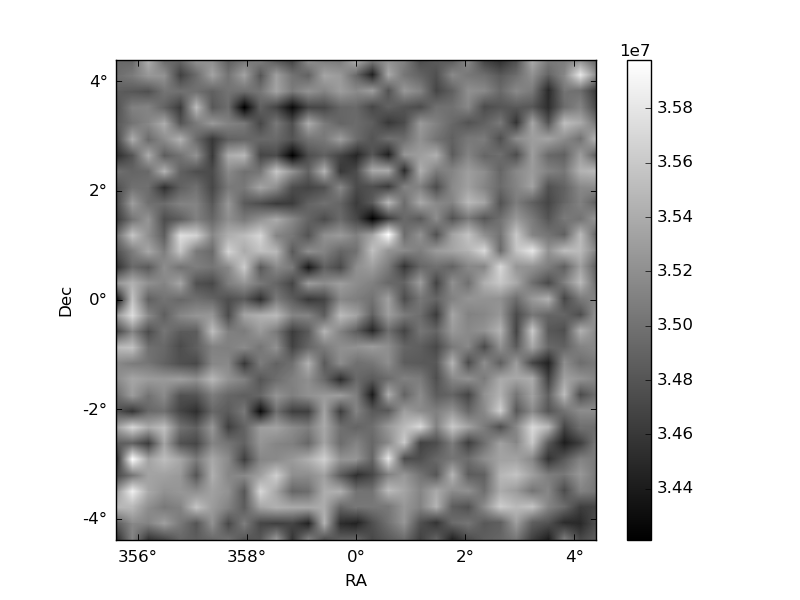
Quadrant B |
|---|---|---|---|
| Quadrant D | 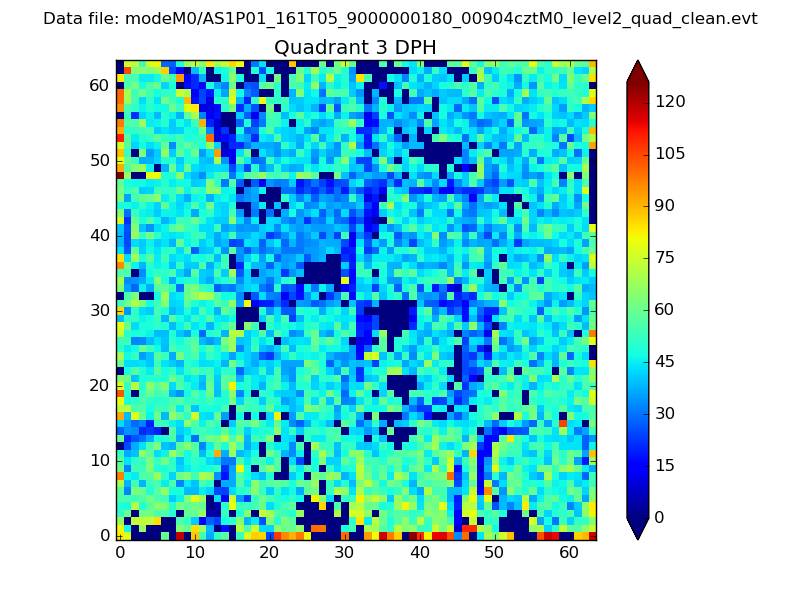 |
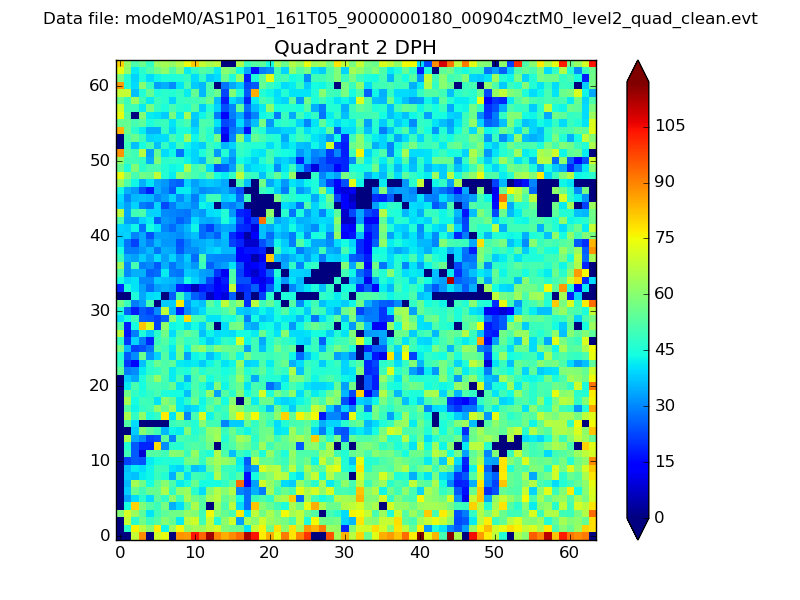 |
Quadrant C |
| Plot type | Count rate plots | Images |
|---|---|---|
| Comparison with Poisson distribution Blue bars denote a histogram of data divided into 1 sec bins. Red curve is a Poisson curve with rate = median count rate of data. |
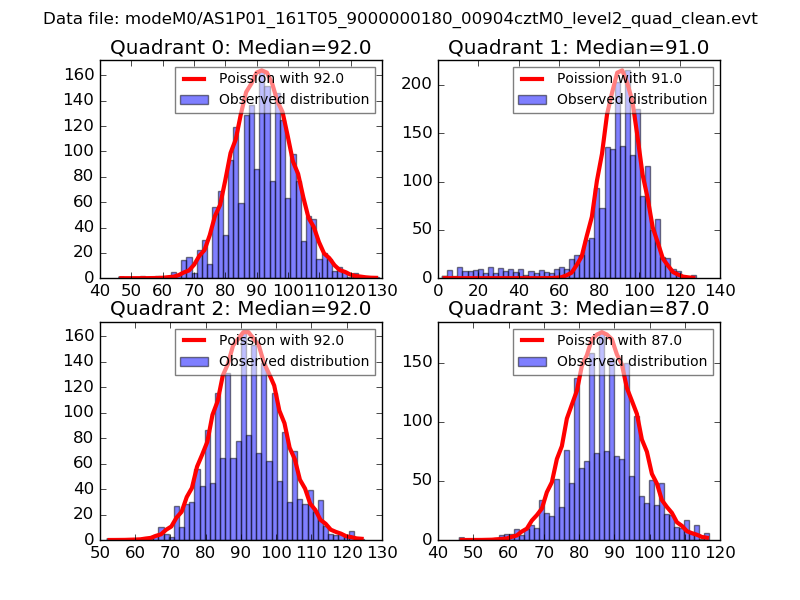 |
 |
| Quadrant-wise count rates Data is divided into 100 sec bins |
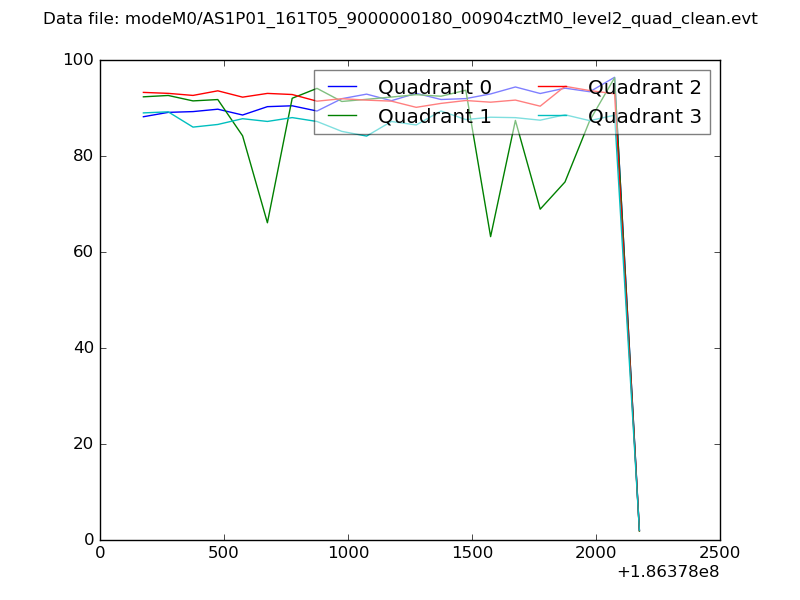 |
|
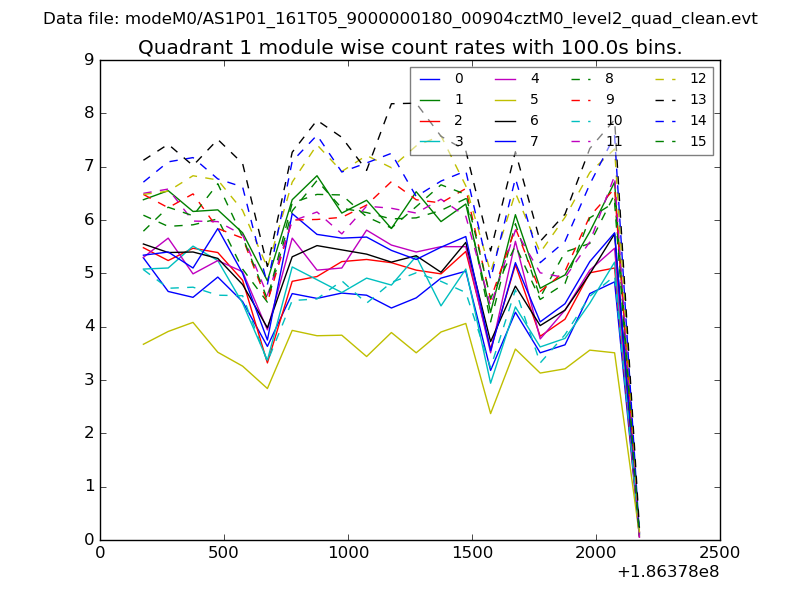
| Module-wise count rates for Quadrant A Data is divided into 100 sec bins |
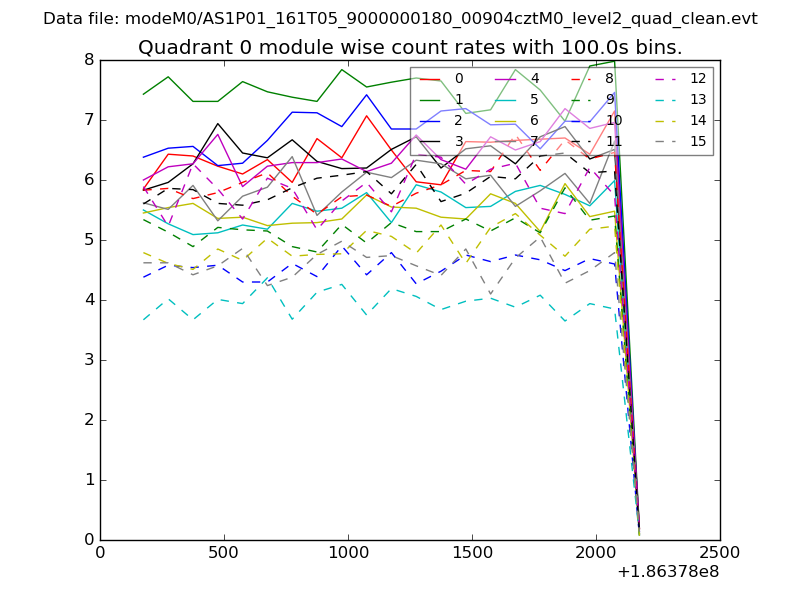 |
 |
| Module-wise count rates for Quadrant B Data is divided into 100 sec bins |
 |
 |
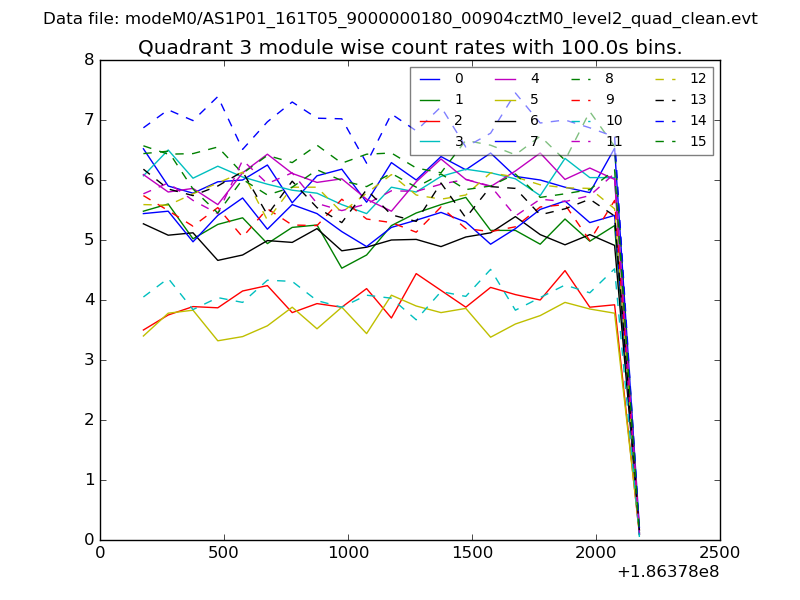
| Module-wise count rates for Quadrant C Data is divided into 100 sec bins |
 |
 |
| Module-wise count rates for Quadrant D Data is divided into 100 sec bins |
 |
 |
| Parameter | Plot |
|---|---|
| CZT HV Monitor | 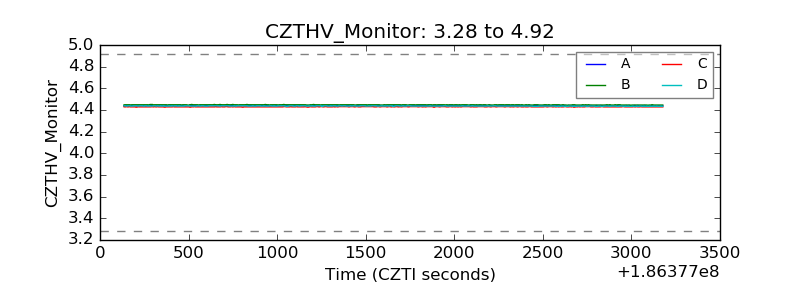 |
| D_VDD | 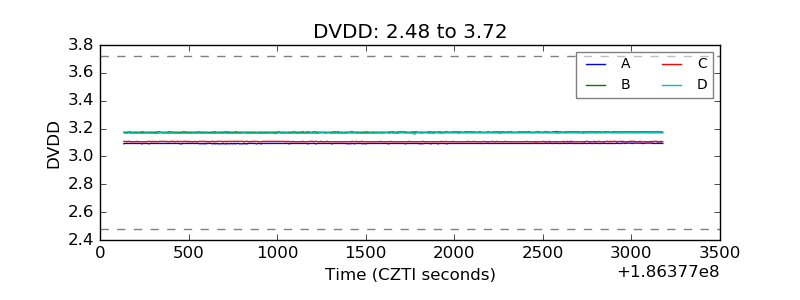 |
| Temperature 1 | 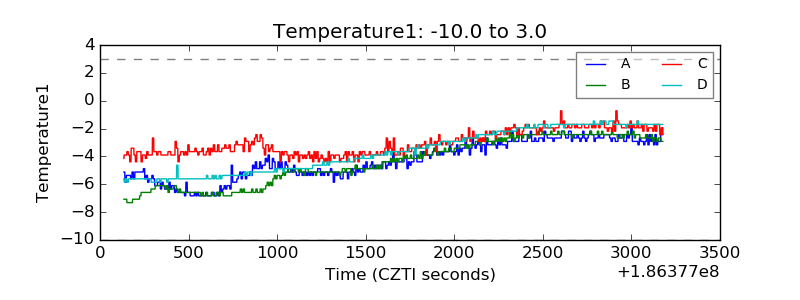 |
| Veto HV Monitor | 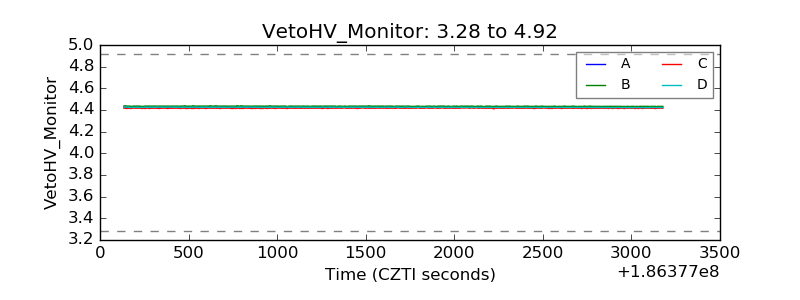 |
| Veto LLD | 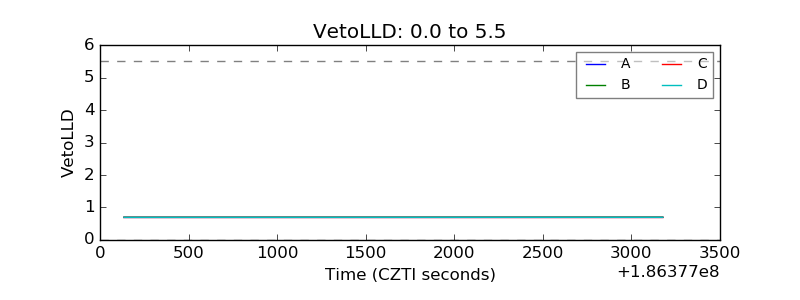 |
| Alpha Counter | 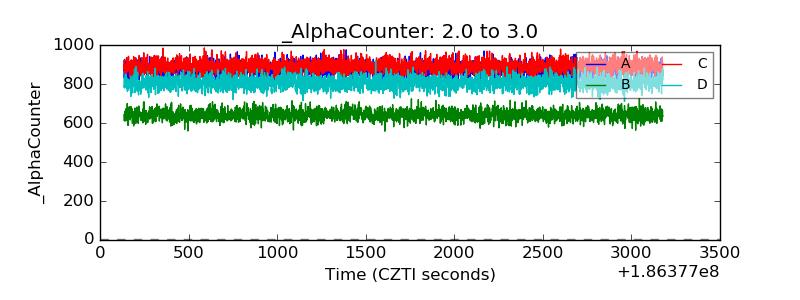 |
| _CPM_Rate | 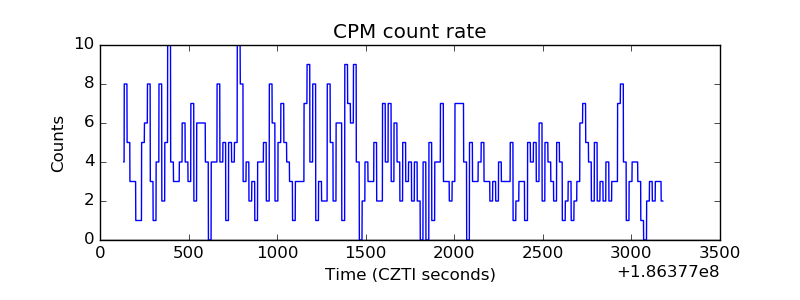 |
| CZT Counter | 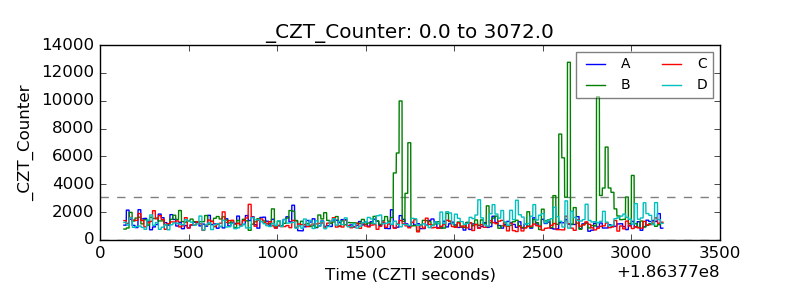 |
| +2.5 Volts monitor |  |
| +5 Volts monitor |  |
| _ROLL_ROT | 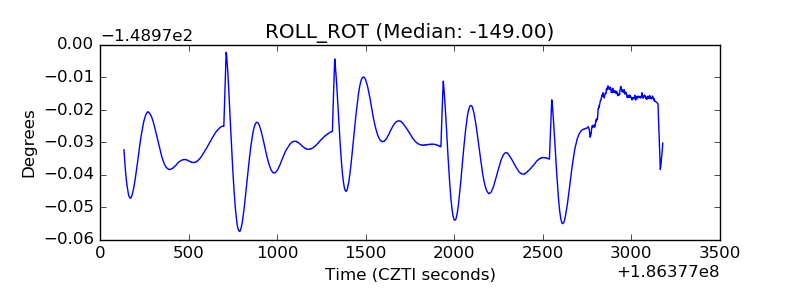 |
| _Roll_DEC | 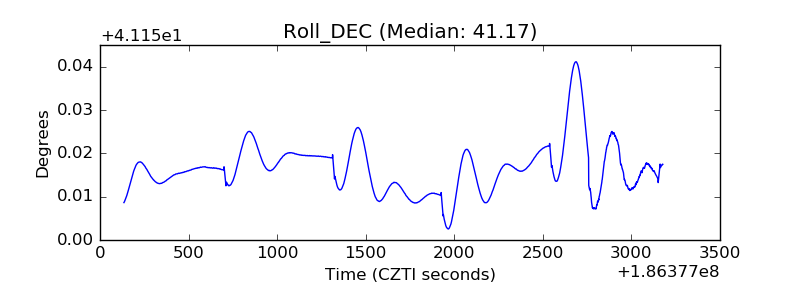 |
| _Roll_RA | 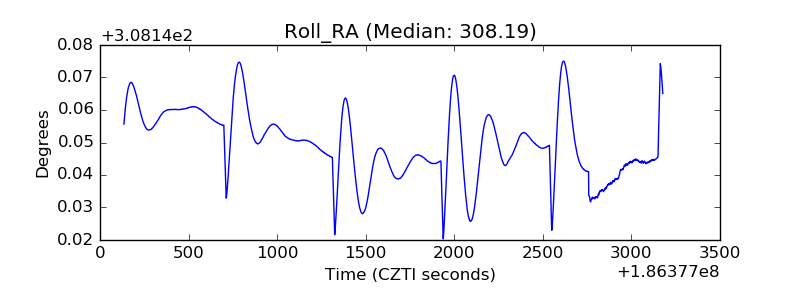 |
| Veto Counter |  |