| Param | Original file | Final file |
|---|---|---|
| Filename | modeM0/AS1P01_161T02_9000000184cztM0_level2.fits | modeM0/AS1P01_161T02_9000000184cztM0_level2_quad_clean.evt |
| Size (bytes) | 381,833,280 | 422,144,640 |
| Size | 364.1 MB | 402.6 MB |
| Events in quadrant A | 2,215,054 | 2,583,958 |
| Events in quadrant B | 2,192,758 | 2,540,509 |
| Events in quadrant C | 2,192,750 | 2,442,828 |
| Events in quadrant D | 1,848,776 | 2,104,470 |
| Mode SS | |||
|---|---|---|---|
| Quadrant | BADHDUFLAG | Total packets | Discarded packets |
| A | 0 | 920 | 0 |
| B | 0 | 920 | 0 |
| C | 0 | 918 | 0 |
| D | 0 | 920 | 0 |
| Mode M0 | |||
|---|---|---|---|
| Quadrant | BADHDUFLAG | Total packets | Discarded packets |
| A | 0 | 196262 | 0 |
| B | 0 | 210350 | 0 |
| C | 0 | 196556 | 0 |
| D | 0 | 211895 | 0 |
| Mode M9 | |||
|---|---|---|---|
| Quadrant | BADHDUFLAG | Total packets | Discarded packets |
| A | 0 | 73 | 0 |
| B | 0 | 73 | 0 |
| C | 0 | 73 | 0 |
| D | 0 | 73 | 0 |
| Quadrant | Total seconds | Saturated seconds | Saturation percentage |
|---|---|---|---|
| A | 45349 | 755 | 1.664866% |
| B | 45340 | 682 | 1.504191% |
| C | 45352 | 276 | 0.608573% |
| D | 45346 | 2530 | 5.579323% |
Noise dominated data is calculated using 1-second bins in cleaned event files. If a bin has >2000 counts, and if more than 50% of those come from <1% of pixels, then it is considered to be noise-dominated and hence unusable.
| Quadrant | # 1 sec bins | Bins with >0 counts | Bins with >2000 counts | High rate bins dominated by noise | Noise dominated (total time) | Noise dominated (detector-on time) | Marked lightcurve |
|---|---|---|---|---|---|---|---|
| A | 55038 | 45366 | 0 | 0 | 0.00% | 0.00% |  |
| B | 55038 | 45358 | 0 | 0 | 0.00% | 0.00% | 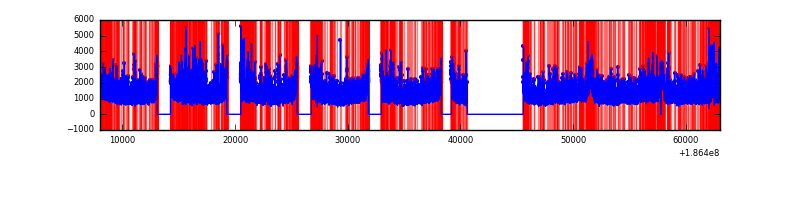 |
| C | 55038 | 45365 | 0 | 0 | 0.00% | 0.00% |  |
| D | 55038 | 45274 | 0 | 0 | 0.00% | 0.00% |  |
Top three noisy pixels from each quadrant. If the there are fewer than three noisy pixels in the level2.evt file, extra rows are filled as -1
| Pixel properties | Quadrant properties | ||||||
|---|---|---|---|---|---|---|---|
| Quadrant | DetID | PixID | Counts | Sigma | Mean | Median | Sigma |
| A | 7 | 110 | 2059 | 11.33 | 573 | 536 | 134.4 |
| A | 0 | 29 | 2031 | 11.12 | 573 | 536 | 134.4 |
| A | 14 | 188 | 1672 | 8.45 | 573 | 536 | 134.4 |
| B | 2 | 9 | 1824 | 12.2 | 578 | 551 | 104.3 |
| B | 14 | 254 | 1447 | 8.59 | 578 | 551 | 104.3 |
| B | 5 | 128 | 1434 | 8.46 | 578 | 551 | 104.3 |
| C | 12 | 241 | 1476 | 6.6 | 579 | 536 | 142.4 |
| C | 9 | 242 | 1452 | 6.43 | 579 | 536 | 142.4 |
| C | 2 | 191 | 1449 | 6.41 | 579 | 536 | 142.4 |
| D | 6 | 231 | 1358 | 7.0 | 527 | 484 | 124.8 |
| D | 1 | 19 | 1352 | 6.95 | 527 | 484 | 124.8 |
| D | 11 | 82 | 1350 | 6.94 | 527 | 484 | 124.8 |
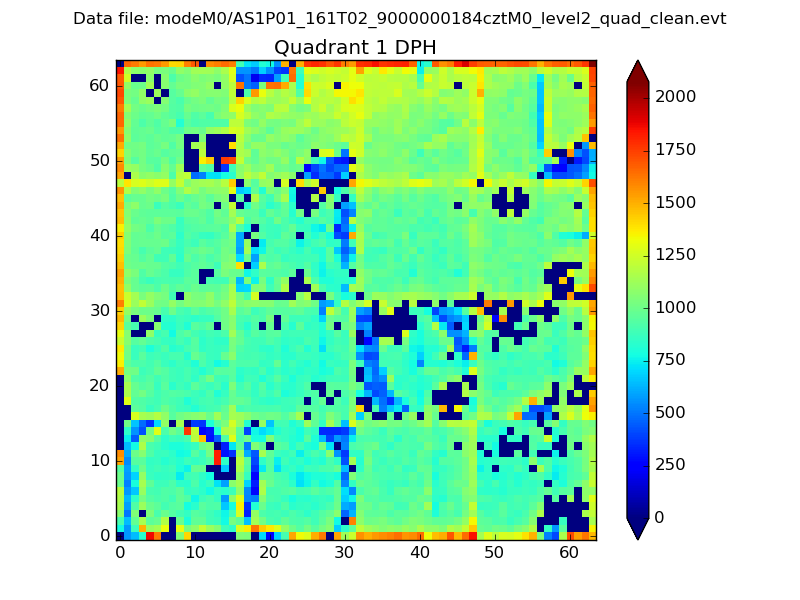
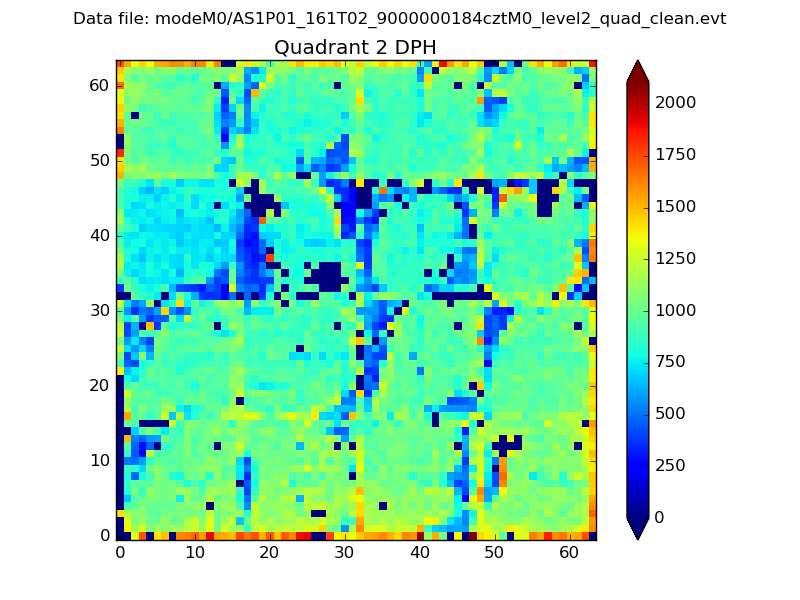
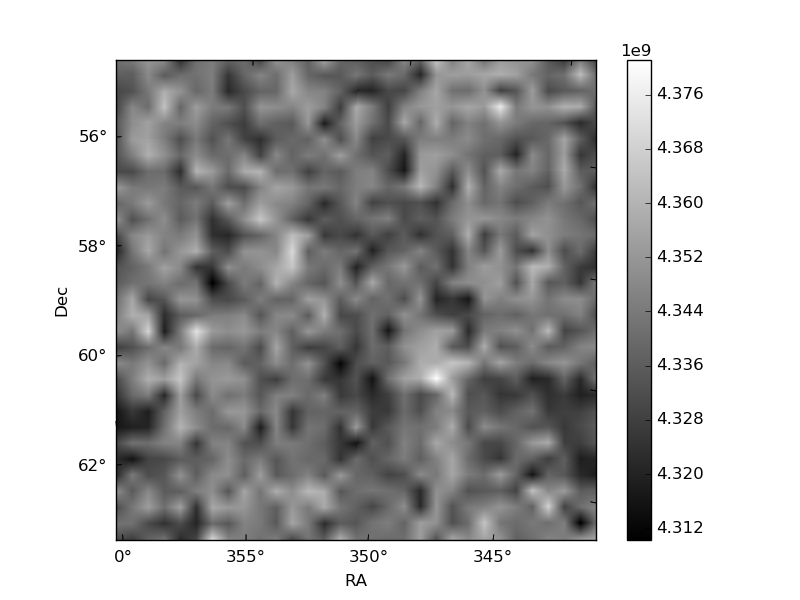
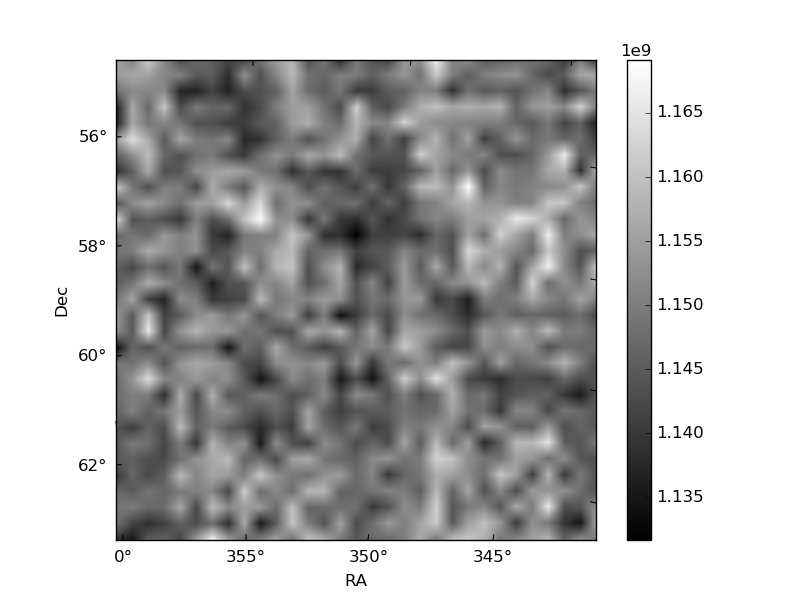
Histogram calculated using DETX and DETY for each event in the final _common_clean file
| Quadrant A |  |
 |
Quadrant B |
|---|---|---|---|
| Quadrant D | 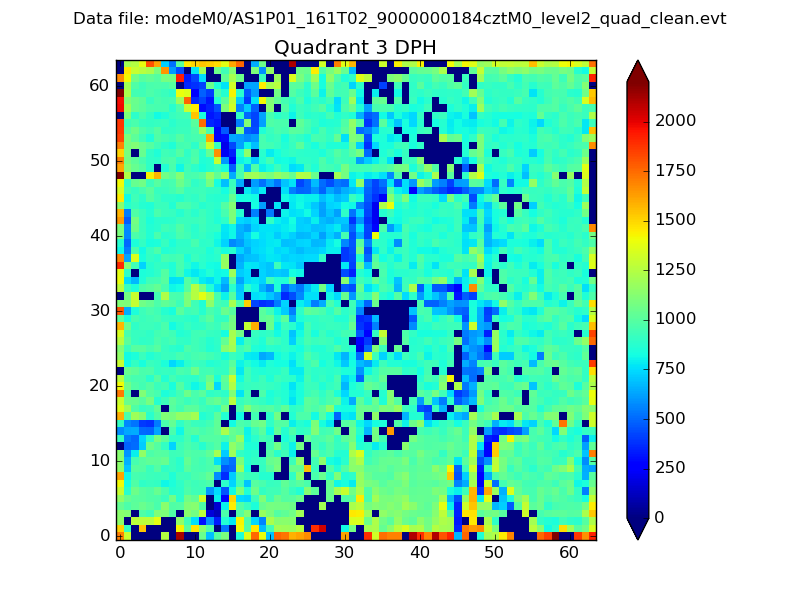 |
 |
Quadrant C |
| Plot type | Count rate plots | Images |
|---|---|---|
| Comparison with Poisson distribution Blue bars denote a histogram of data divided into 1 sec bins. Red curve is a Poisson curve with rate = median count rate of data. |
 |
 |
| Quadrant-wise count rates Data is divided into 100 sec bins |
 |
|
| Module-wise count rates for Quadrant A Data is divided into 100 sec bins |
 |
 |
| Module-wise count rates for Quadrant B Data is divided into 100 sec bins |
 |
 |
| Module-wise count rates for Quadrant C Data is divided into 100 sec bins |
 |
 |
| Module-wise count rates for Quadrant D Data is divided into 100 sec bins |
 |
 |
| Parameter | Plot |
|---|---|
| CZT HV Monitor |  |
| D_VDD |  |
| Temperature 1 |  |
| Veto HV Monitor |  |
| Veto LLD |  |
| Alpha Counter |  |
| _CPM_Rate | 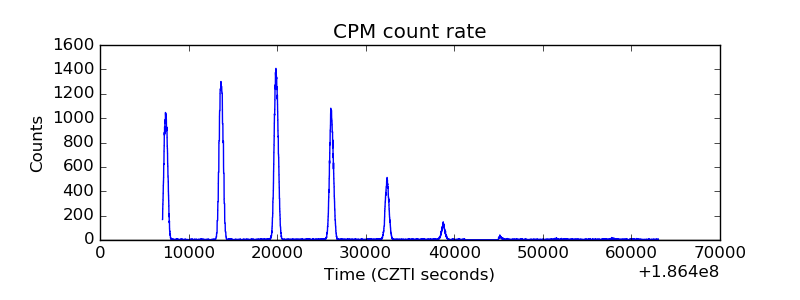 |
| CZT Counter |  |
| +2.5 Volts monitor |  |
| +5 Volts monitor |  |
| _ROLL_ROT |  |
| _Roll_DEC | 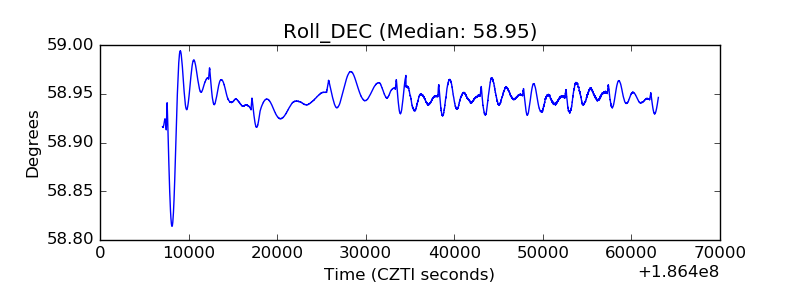 |
| _Roll_RA |  |
| Veto Counter |  |