| Param | Original file | Final file |
|---|---|---|
| Filename | modeM0/AS1P01_161T02_9000000184_00909cztM0_level2.evt | modeM0/AS1P01_161T02_9000000184_00909cztM0_level2_quad_clean.evt |
| Size (bytes) | 274,602,240 | 21,980,160 |
| Size | 261.9 MB | 21.0 MB |
| Events in quadrant A | 3,003,406 | 112,187 |
| Events in quadrant B | 1,914,006 | 156,098 |
| Events in quadrant C | 1,668,143 | 150,208 |
| Events in quadrant D | 1,640,671 | 147,460 |
| Mode SS | |||
|---|---|---|---|
| Quadrant | BADHDUFLAG | Total packets | Discarded packets |
| A | 0 | 26 | 0 |
| B | 0 | 26 | 0 |
| C | 0 | 26 | 0 |
| D | 0 | 26 | 0 |
| Mode M0 | |||
|---|---|---|---|
| Quadrant | BADHDUFLAG | Total packets | Discarded packets |
| A | 0 | 9945 | 0 |
| B | 0 | 6612 | 0 |
| C | 0 | 5894 | 0 |
| D | 0 | 5815 | 0 |
| Mode M9 | |||
|---|---|---|---|
| Quadrant | BADHDUFLAG | Total packets | Discarded packets |
| A | 0 | 10 | 0 |
| B | 0 | 10 | 0 |
| C | 0 | 10 | 0 |
| D | 0 | 10 | 0 |
| Quadrant | Total seconds | Saturated seconds | Saturation percentage |
|---|---|---|---|
| A | 1322 | 602 | 45.537065% |
| B | 1322 | 8 | 0.605144% |
| C | 1321 | 5 | 0.378501% |
| D | 1321 | 2 | 0.151400% |
Noise dominated data is calculated using 1-second bins in cleaned event files. If a bin has >2000 counts, and if more than 50% of those come from <1% of pixels, then it is considered to be noise-dominated and hence unusable.
| Quadrant | # 1 sec bins | Bins with >0 counts | Bins with >2000 counts | High rate bins dominated by noise | Noise dominated (total time) | Noise dominated (detector-on time) | Marked lightcurve |
|---|---|---|---|---|---|---|---|
| A | 1322 | 1322 | 725 | 725 | 54.84% | 54.84% | 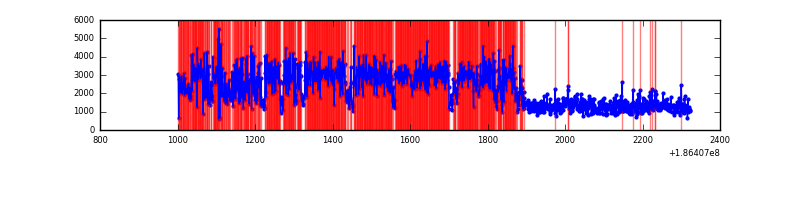 |
| B | 1322 | 1322 | 114 | 114 | 8.62% | 8.62% | 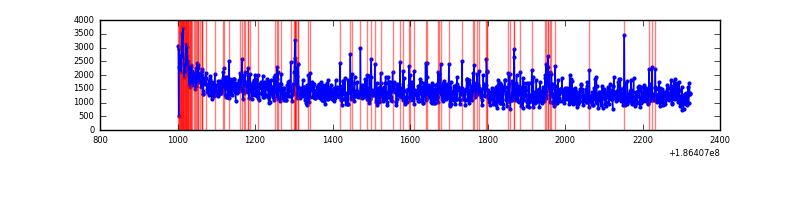 |
| C | 1321 | 1321 | 37 | 37 | 2.80% | 2.80% | 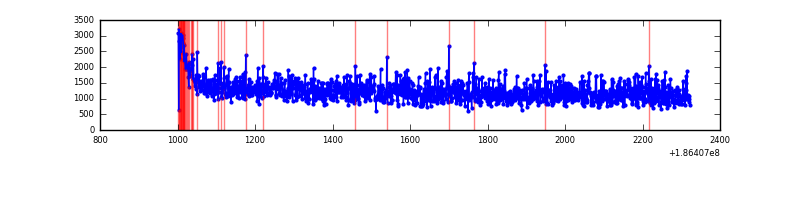 |
| D | 1321 | 1321 | 35 | 35 | 2.65% | 2.65% | 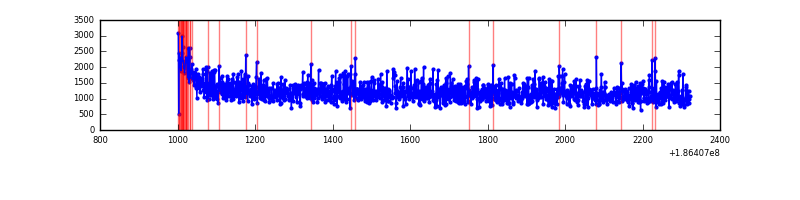 |
Top three noisy pixels from each quadrant. If the there are fewer than three noisy pixels in the level2.evt file, extra rows are filled as -1
| Pixel properties | Quadrant properties | ||||||
|---|---|---|---|---|---|---|---|
| Quadrant | DetID | PixID | Counts | Sigma | Mean | Median | Sigma |
| A | 15 | 233 | 1554228 | 17171.48 | 370 | 373 | 90.5 |
| A | 15 | 127 | 27943 | 304.67 | 370 | 373 | 90.5 |
| A | 11 | 79 | 1939 | 17.31 | 370 | 373 | 90.5 |
| B | 3 | 0 | 23484 | 202.27 | 470 | 474 | 113.8 |
| B | 0 | 220 | 22858 | 196.77 | 470 | 474 | 113.8 |
| B | 5 | 200 | 18973 | 162.62 | 470 | 474 | 113.8 |
| C | 15 | 241 | 11589 | 96.28 | 417 | 431 | 115.9 |
| C | 9 | 83 | 10986 | 91.07 | 417 | 431 | 115.9 |
| C | 7 | 159 | 7620 | 62.03 | 417 | 431 | 115.9 |
| D | 1 | 4 | 23133 | 171.31 | 427 | 441 | 132.5 |
| D | 12 | 188 | 6543 | 46.07 | 427 | 441 | 132.5 |
| D | 2 | 16 | 5536 | 38.46 | 427 | 441 | 132.5 |
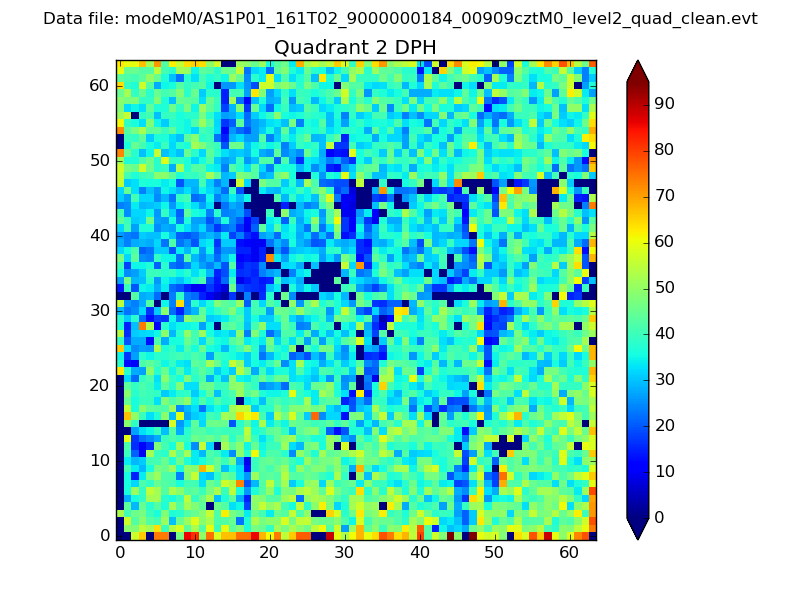
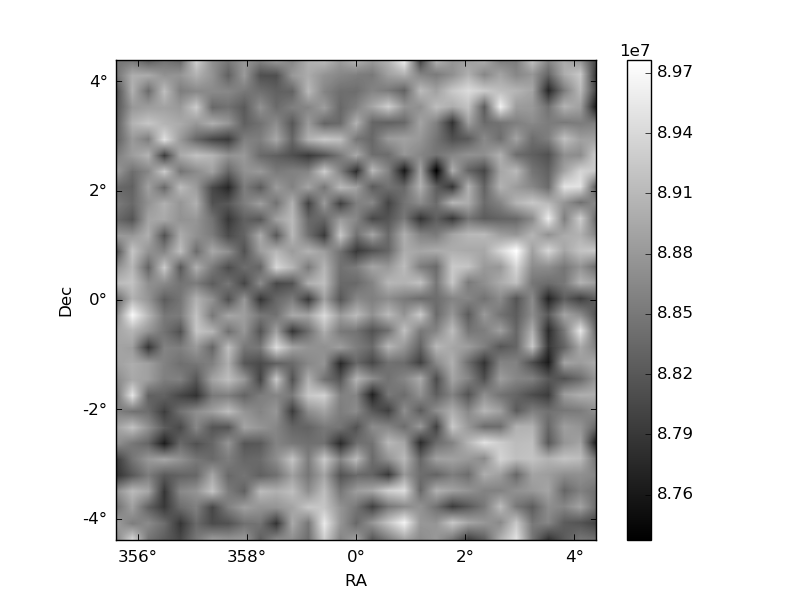
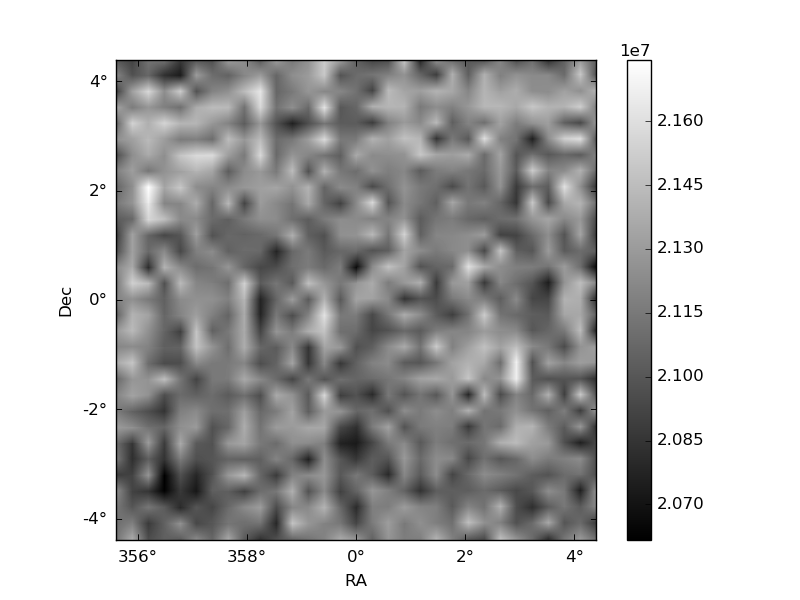
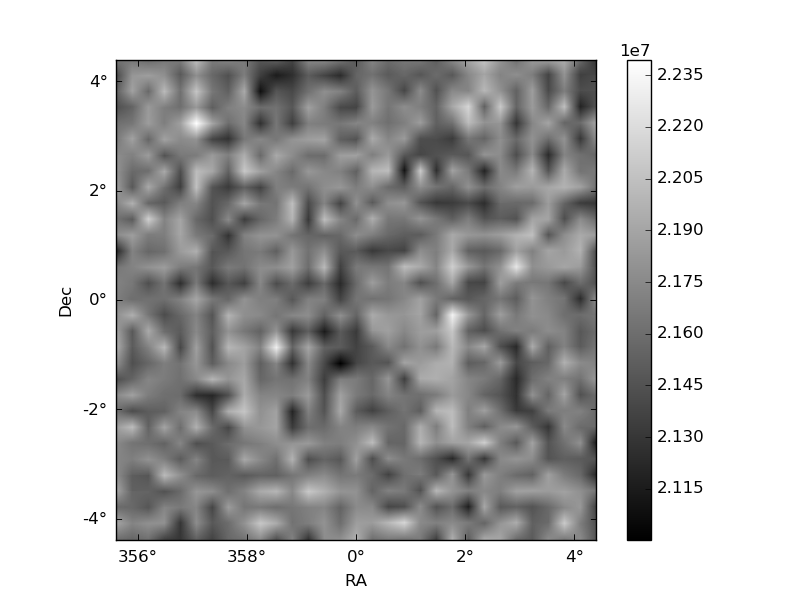
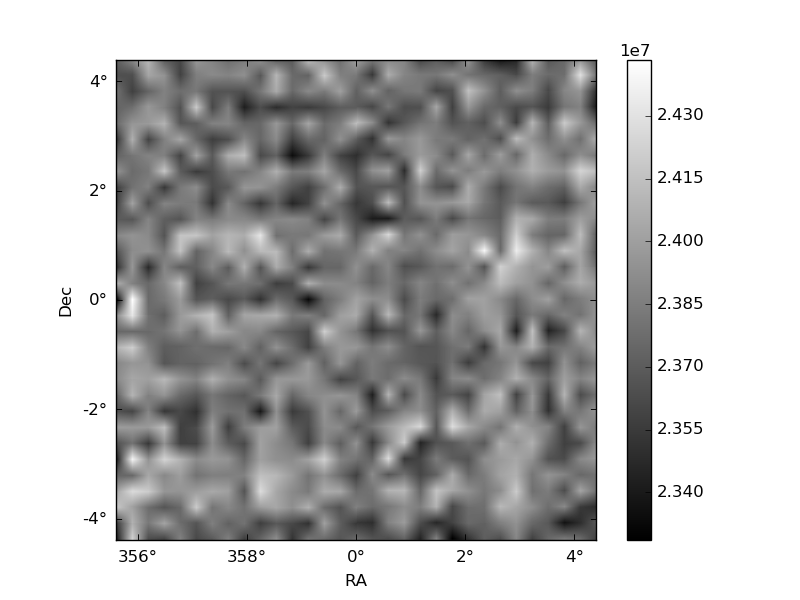
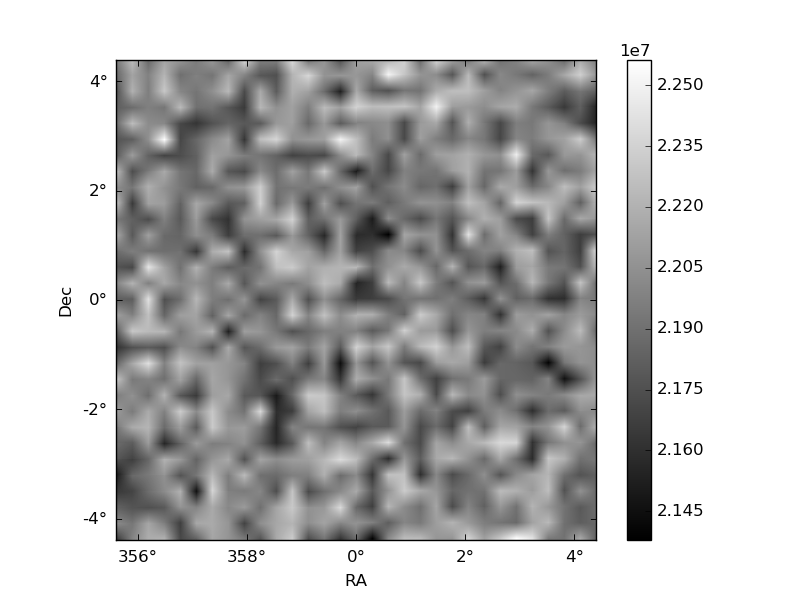
Histogram calculated using DETX and DETY for each event in the final _common_clean file
| Quadrant A | 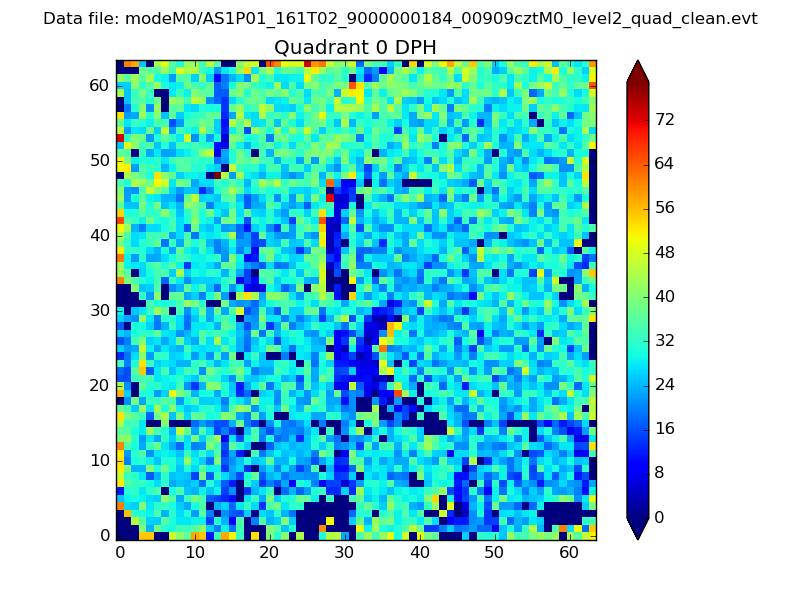 |
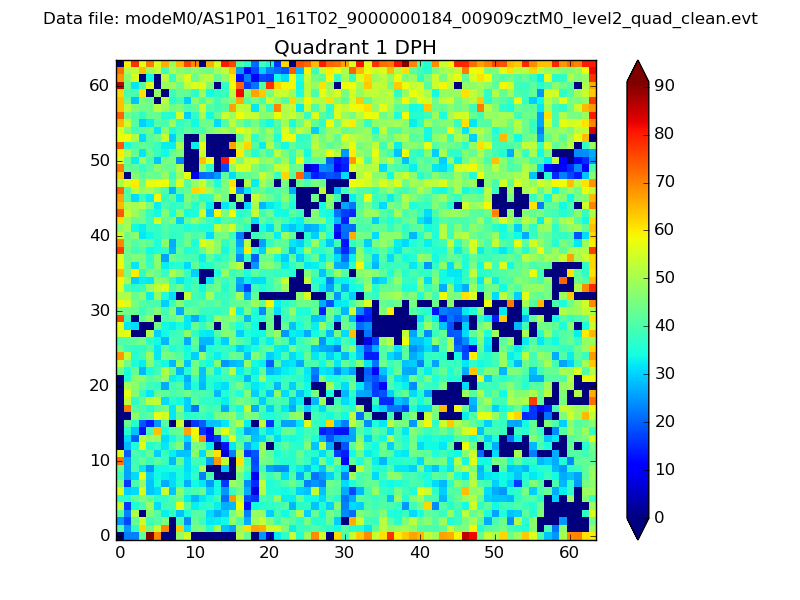 |
Quadrant B |
|---|---|---|---|
| Quadrant D | 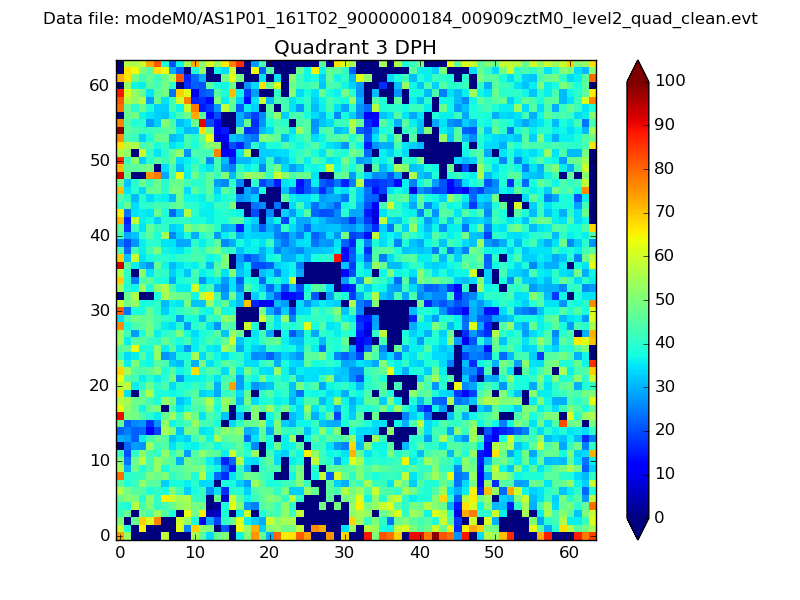 |
 |
Quadrant C |
| Plot type | Count rate plots | Images |
|---|---|---|
| Comparison with Poisson distribution Blue bars denote a histogram of data divided into 1 sec bins. Red curve is a Poisson curve with rate = median count rate of data. |
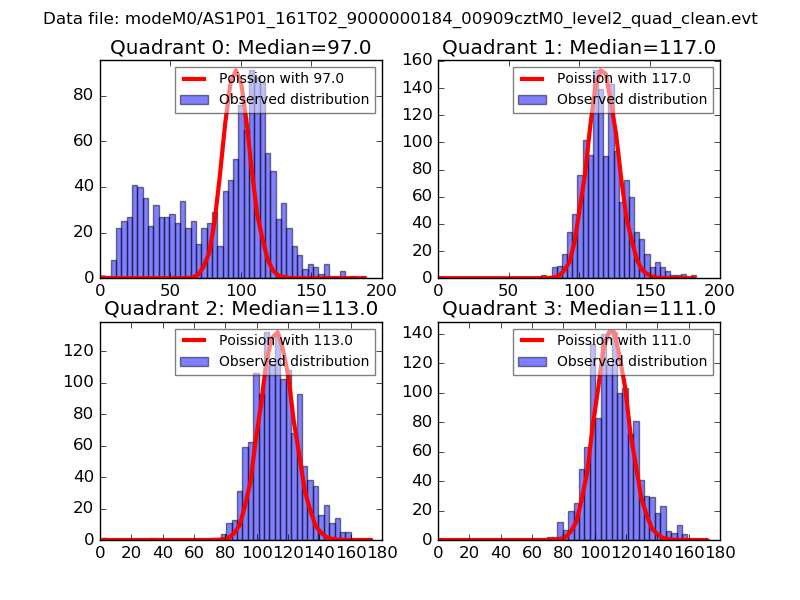 |
 |
| Quadrant-wise count rates Data is divided into 100 sec bins |
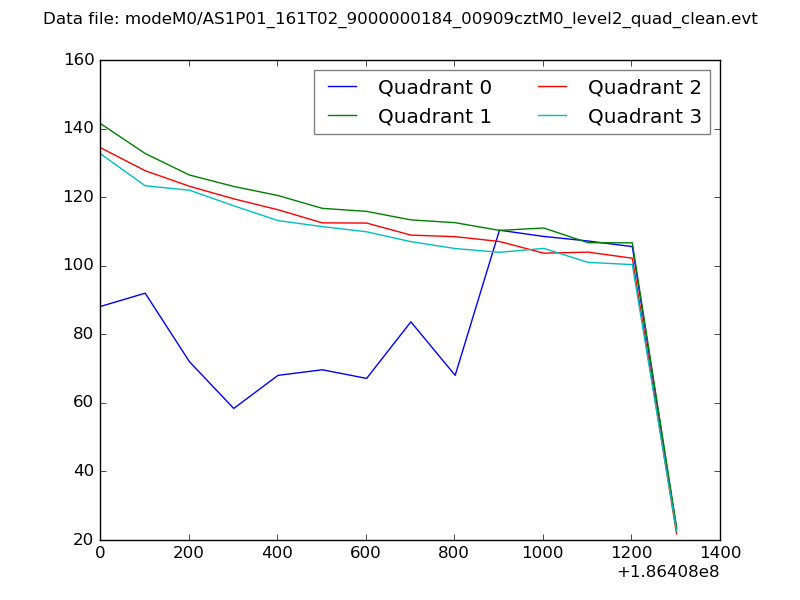 |
|
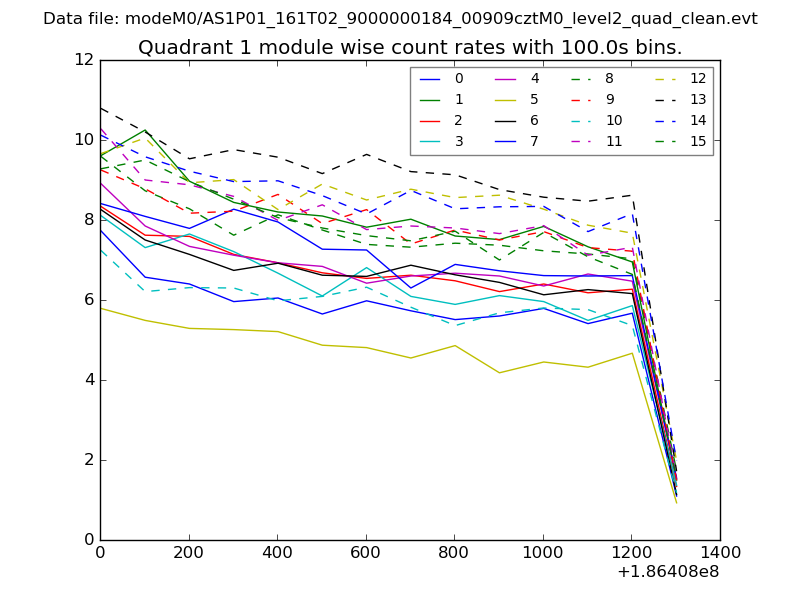
| Module-wise count rates for Quadrant A Data is divided into 100 sec bins |
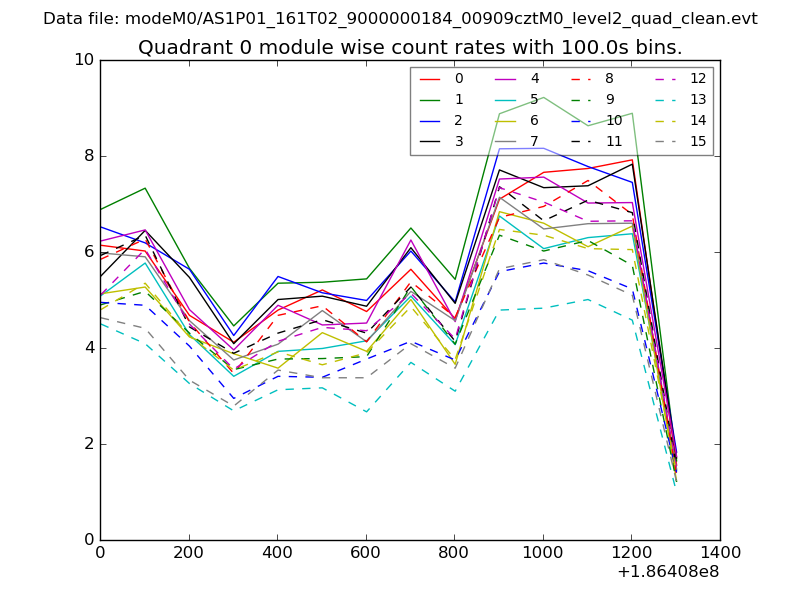 |
 |
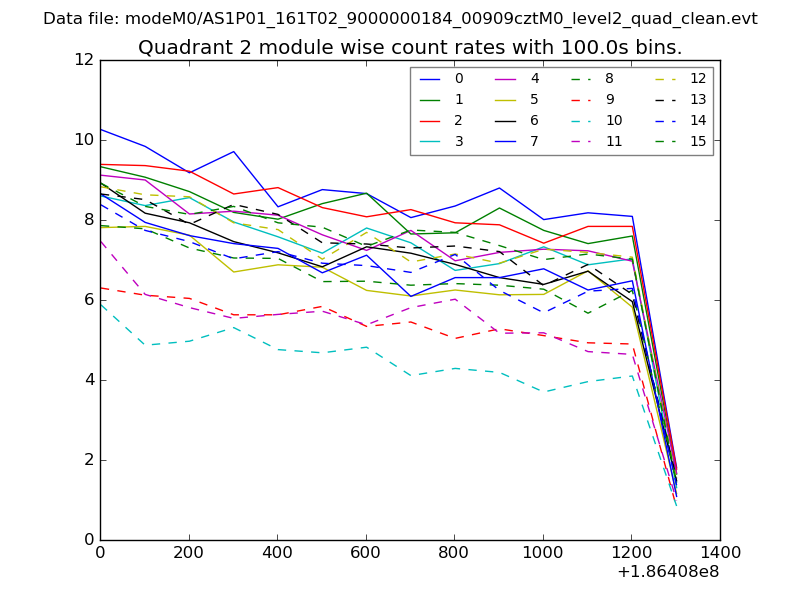
| Module-wise count rates for Quadrant B Data is divided into 100 sec bins |
 |
 |
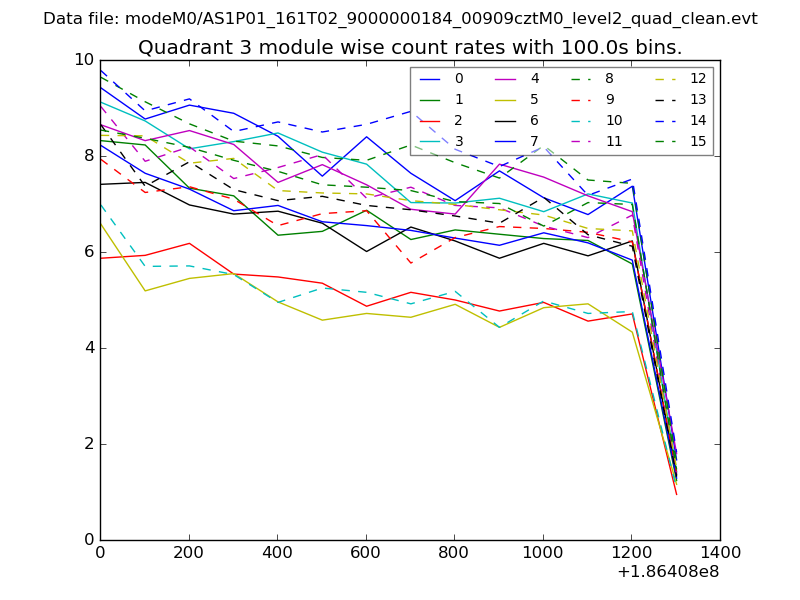
| Module-wise count rates for Quadrant C Data is divided into 100 sec bins |
 |
 |
| Module-wise count rates for Quadrant D Data is divided into 100 sec bins |
 |
 |
| Parameter | Plot |
|---|---|
| CZT HV Monitor | 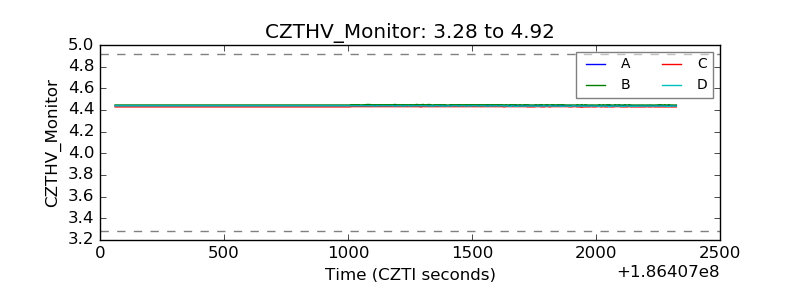 |
| D_VDD | 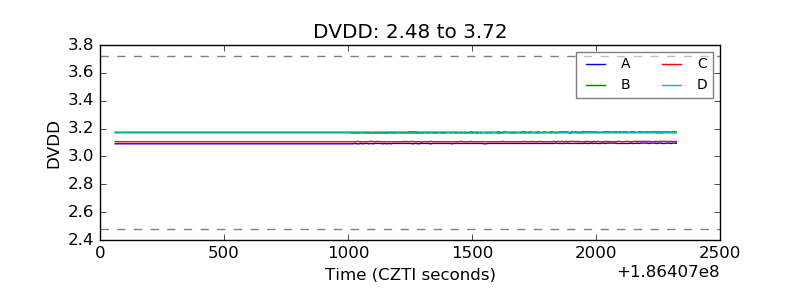 |
| Temperature 1 | 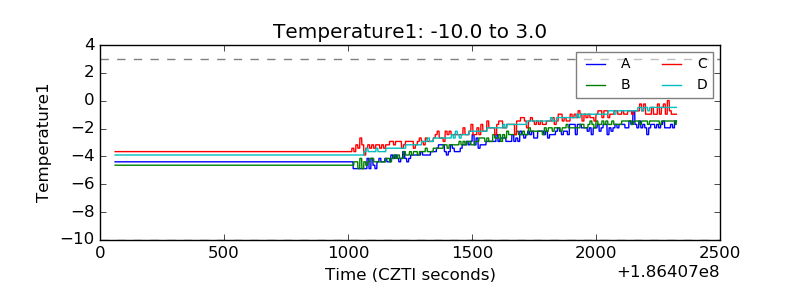 |
| Veto HV Monitor | 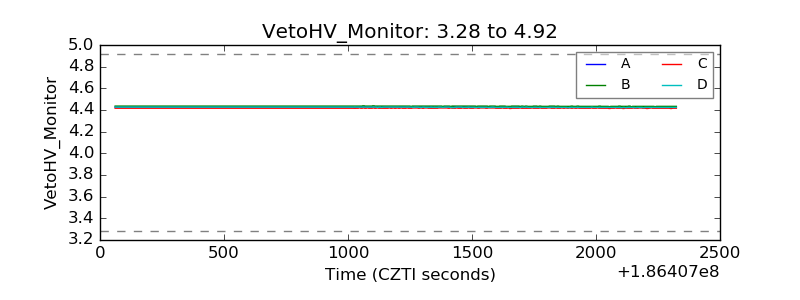 |
| Veto LLD | 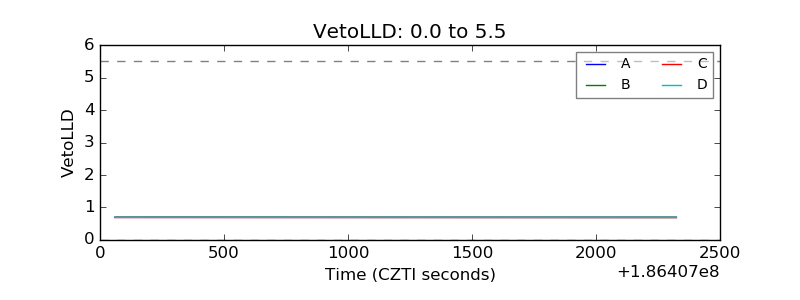 |
| Alpha Counter | 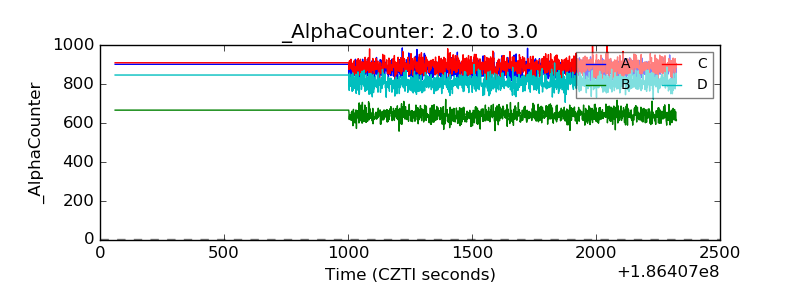 |
| _CPM_Rate | 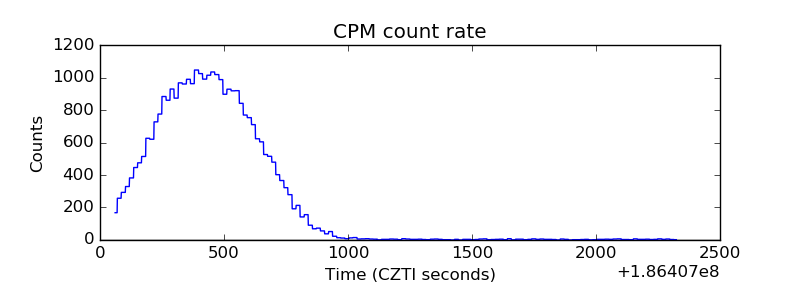 |
| CZT Counter | 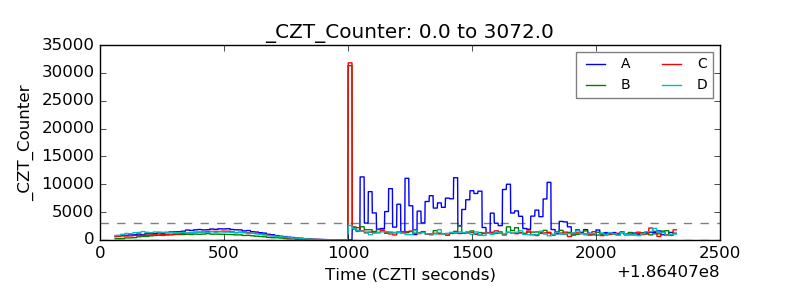 |
| +2.5 Volts monitor |  |
| +5 Volts monitor | 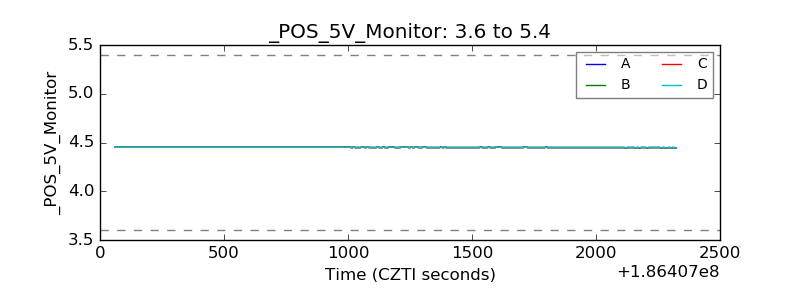 |
| _ROLL_ROT | 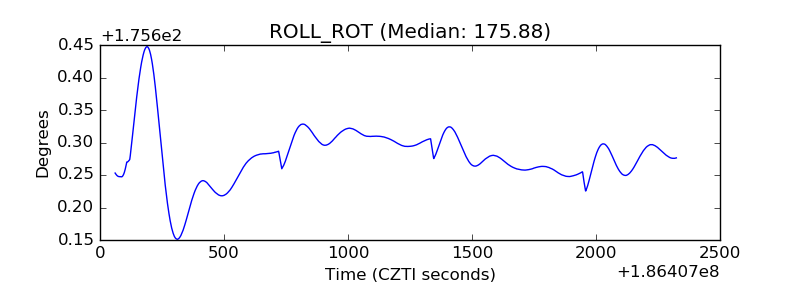 |
| _Roll_DEC | 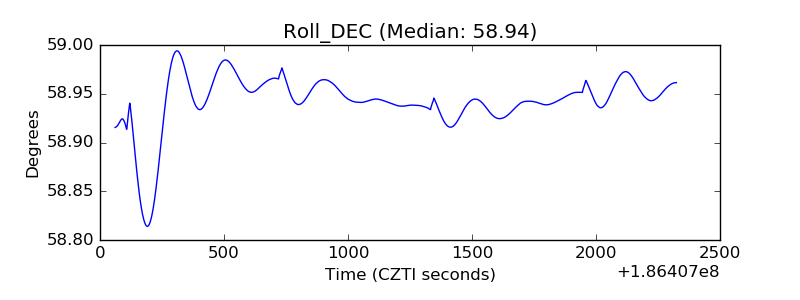 |
| _Roll_RA | 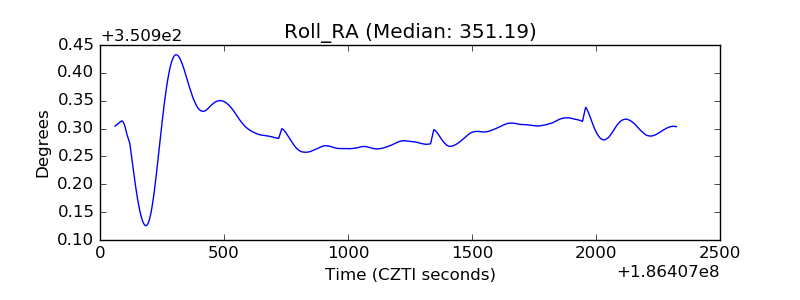 |
| Veto Counter | 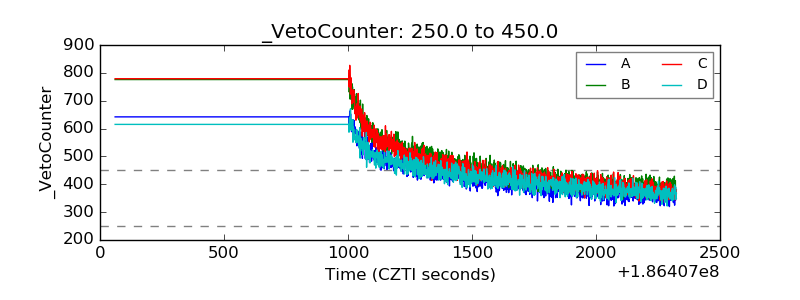 |