| Param | Original file | Final file |
|---|---|---|
| Filename | modeM0/AS1P01_161T02_9000000184_00910cztM0_level2.evt | modeM0/AS1P01_161T02_9000000184_00910cztM0_level2_quad_clean.evt |
| Size (bytes) | 1,083,873,600 | 84,879,360 |
| Size | 1.0 GB | 80.9 MB |
| Events in quadrant A | 8,092,733 | 541,969 |
| Events in quadrant B | 8,122,203 | 553,756 |
| Events in quadrant C | 7,409,915 | 540,313 |
| Events in quadrant D | 8,792,677 | 503,966 |
| Mode SS | |||
|---|---|---|---|
| Quadrant | BADHDUFLAG | Total packets | Discarded packets |
| A | 0 | 124 | 0 |
| B | 0 | 124 | 0 |
| C | 0 | 124 | 0 |
| D | 0 | 124 | 0 |
| Mode M0 | |||
|---|---|---|---|
| Quadrant | BADHDUFLAG | Total packets | Discarded packets |
| A | 0 | 28459 | 0 |
| B | 0 | 28541 | 0 |
| C | 0 | 26399 | 0 |
| D | 0 | 30575 | 0 |
| Mode M9 | |||
|---|---|---|---|
| Quadrant | BADHDUFLAG | Total packets | Discarded packets |
| A | 0 | 12 | 0 |
| B | 0 | 12 | 0 |
| C | 0 | 12 | 0 |
| D | 0 | 12 | 0 |
| Quadrant | Total seconds | Saturated seconds | Saturation percentage |
|---|---|---|---|
| A | 6162 | 354 | 5.744888% |
| B | 6162 | 88 | 1.428108% |
| C | 6163 | 57 | 0.924874% |
| D | 6162 | 563 | 9.136644% |
Noise dominated data is calculated using 1-second bins in cleaned event files. If a bin has >2000 counts, and if more than 50% of those come from <1% of pixels, then it is considered to be noise-dominated and hence unusable.
| Quadrant | # 1 sec bins | Bins with >0 counts | Bins with >2000 counts | High rate bins dominated by noise | Noise dominated (total time) | Noise dominated (detector-on time) | Marked lightcurve |
|---|---|---|---|---|---|---|---|
| A | 7352 | 6163 | 583 | 583 | 7.93% | 9.46% | 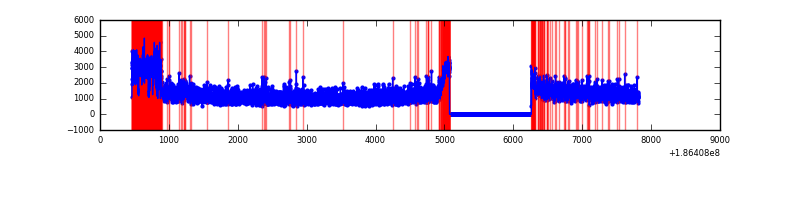 |
| B | 7352 | 6163 | 385 | 385 | 5.24% | 6.25% | 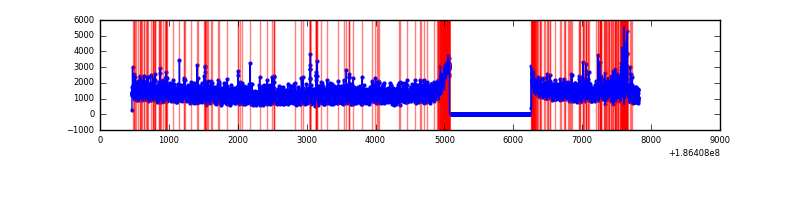 |
| C | 7353 | 6164 | 219 | 219 | 2.98% | 3.55% | 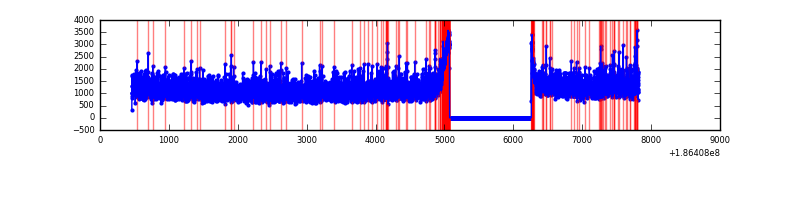 |
| D | 7352 | 6163 | 1224 | 1224 | 16.65% | 19.86% | 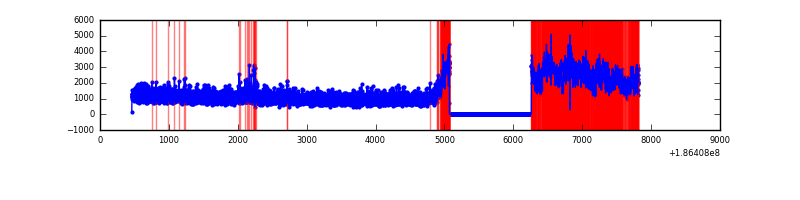 |
Top three noisy pixels from each quadrant. If the there are fewer than three noisy pixels in the level2.evt file, extra rows are filled as -1
| Pixel properties | Quadrant properties | ||||||
|---|---|---|---|---|---|---|---|
| Quadrant | DetID | PixID | Counts | Sigma | Mean | Median | Sigma |
| A | 15 | 233 | 832460 | 1870.34 | 1860 | 1868 | 444.1 |
| A | 15 | 127 | 124789 | 276.79 | 1860 | 1868 | 444.1 |
| A | 11 | 79 | 7424 | 12.51 | 1860 | 1868 | 444.1 |
| B | 3 | 0 | 304862 | 658.35 | 1964 | 1973 | 460.1 |
| B | 5 | 200 | 97542 | 207.73 | 1964 | 1973 | 460.1 |
| B | 0 | 220 | 87205 | 185.26 | 1964 | 1973 | 460.1 |
| C | 9 | 83 | 148372 | 296.49 | 1797 | 1858 | 494.2 |
| C | 12 | 254 | 68884 | 135.64 | 1797 | 1858 | 494.2 |
| C | 15 | 241 | 53631 | 104.77 | 1797 | 1858 | 494.2 |
| D | 12 | 188 | 2051335 | 3894.22 | 1713 | 1772 | 526.3 |
| D | 1 | 4 | 166709 | 313.38 | 1713 | 1772 | 526.3 |
| D | 13 | 73 | 106858 | 199.67 | 1713 | 1772 | 526.3 |
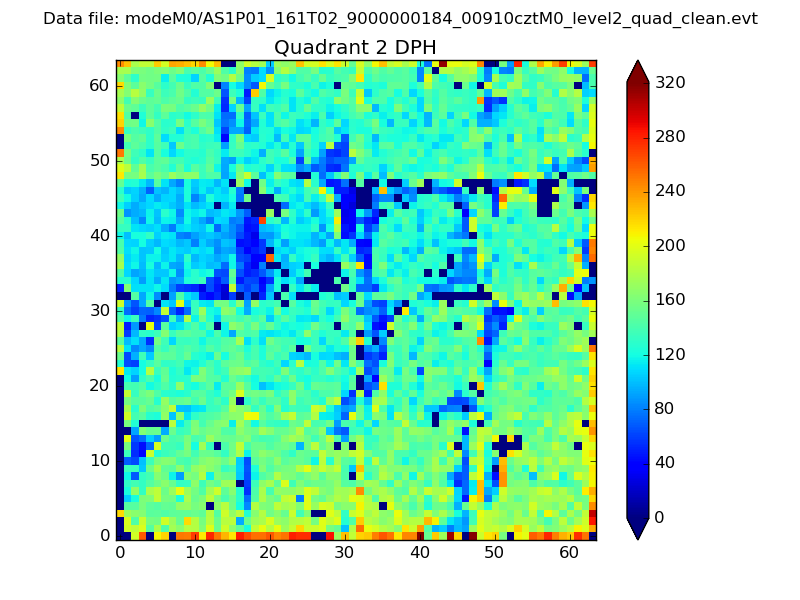
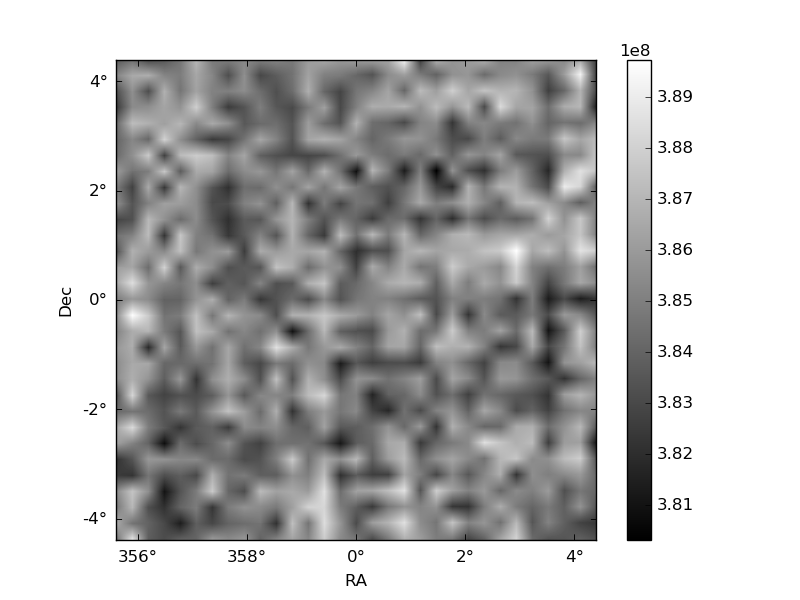
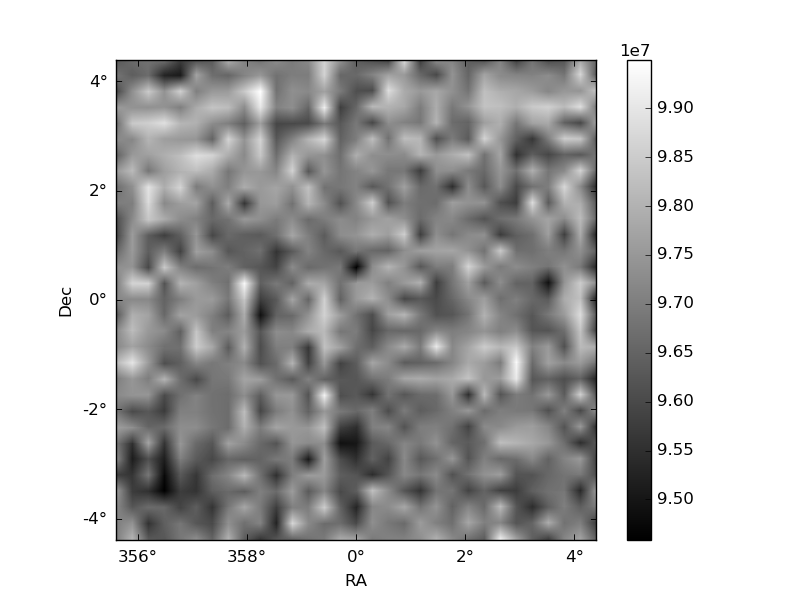
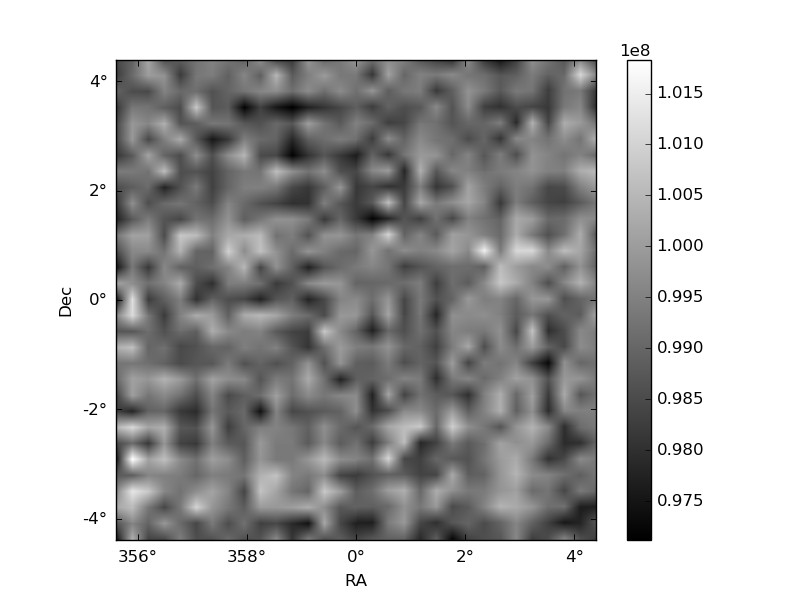
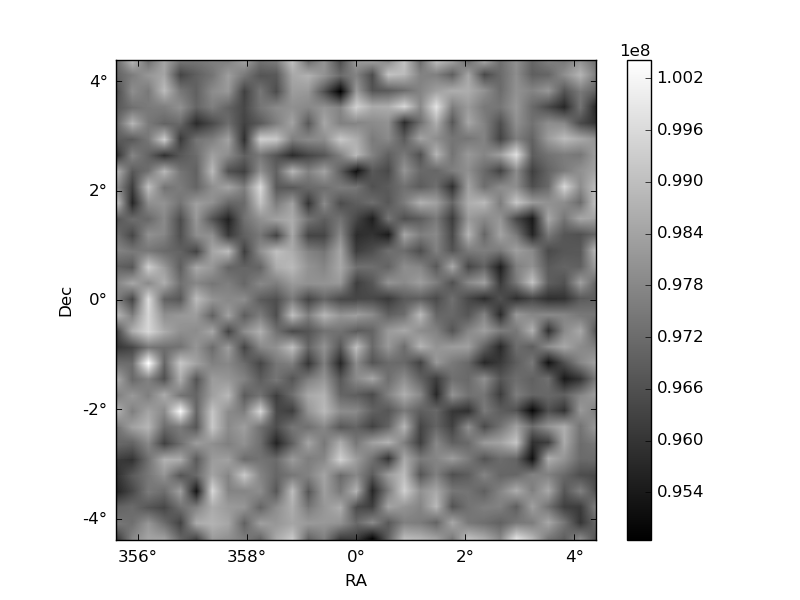
Histogram calculated using DETX and DETY for each event in the final _common_clean file
| Quadrant A | 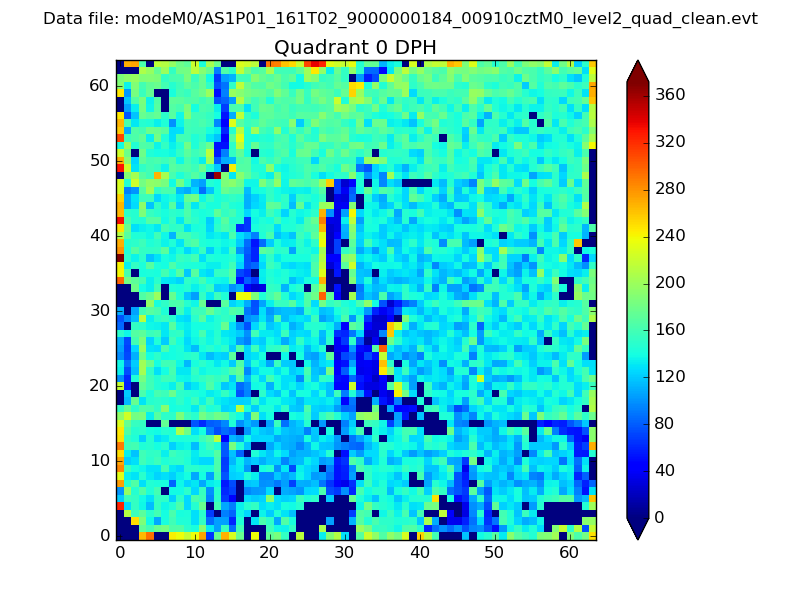 |
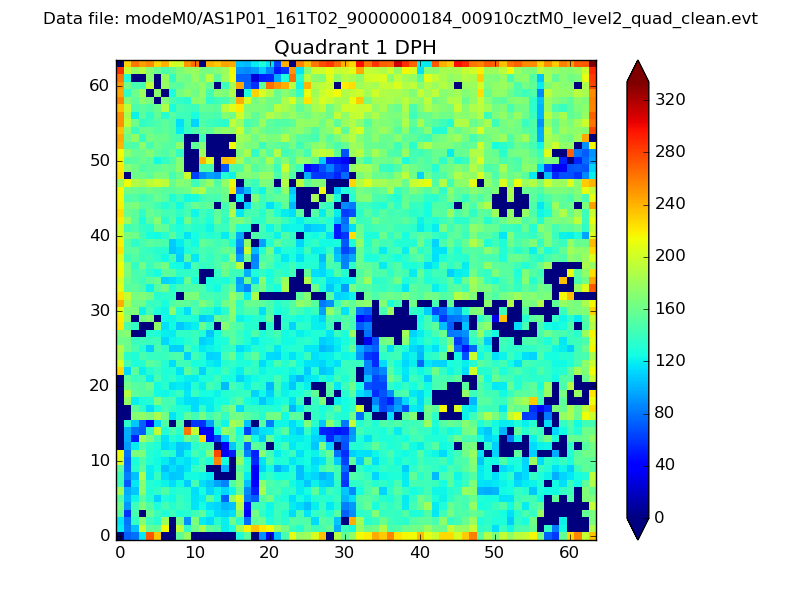 |
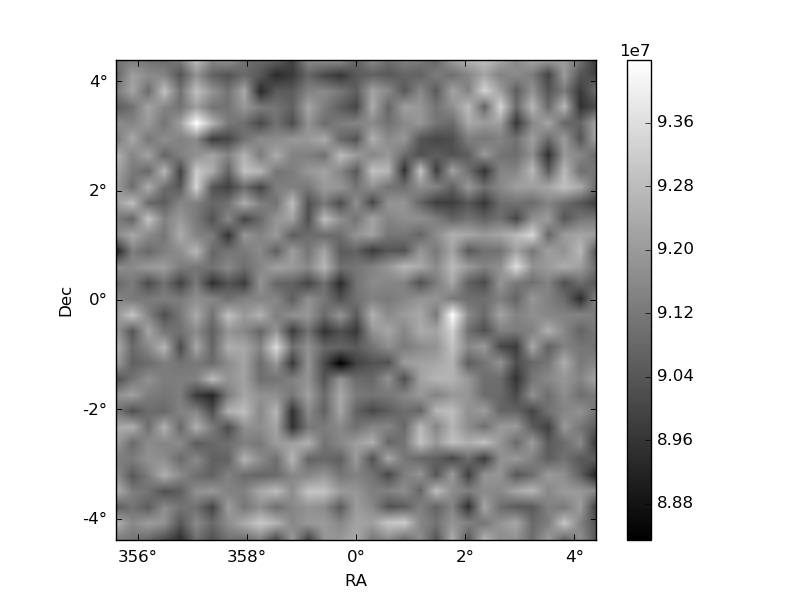
Quadrant B |
|---|---|---|---|
| Quadrant D | 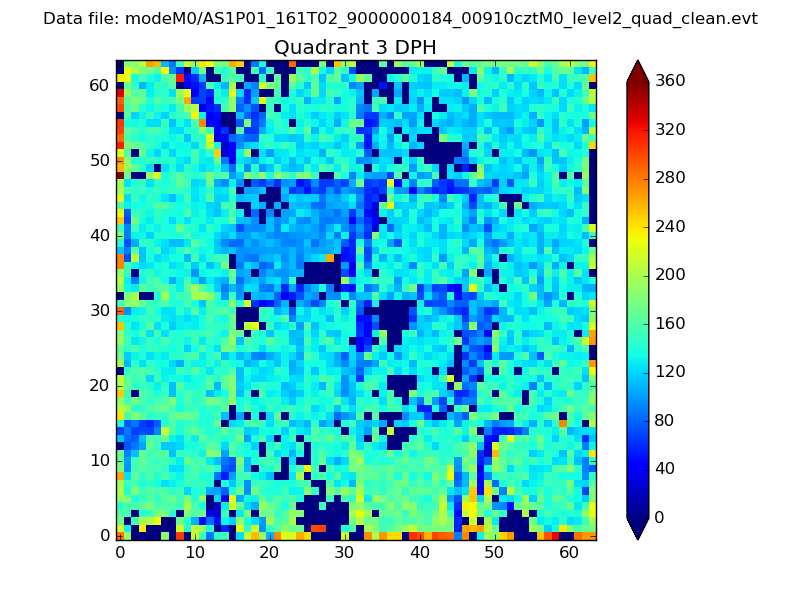 |
 |
Quadrant C |
| Plot type | Count rate plots | Images |
|---|---|---|
| Comparison with Poisson distribution Blue bars denote a histogram of data divided into 1 sec bins. Red curve is a Poisson curve with rate = median count rate of data. |
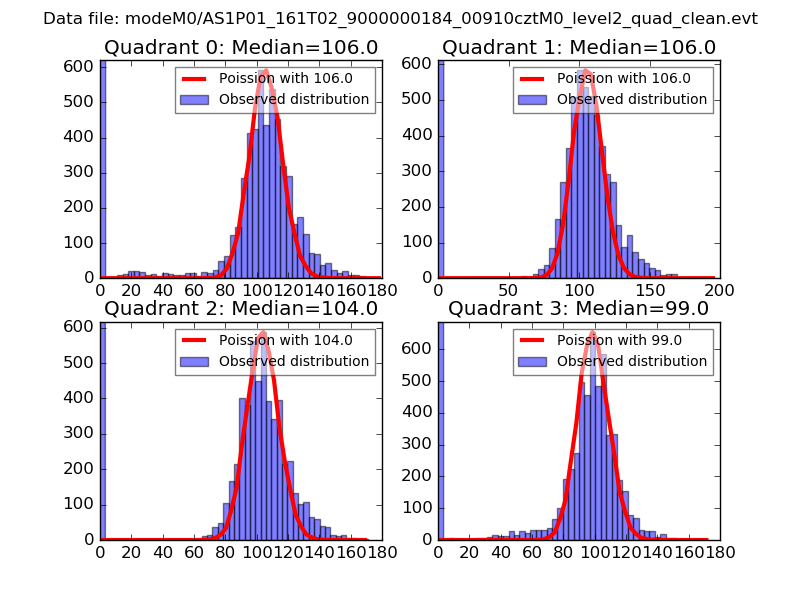 |
 |
| Quadrant-wise count rates Data is divided into 100 sec bins |
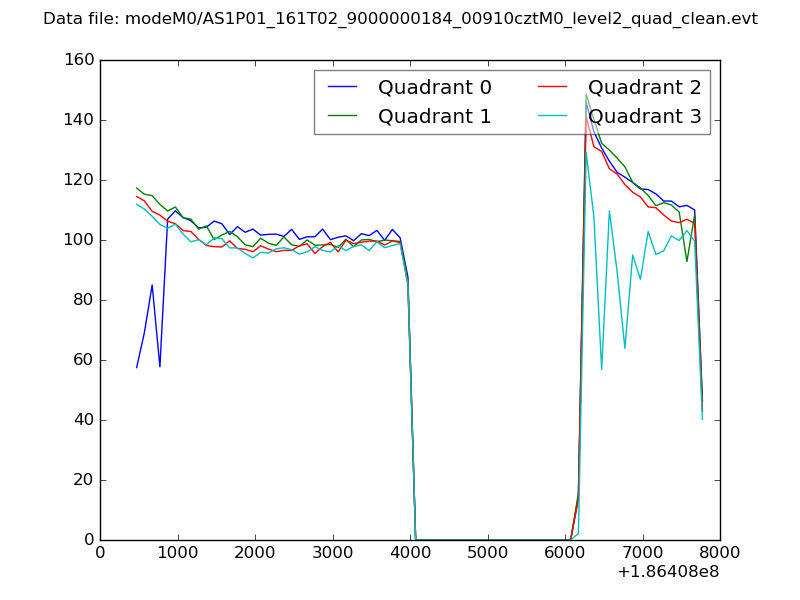 |
|
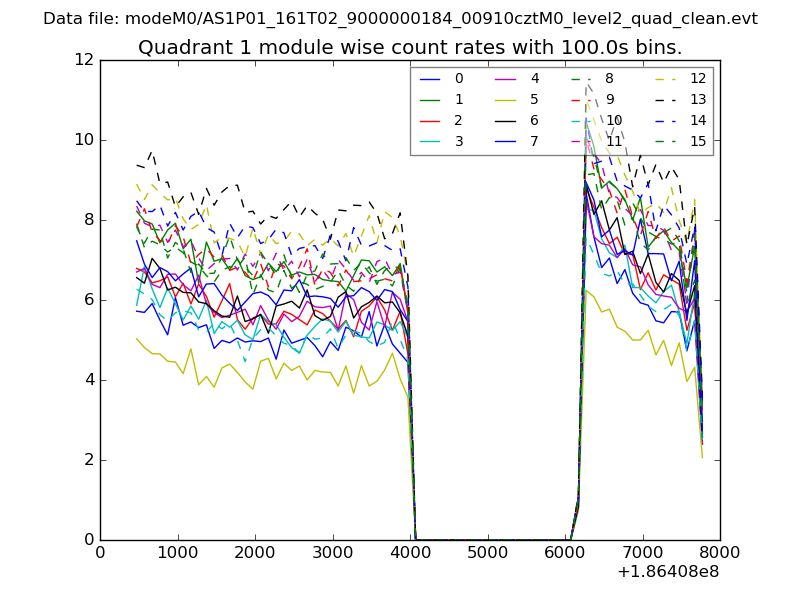
| Module-wise count rates for Quadrant A Data is divided into 100 sec bins |
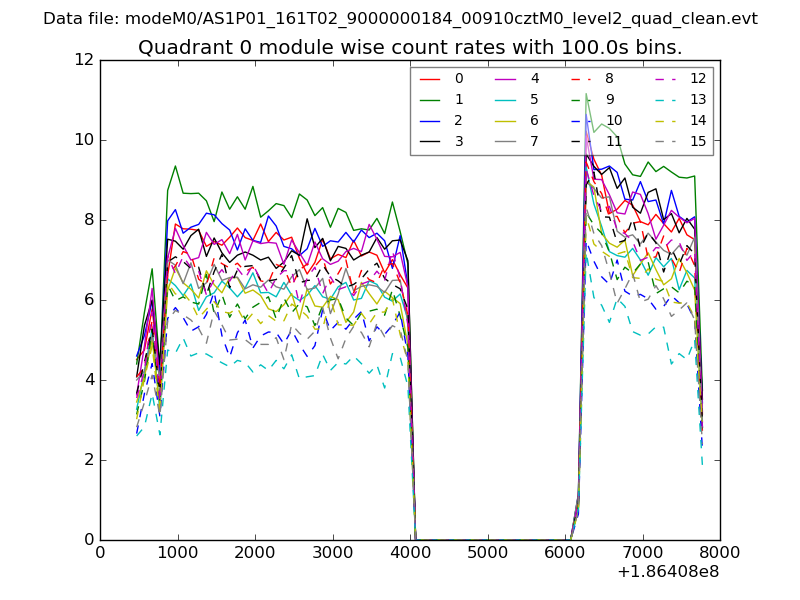 |
 |
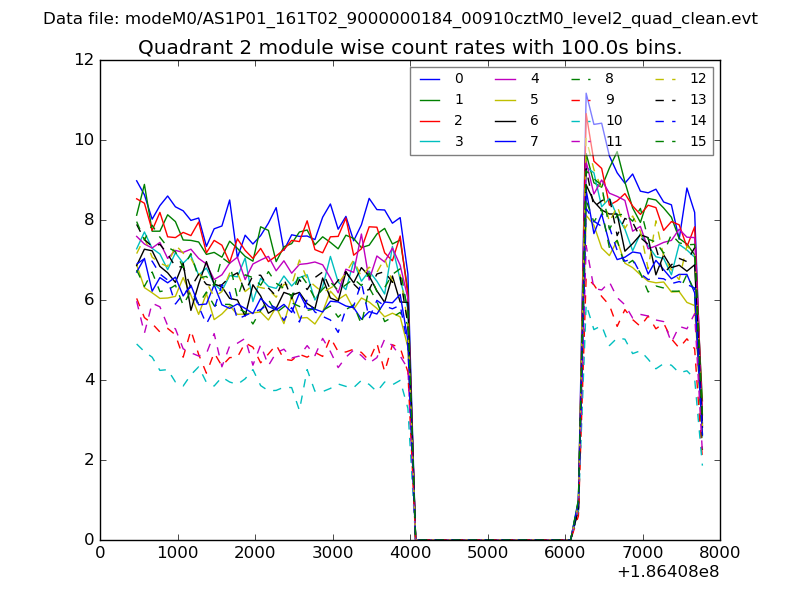
| Module-wise count rates for Quadrant B Data is divided into 100 sec bins |
 |
 |
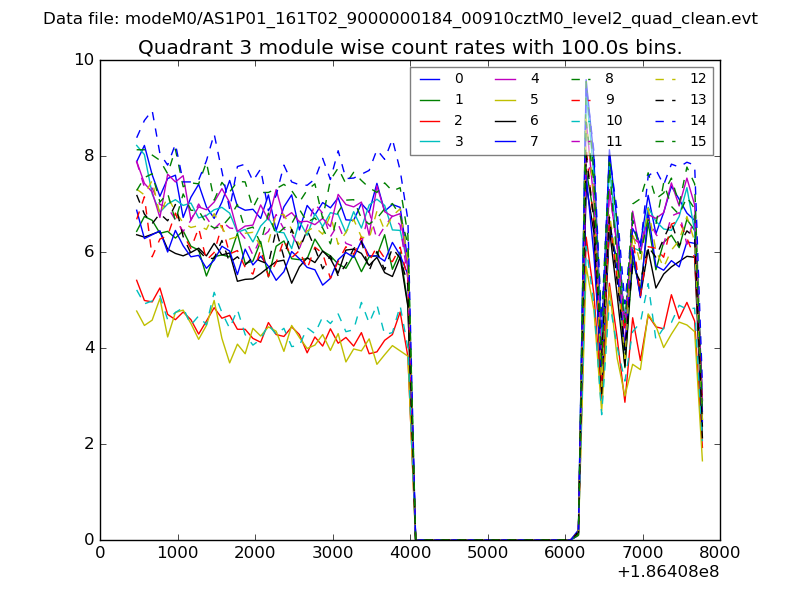
| Module-wise count rates for Quadrant C Data is divided into 100 sec bins |
 |
 |
| Module-wise count rates for Quadrant D Data is divided into 100 sec bins |
 |
 |
| Parameter | Plot |
|---|---|
| CZT HV Monitor | 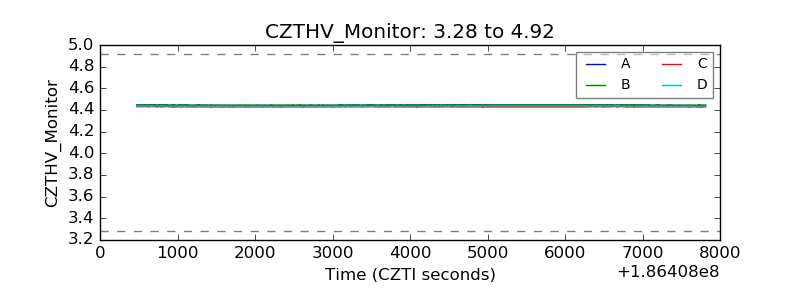 |
| D_VDD | 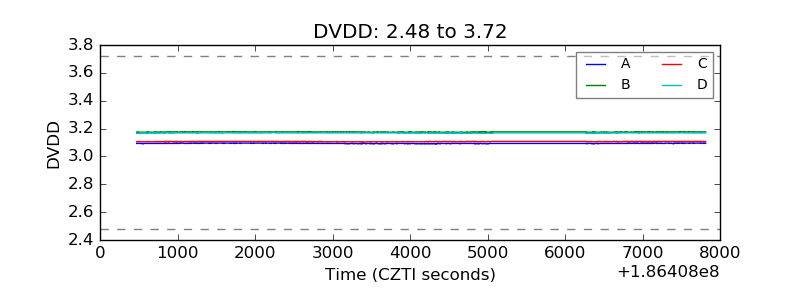 |
| Temperature 1 | 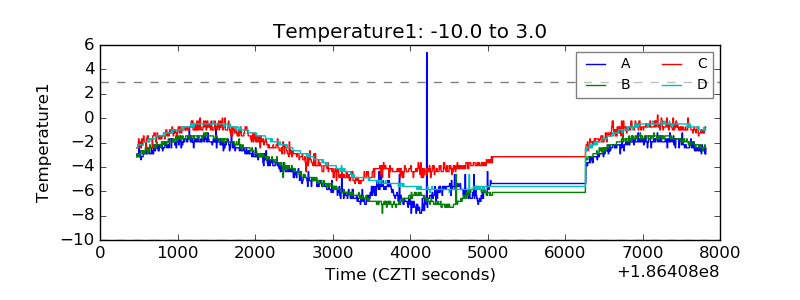 |
| Veto HV Monitor | 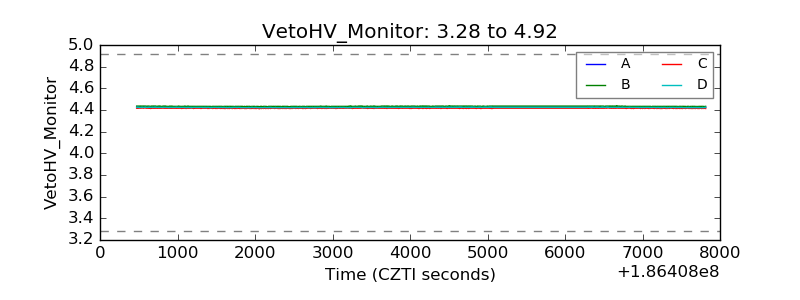 |
| Veto LLD | 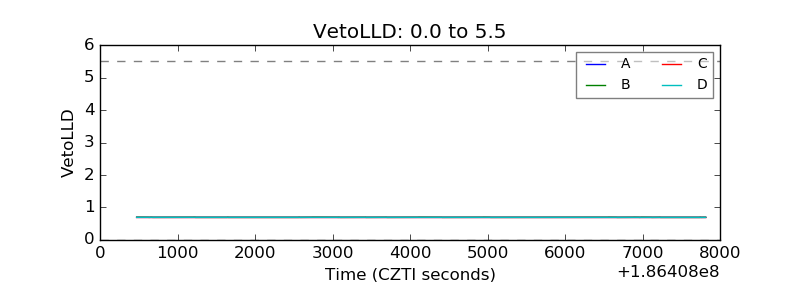 |
| Alpha Counter | 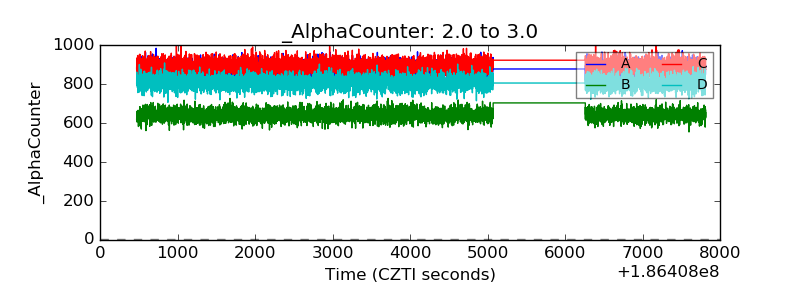 |
| _CPM_Rate | 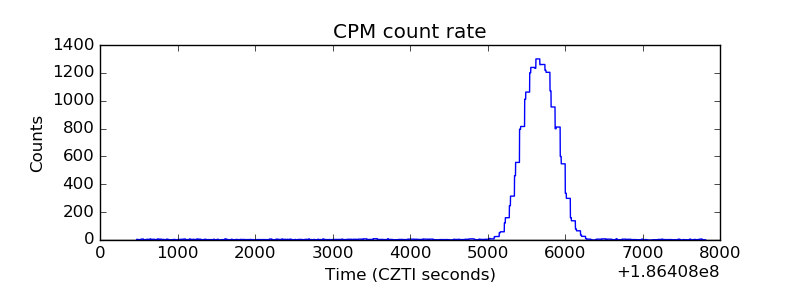 |
| CZT Counter | 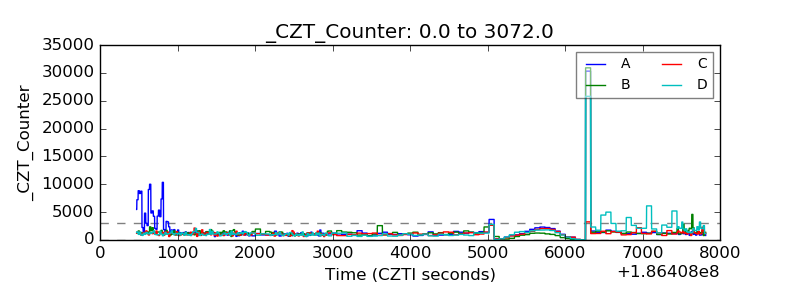 |
| +2.5 Volts monitor |  |
| +5 Volts monitor | 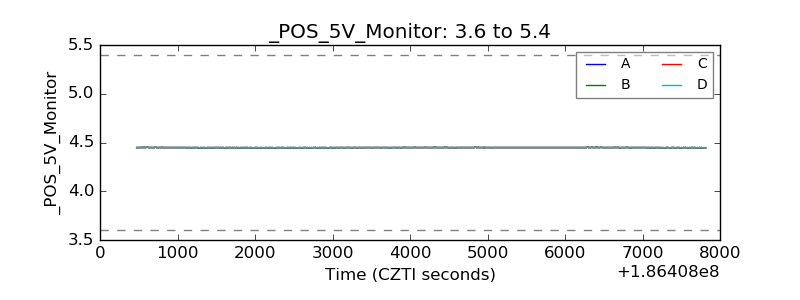 |
| _ROLL_ROT | 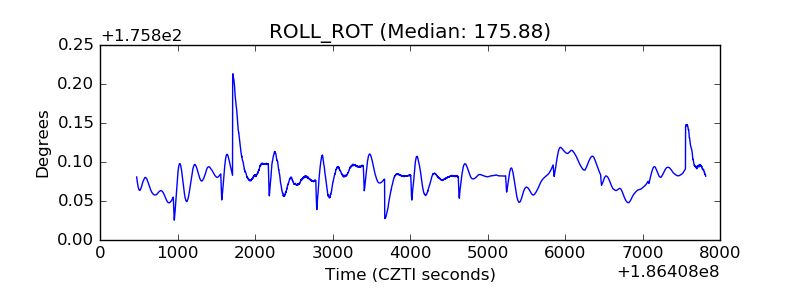 |
| _Roll_DEC | 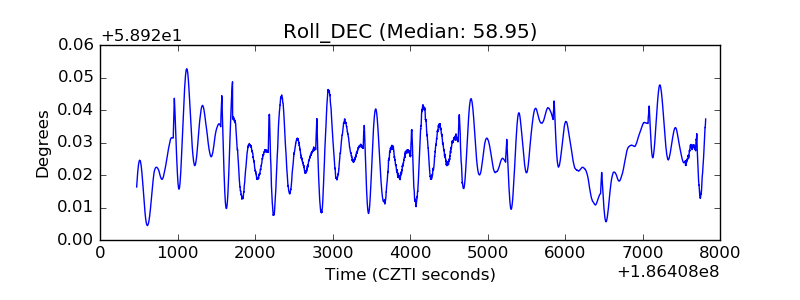 |
| _Roll_RA | 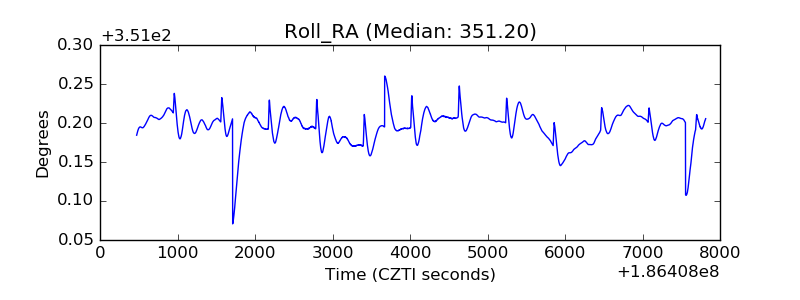 |
| Veto Counter | 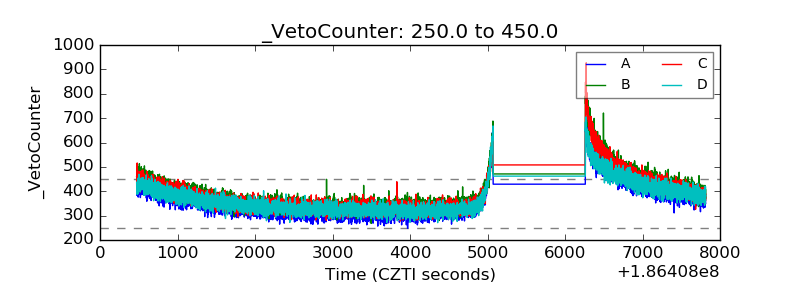 |