| Param | Original file | Final file |
|---|---|---|
| Filename | modeM0/AS1P01_161T02_9000000184_00911cztM0_level2.evt | modeM0/AS1P01_161T02_9000000184_00911cztM0_level2_quad_clean.evt |
| Size (bytes) | 1,188,233,280 | 77,057,280 |
| Size | 1.1 GB | 73.5 MB |
| Events in quadrant A | 7,168,389 | 515,516 |
| Events in quadrant B | 8,437,962 | 501,706 |
| Events in quadrant C | 7,418,201 | 500,256 |
| Events in quadrant D | 12,566,008 | 396,633 |
| Mode SS | |||
|---|---|---|---|
| Quadrant | BADHDUFLAG | Total packets | Discarded packets |
| A | 0 | 124 | 0 |
| B | 0 | 124 | 0 |
| C | 0 | 124 | 0 |
| D | 0 | 124 | 0 |
| Mode M0 | |||
|---|---|---|---|
| Quadrant | BADHDUFLAG | Total packets | Discarded packets |
| A | 0 | 25564 | 0 |
| B | 0 | 29351 | 0 |
| C | 0 | 26285 | 0 |
| D | 0 | 41773 | 0 |
| Mode M9 | |||
|---|---|---|---|
| Quadrant | BADHDUFLAG | Total packets | Discarded packets |
| A | 0 | 12 | 0 |
| B | 0 | 12 | 0 |
| C | 0 | 12 | 0 |
| D | 0 | 12 | 0 |
| Quadrant | Total seconds | Saturated seconds | Saturation percentage |
|---|---|---|---|
| A | 5983 | 37 | 0.618419% |
| B | 5983 | 207 | 3.459803% |
| C | 5983 | 47 | 0.785559% |
| D | 5984 | 1615 | 26.988636% |
Noise dominated data is calculated using 1-second bins in cleaned event files. If a bin has >2000 counts, and if more than 50% of those come from <1% of pixels, then it is considered to be noise-dominated and hence unusable.
| Quadrant | # 1 sec bins | Bins with >0 counts | Bins with >2000 counts | High rate bins dominated by noise | Noise dominated (total time) | Noise dominated (detector-on time) | Marked lightcurve |
|---|---|---|---|---|---|---|---|
| A | 7238 | 5984 | 223 | 223 | 3.08% | 3.73% | 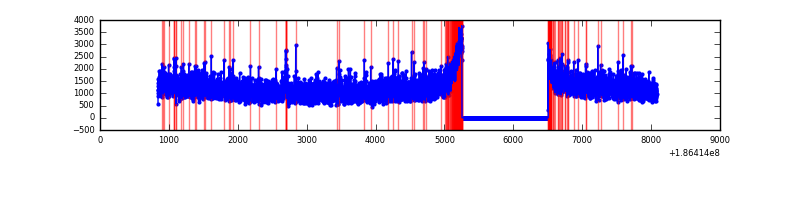 |
| B | 7238 | 5984 | 684 | 684 | 9.45% | 11.43% | 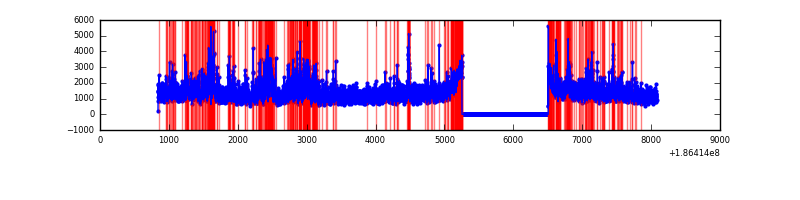 |
| C | 7238 | 5984 | 241 | 241 | 3.33% | 4.03% | 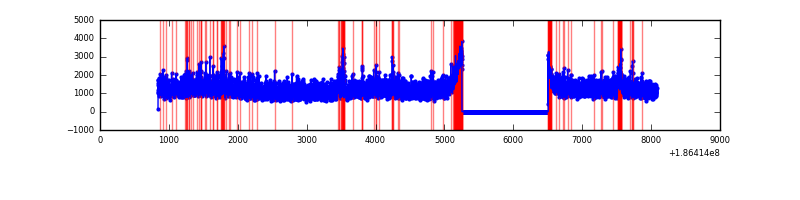 |
| D | 7239 | 5985 | 2918 | 2918 | 40.31% | 48.76% | 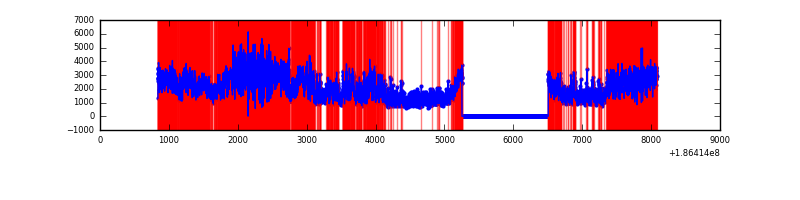 |
Top three noisy pixels from each quadrant. If the there are fewer than three noisy pixels in the level2.evt file, extra rows are filled as -1
| Pixel properties | Quadrant properties | ||||||
|---|---|---|---|---|---|---|---|
| Quadrant | DetID | PixID | Counts | Sigma | Mean | Median | Sigma |
| A | 15 | 127 | 135406 | 307.0 | 1832 | 1842 | 435.1 |
| A | 11 | 79 | 6935 | 11.71 | 1832 | 1842 | 435.1 |
| A | 15 | 233 | 6030 | 9.63 | 1832 | 1842 | 435.1 |
| B | 3 | 0 | 1089451 | 2499.69 | 1875 | 1883 | 435.1 |
| B | 7 | 221 | 73965 | 165.67 | 1875 | 1883 | 435.1 |
| B | 5 | 249 | 25576 | 54.46 | 1875 | 1883 | 435.1 |
| C | 9 | 83 | 233775 | 480.23 | 1757 | 1819 | 483.0 |
| C | 12 | 254 | 151605 | 310.11 | 1757 | 1819 | 483.0 |
| C | 15 | 241 | 57390 | 115.05 | 1757 | 1819 | 483.0 |
| D | 12 | 188 | 6443476 | 13799.31 | 1535 | 1590 | 466.8 |
| D | 1 | 4 | 140324 | 297.19 | 1535 | 1590 | 466.8 |
| D | 10 | 85 | 64282 | 134.29 | 1535 | 1590 | 466.8 |
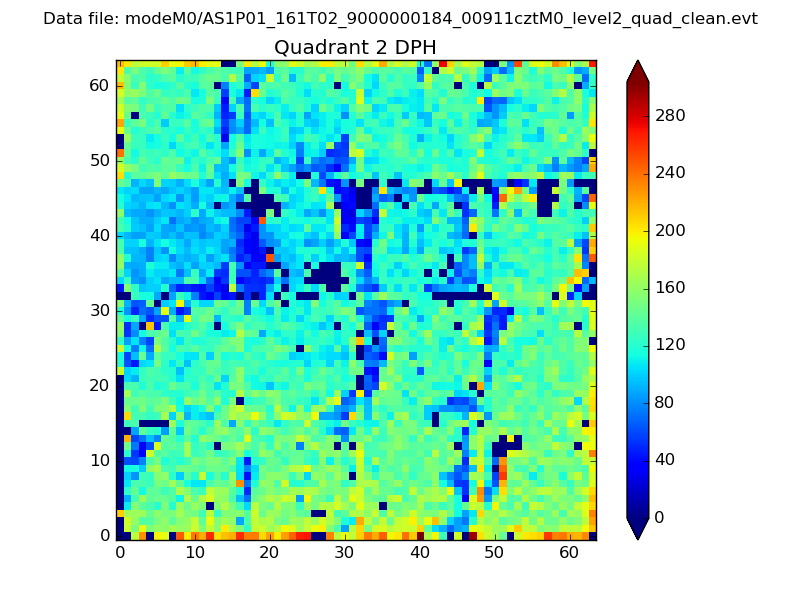
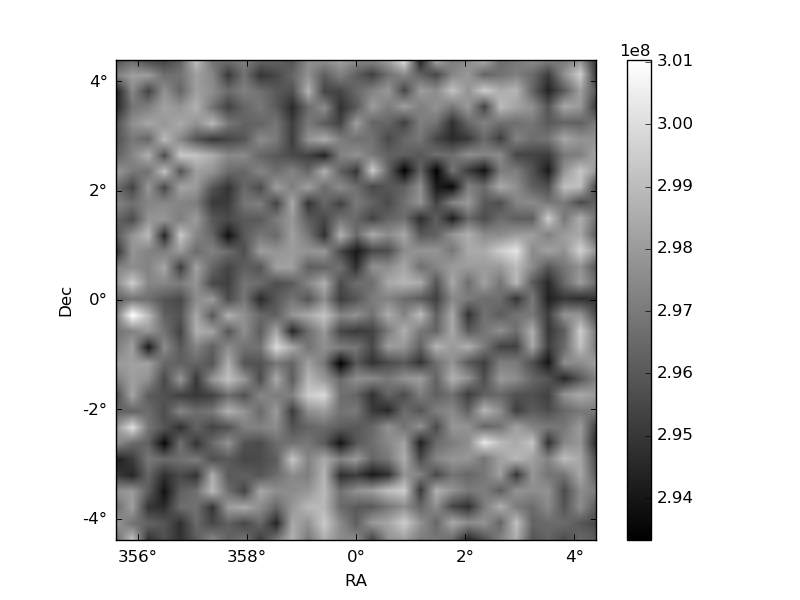
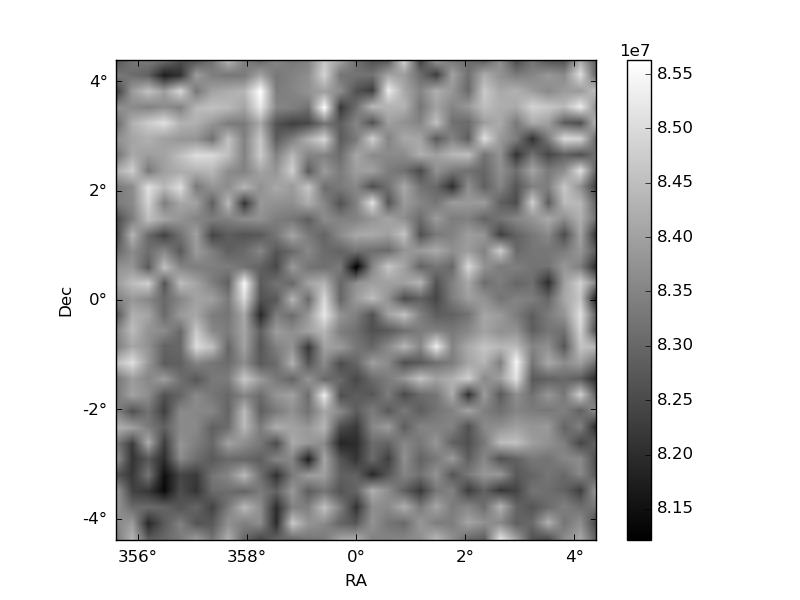
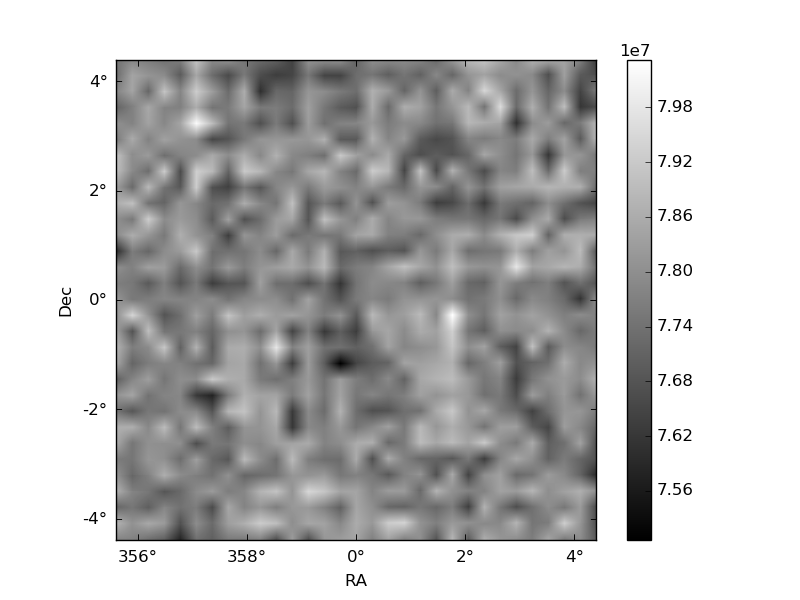
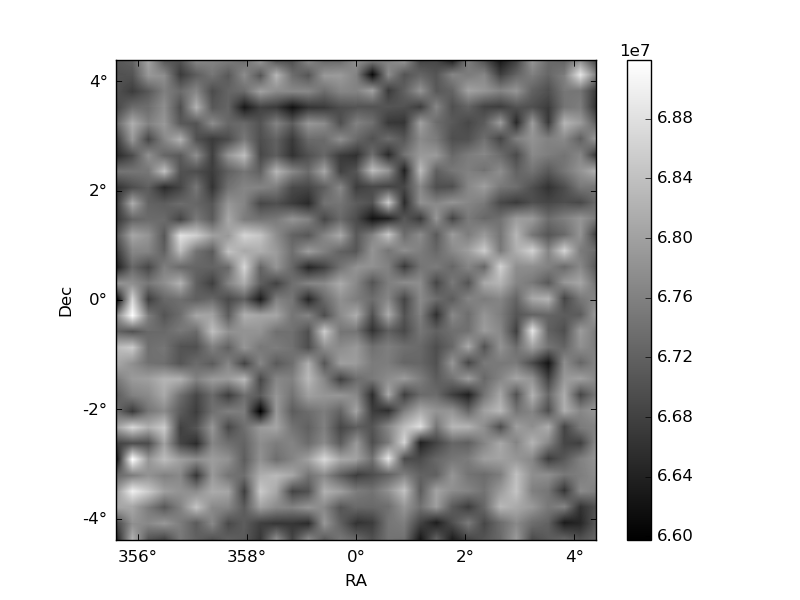
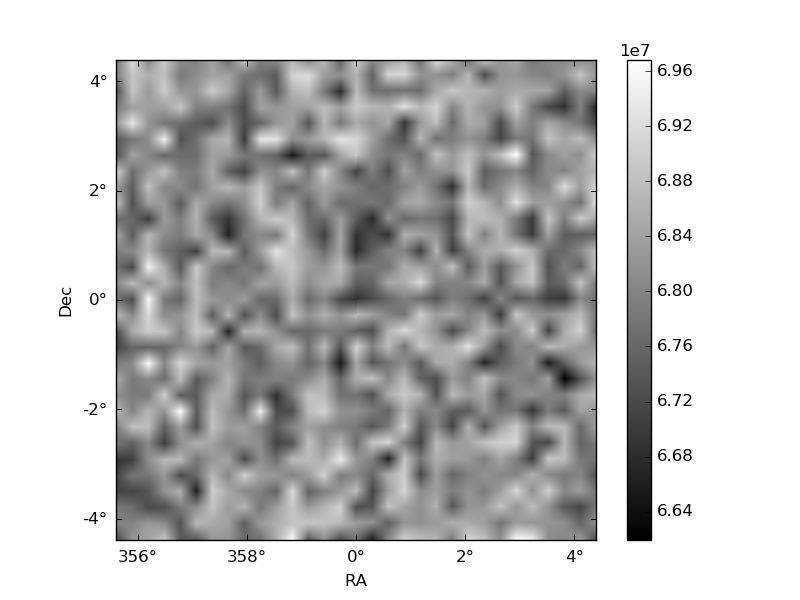
Histogram calculated using DETX and DETY for each event in the final _common_clean file
| Quadrant A | 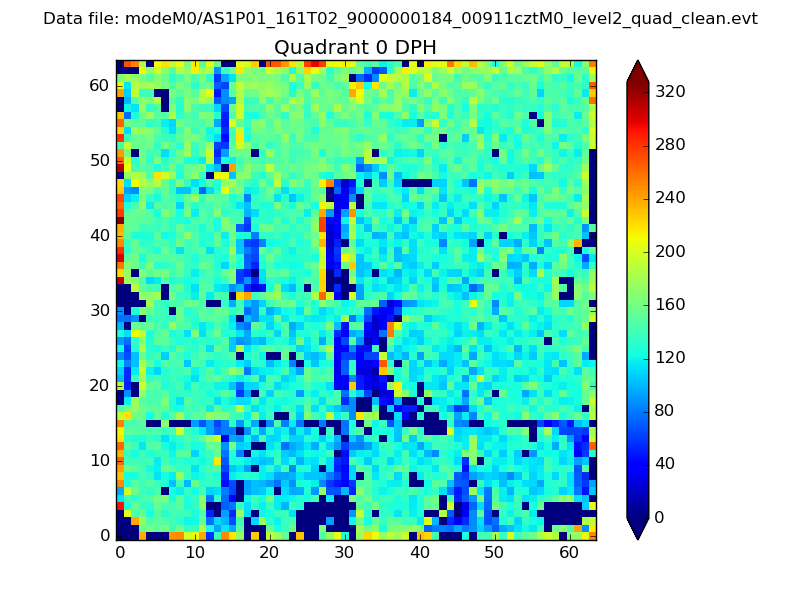 |
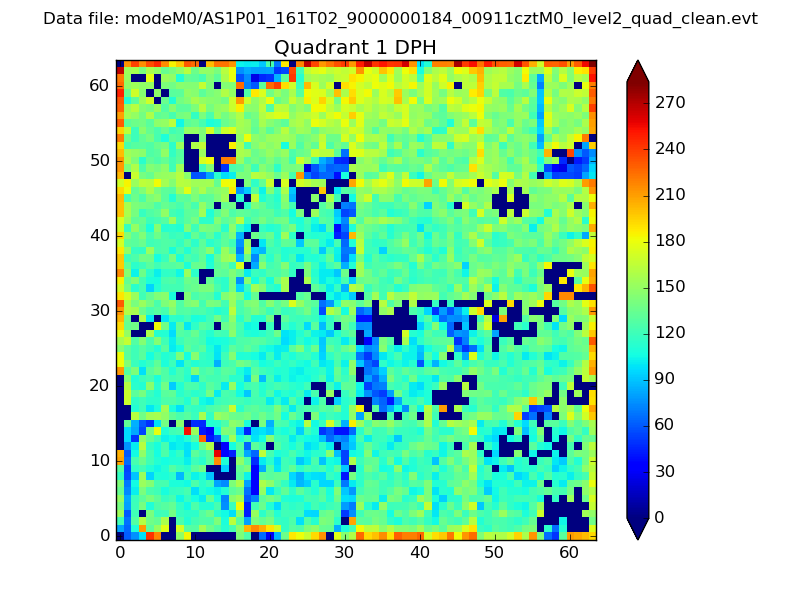 |
Quadrant B |
|---|---|---|---|
| Quadrant D | 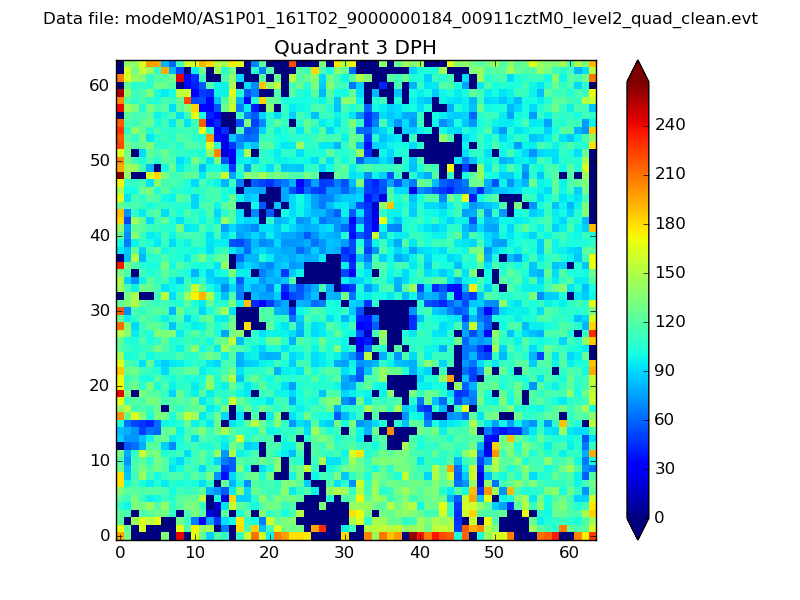 |
 |
Quadrant C |
| Plot type | Count rate plots | Images |
|---|---|---|
| Comparison with Poisson distribution Blue bars denote a histogram of data divided into 1 sec bins. Red curve is a Poisson curve with rate = median count rate of data. |
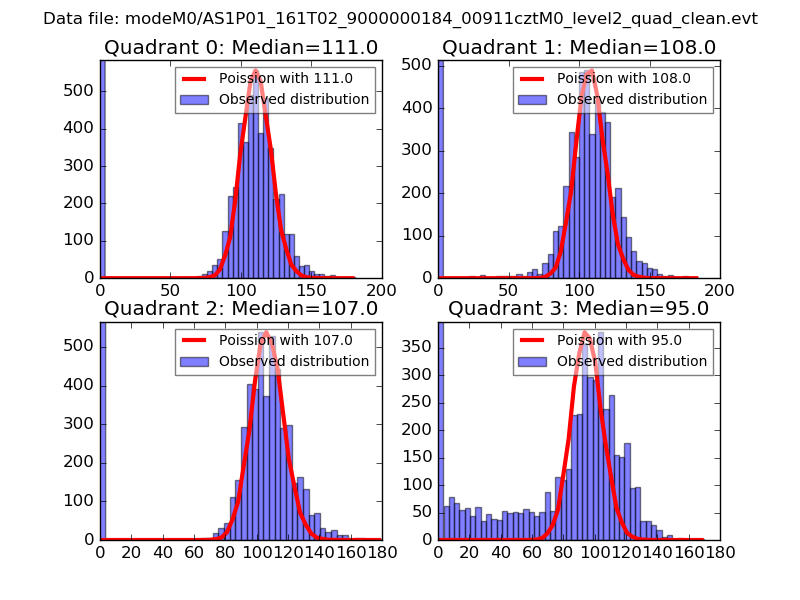 |
 |
| Quadrant-wise count rates Data is divided into 100 sec bins |
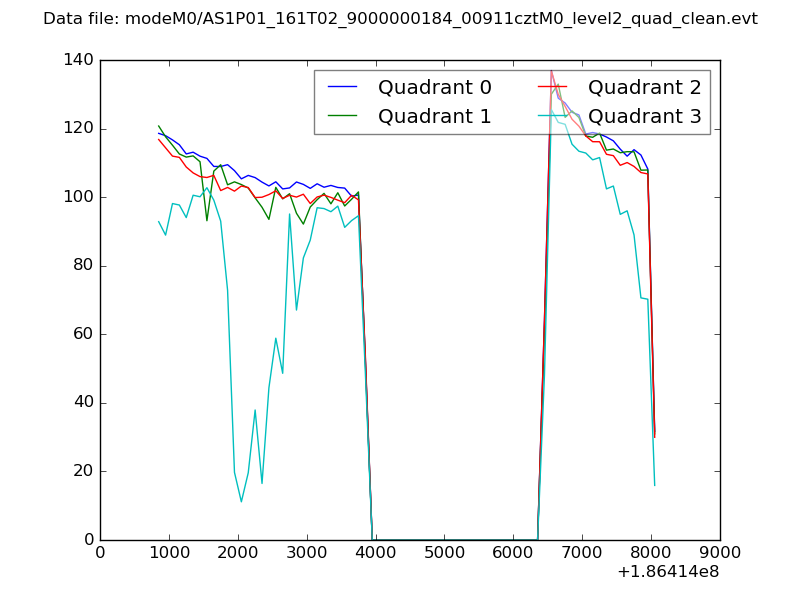 |
|
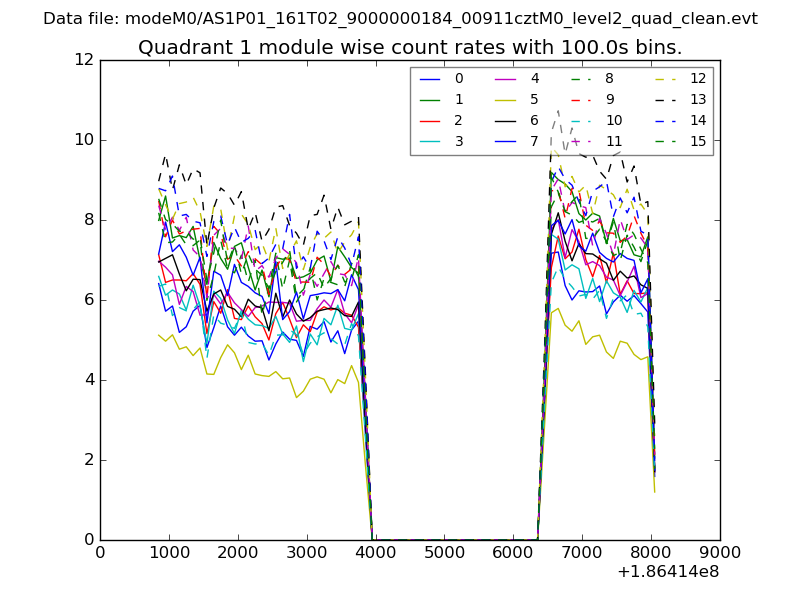
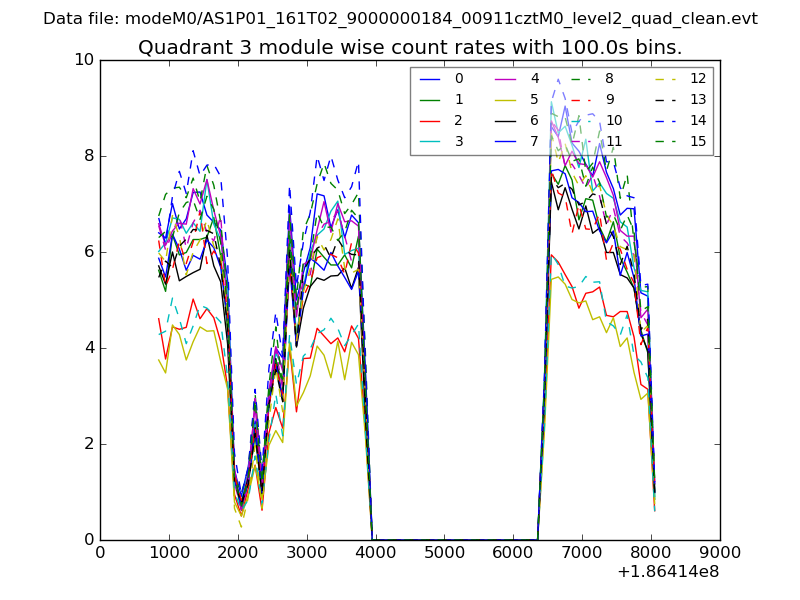
| Module-wise count rates for Quadrant A Data is divided into 100 sec bins |
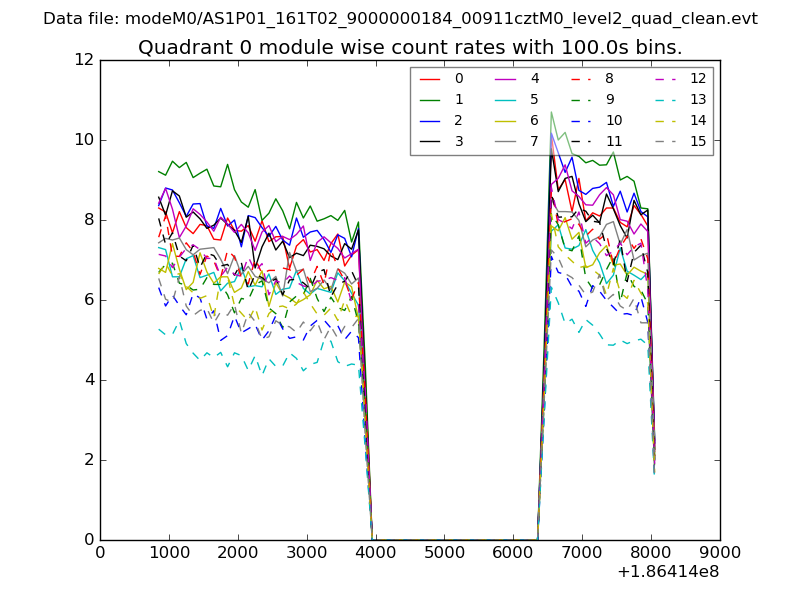 |
 |
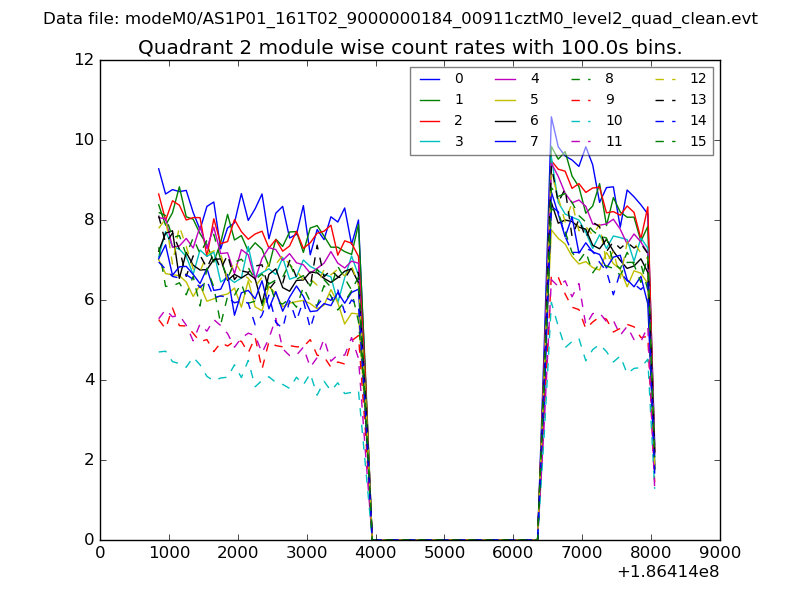
| Module-wise count rates for Quadrant B Data is divided into 100 sec bins |
 |
 |
| Module-wise count rates for Quadrant C Data is divided into 100 sec bins |
 |
 |
| Module-wise count rates for Quadrant D Data is divided into 100 sec bins |
 |
 |
| Parameter | Plot |
|---|---|
| CZT HV Monitor | 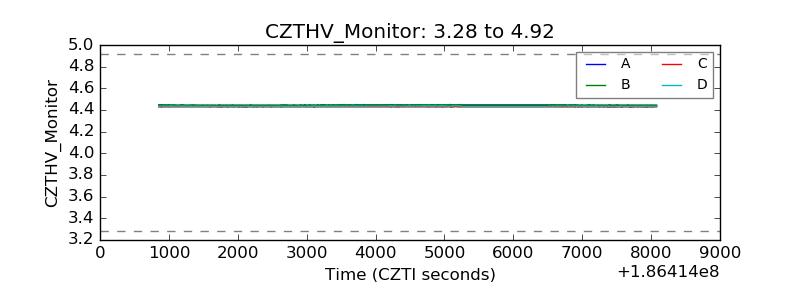 |
| D_VDD | 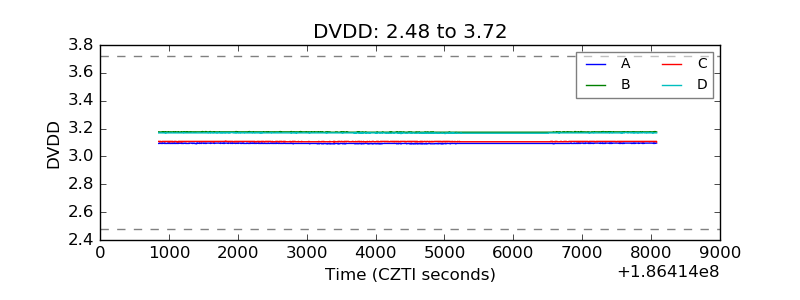 |
| Temperature 1 | 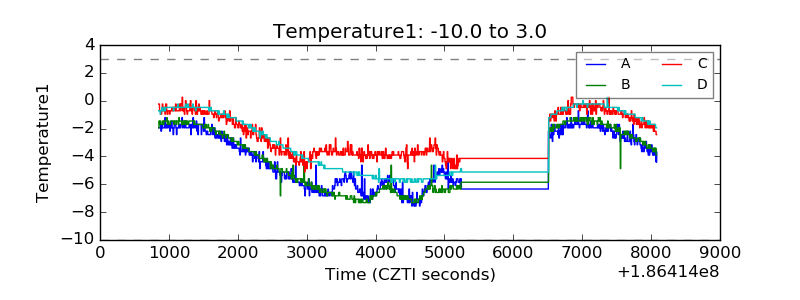 |
| Veto HV Monitor | 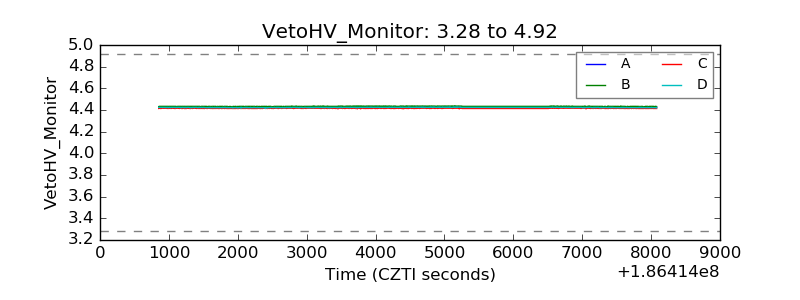 |
| Veto LLD | 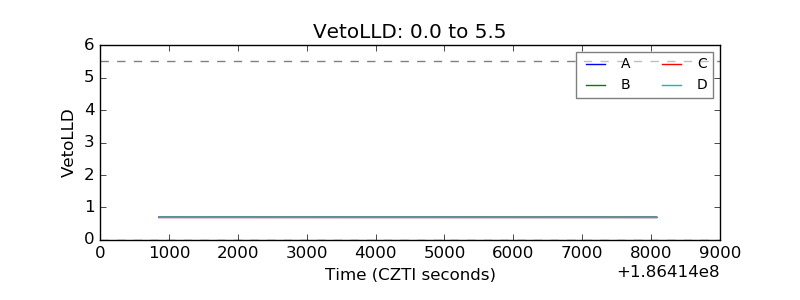 |
| Alpha Counter | 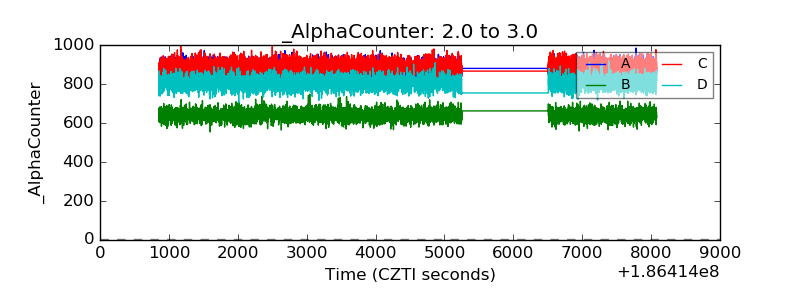 |
| _CPM_Rate | 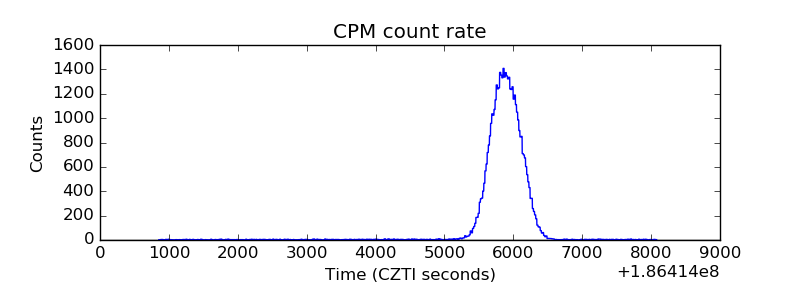 |
| CZT Counter | 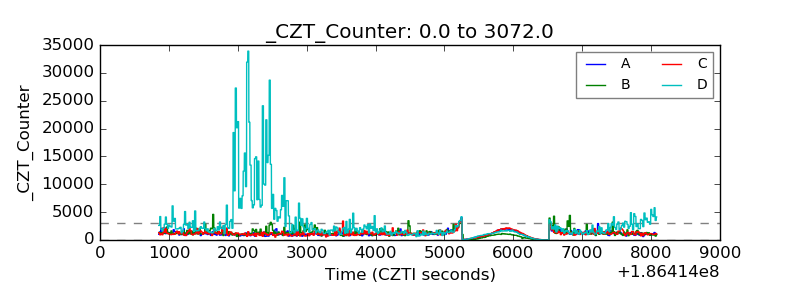 |
| +2.5 Volts monitor |  |
| +5 Volts monitor | 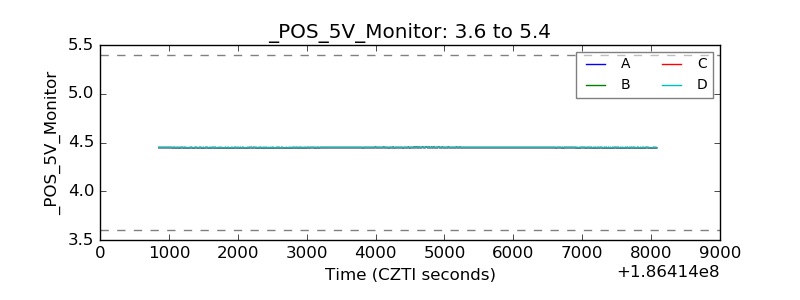 |
| _ROLL_ROT | 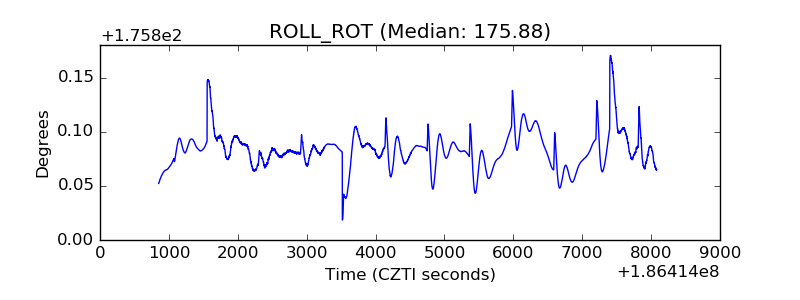 |
| _Roll_DEC | 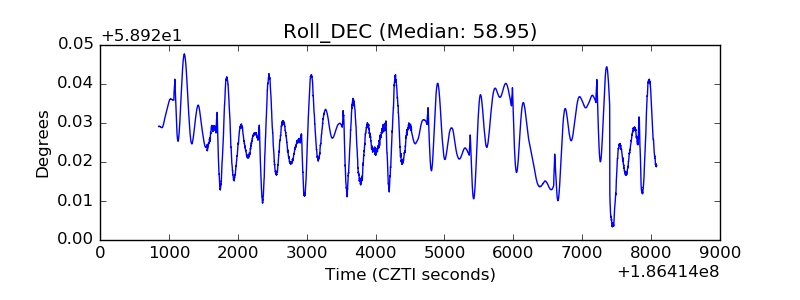 |
| _Roll_RA | 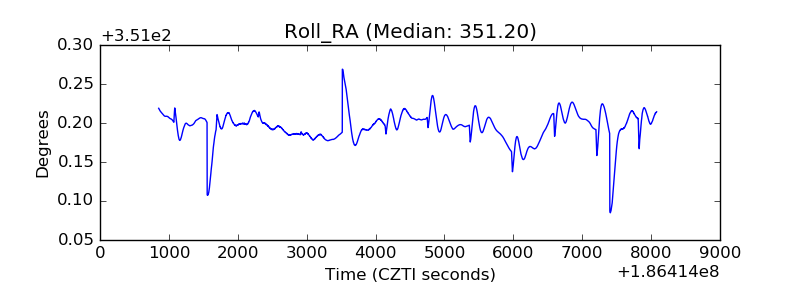 |
| Veto Counter | 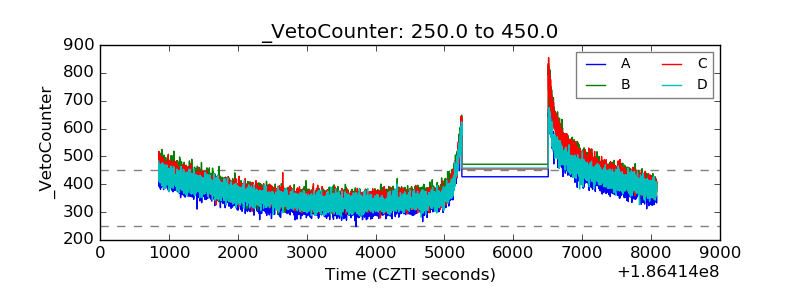 |