| Param | Original file | Final file |
|---|---|---|
| Filename | modeM0/AS1P01_161T02_9000000184_00912cztM0_level2.evt | modeM0/AS1P01_161T02_9000000184_00912cztM0_level2_quad_clean.evt |
| Size (bytes) | 1,019,312,640 | 70,974,720 |
| Size | 972.1 MB | 67.7 MB |
| Events in quadrant A | 6,879,182 | 450,919 |
| Events in quadrant B | 7,590,319 | 444,868 |
| Events in quadrant C | 7,031,017 | 440,622 |
| Events in quadrant D | 8,981,329 | 402,872 |
| Mode SS | |||
|---|---|---|---|
| Quadrant | BADHDUFLAG | Total packets | Discarded packets |
| A | 0 | 118 | 0 |
| B | 0 | 118 | 0 |
| C | 0 | 118 | 0 |
| D | 0 | 118 | 0 |
| Mode M0 | |||
|---|---|---|---|
| Quadrant | BADHDUFLAG | Total packets | Discarded packets |
| A | 0 | 24608 | 0 |
| B | 0 | 26712 | 0 |
| C | 0 | 25051 | 0 |
| D | 0 | 30952 | 0 |
| Mode M9 | |||
|---|---|---|---|
| Quadrant | BADHDUFLAG | Total packets | Discarded packets |
| A | 0 | 13 | 0 |
| B | 0 | 13 | 0 |
| C | 0 | 13 | 0 |
| D | 0 | 13 | 0 |
| Quadrant | Total seconds | Saturated seconds | Saturation percentage |
|---|---|---|---|
| A | 5863 | 26 | 0.443459% |
| B | 5863 | 51 | 0.869862% |
| C | 5864 | 53 | 0.903820% |
| D | 5864 | 601 | 10.248977% |
Noise dominated data is calculated using 1-second bins in cleaned event files. If a bin has >2000 counts, and if more than 50% of those come from <1% of pixels, then it is considered to be noise-dominated and hence unusable.
| Quadrant | # 1 sec bins | Bins with >0 counts | Bins with >2000 counts | High rate bins dominated by noise | Noise dominated (total time) | Noise dominated (detector-on time) | Marked lightcurve |
|---|---|---|---|---|---|---|---|
| A | 7133 | 5864 | 199 | 199 | 2.79% | 3.39% | 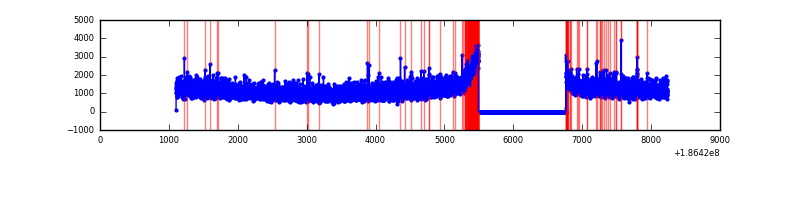 |
| B | 7133 | 5864 | 375 | 375 | 5.26% | 6.39% | 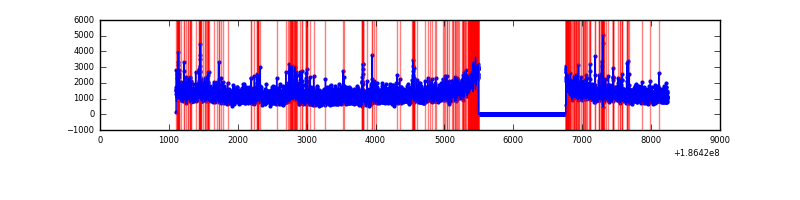 |
| C | 7134 | 5865 | 238 | 238 | 3.34% | 4.06% | 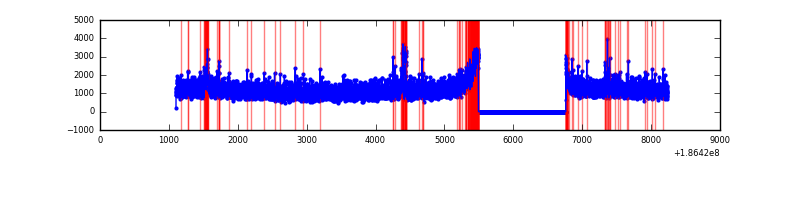 |
| D | 7134 | 5865 | 1284 | 1284 | 18.00% | 21.89% | 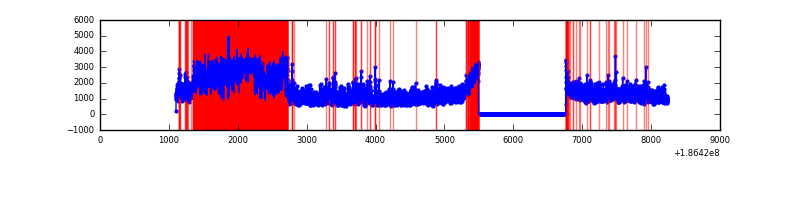 |
Top three noisy pixels from each quadrant. If the there are fewer than three noisy pixels in the level2.evt file, extra rows are filled as -1
| Pixel properties | Quadrant properties | ||||||
|---|---|---|---|---|---|---|---|
| Quadrant | DetID | PixID | Counts | Sigma | Mean | Median | Sigma |
| A | 15 | 127 | 112317 | 264.09 | 1761 | 1773 | 418.6 |
| A | 15 | 233 | 11752 | 23.84 | 1761 | 1773 | 418.6 |
| A | 11 | 79 | 5565 | 9.06 | 1761 | 1773 | 418.6 |
| B | 3 | 0 | 354659 | 836.87 | 1833 | 1841 | 421.6 |
| B | 7 | 221 | 73274 | 169.44 | 1833 | 1841 | 421.6 |
| B | 5 | 249 | 64833 | 149.41 | 1833 | 1841 | 421.6 |
| C | 12 | 254 | 77867 | 160.47 | 1722 | 1783 | 474.1 |
| C | 9 | 52 | 77741 | 160.21 | 1722 | 1783 | 474.1 |
| C | 15 | 241 | 53331 | 108.72 | 1722 | 1783 | 474.1 |
| D | 12 | 188 | 2520037 | 5050.6 | 1626 | 1681 | 498.6 |
| D | 1 | 4 | 177700 | 353.01 | 1626 | 1681 | 498.6 |
| D | 10 | 102 | 54892 | 106.72 | 1626 | 1681 | 498.6 |
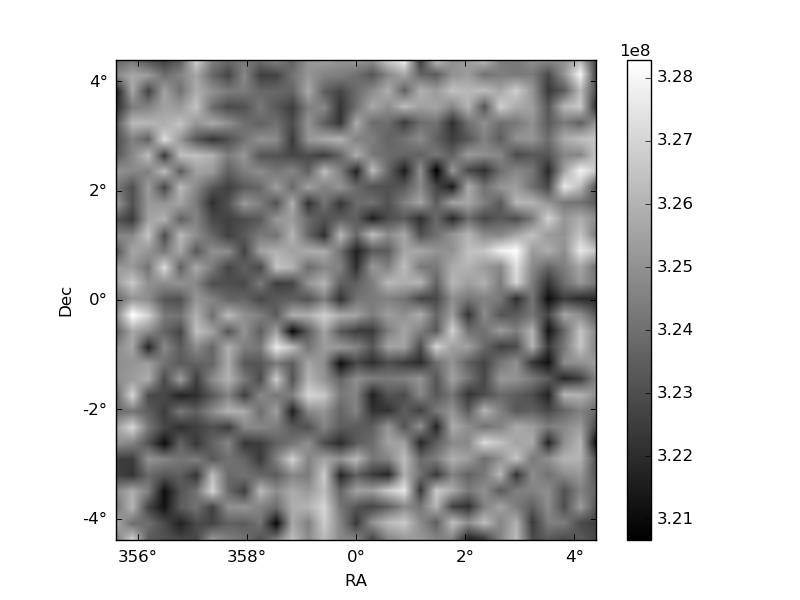
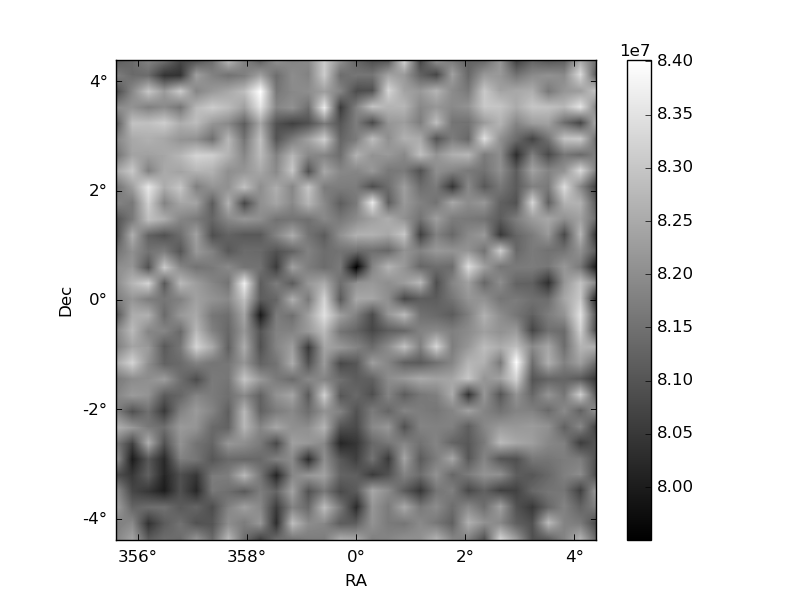
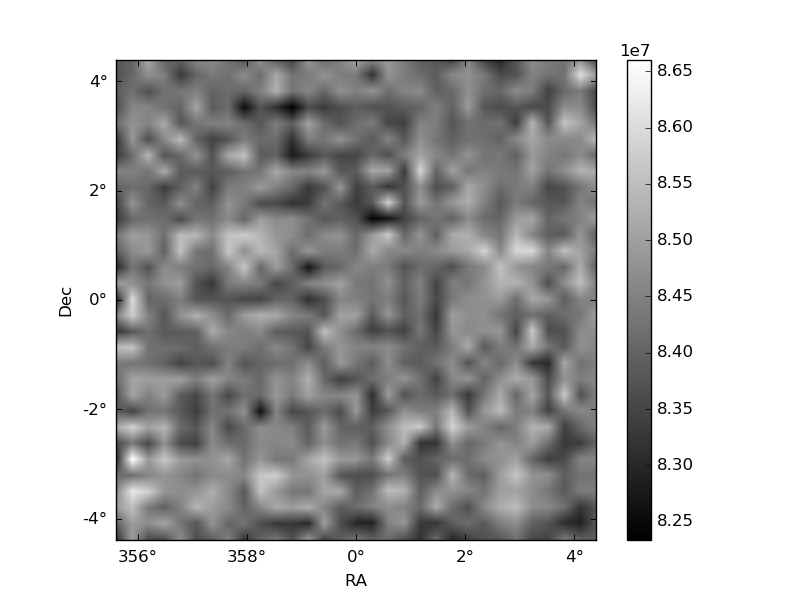
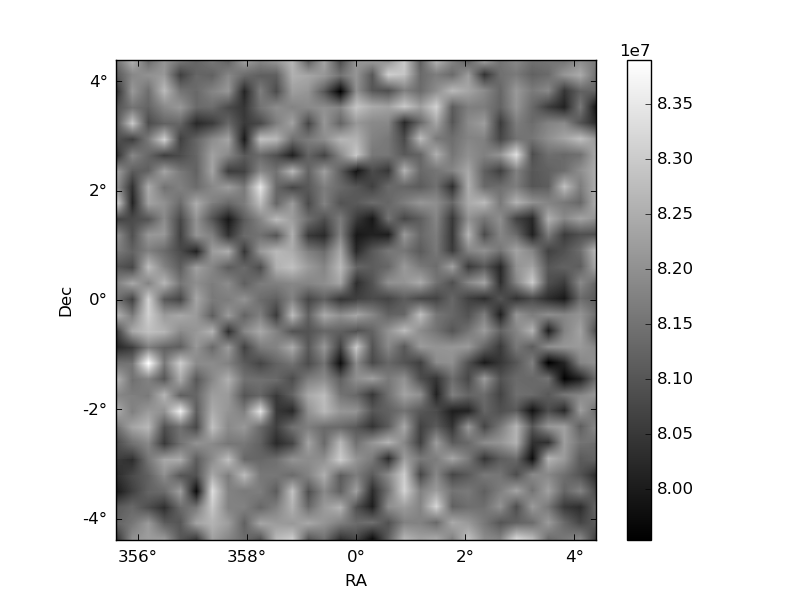
Histogram calculated using DETX and DETY for each event in the final _common_clean file
| Quadrant A | 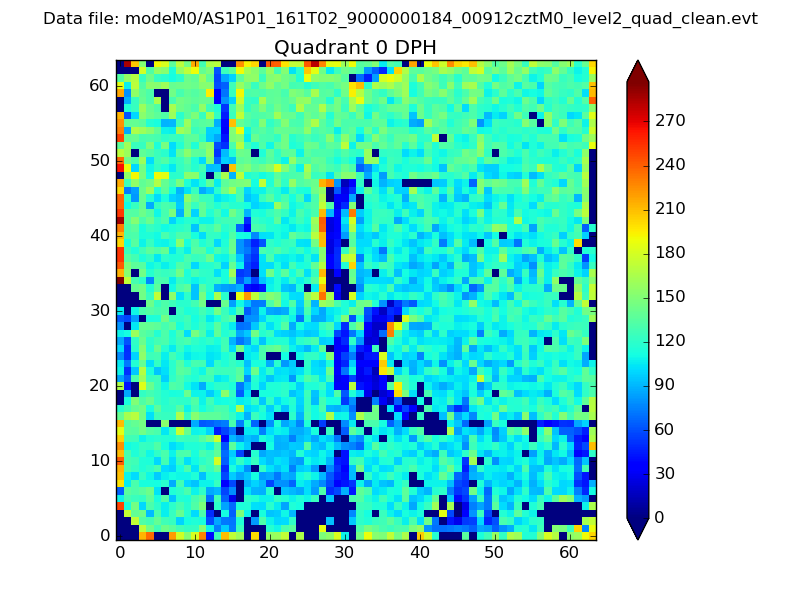 |
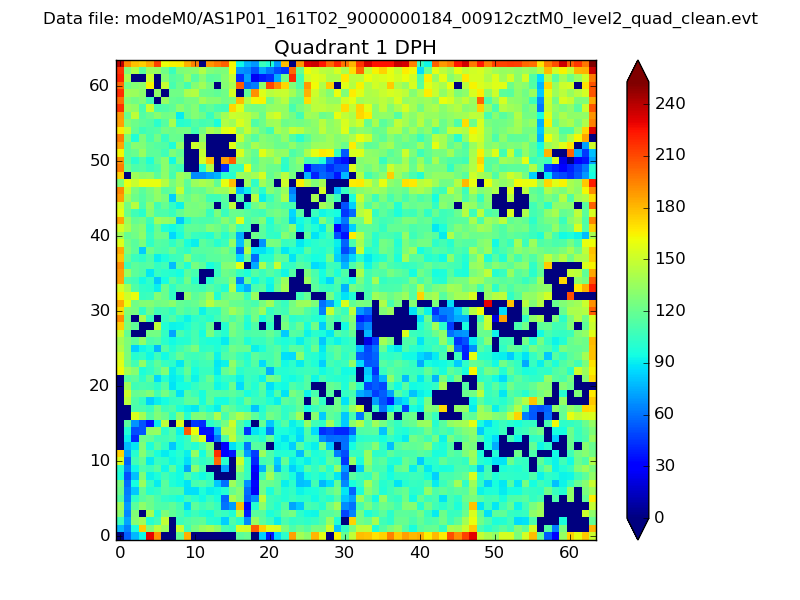 |
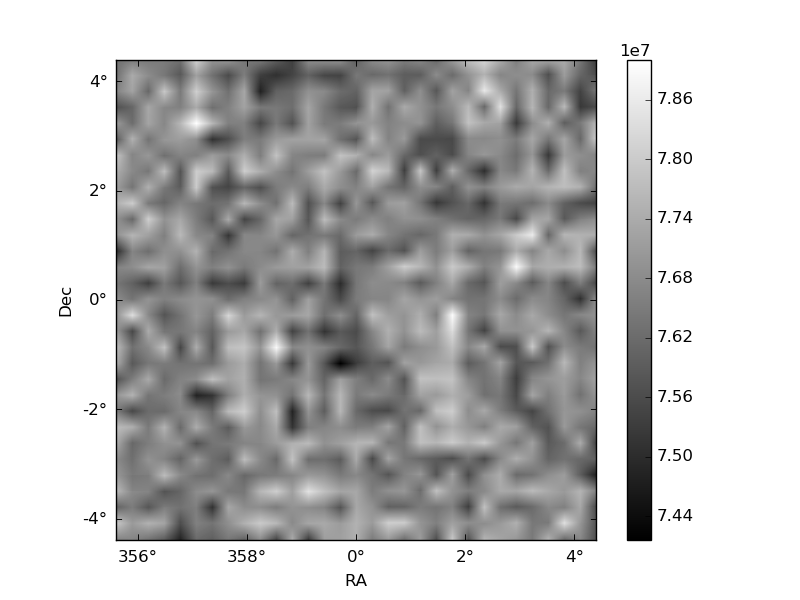
Quadrant B |
|---|---|---|---|
| Quadrant D | 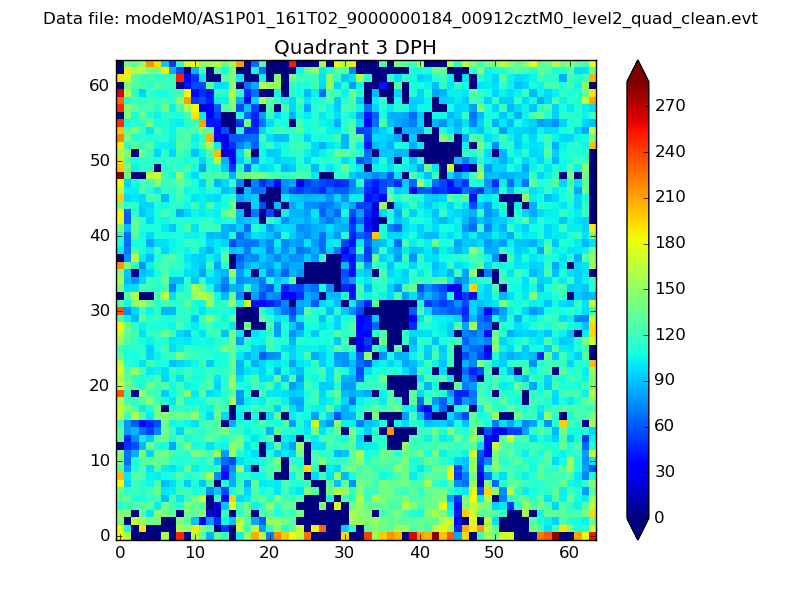 |
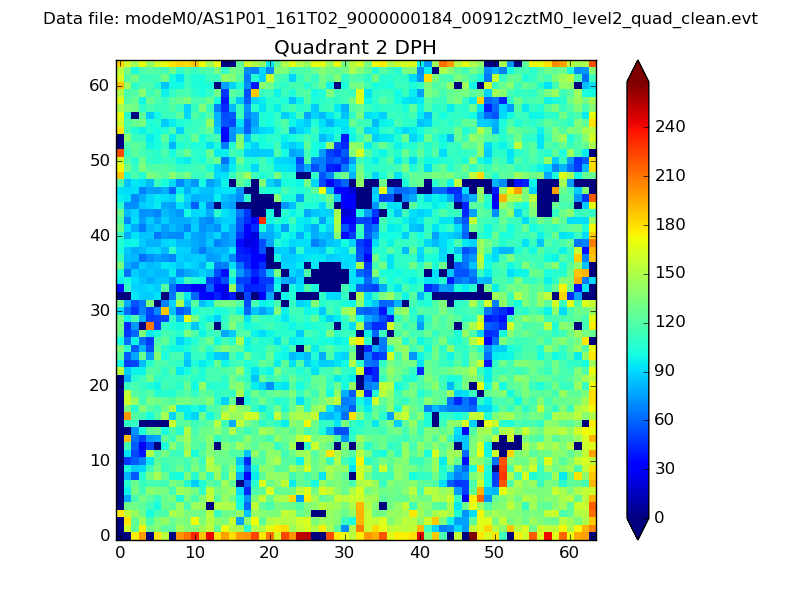 |
Quadrant C |
| Plot type | Count rate plots | Images |
|---|---|---|
| Comparison with Poisson distribution Blue bars denote a histogram of data divided into 1 sec bins. Red curve is a Poisson curve with rate = median count rate of data. |
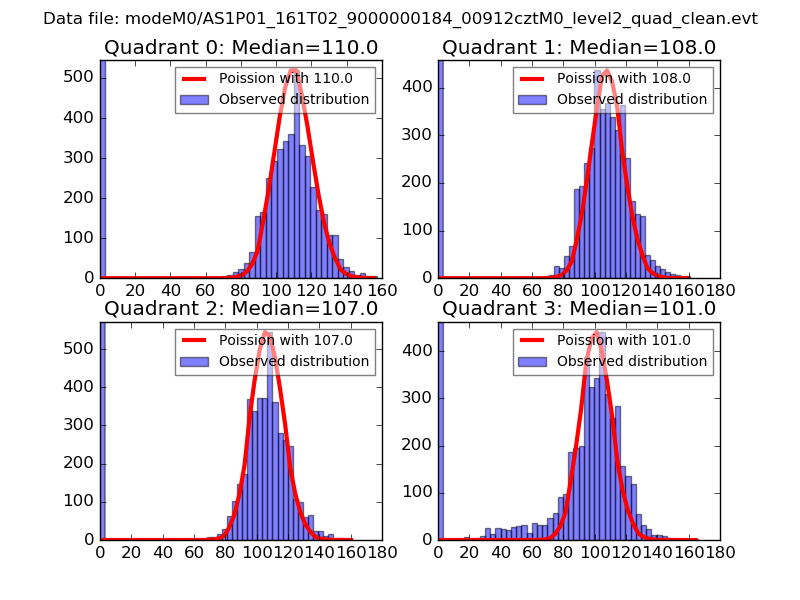 |
 |
| Quadrant-wise count rates Data is divided into 100 sec bins |
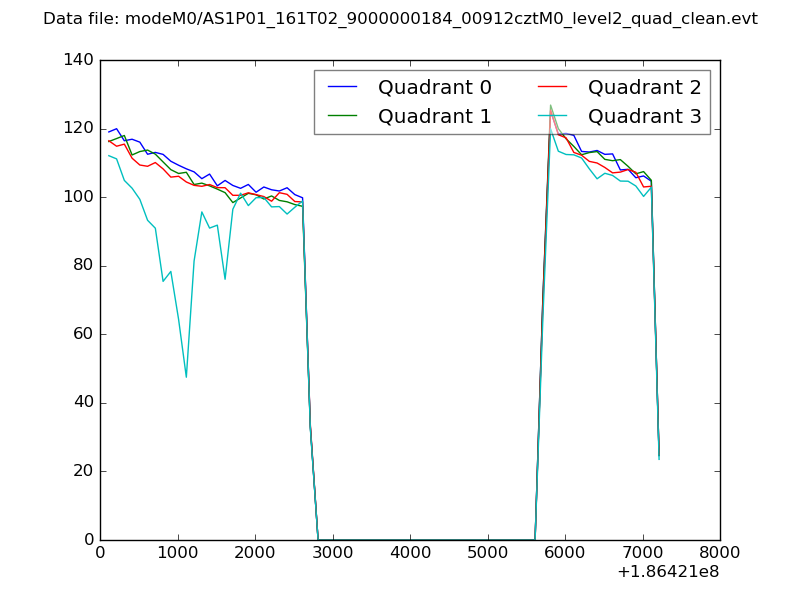 |
|
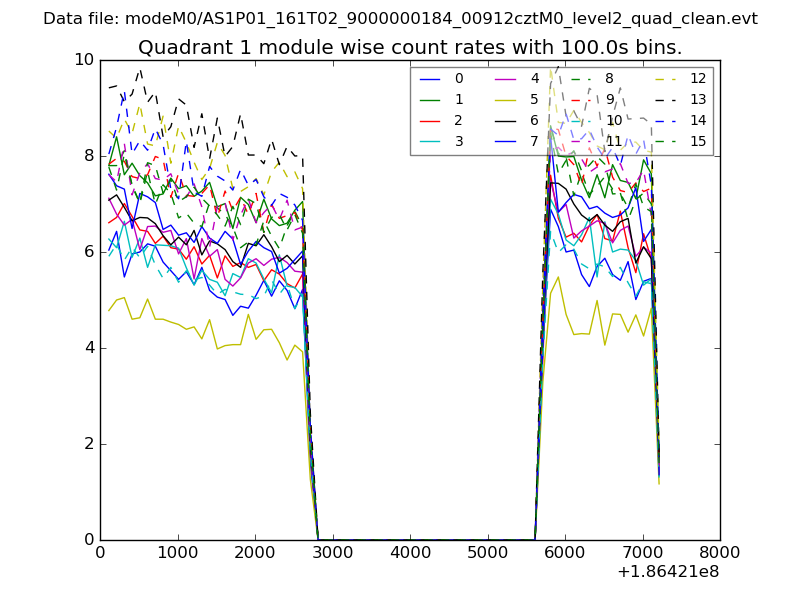
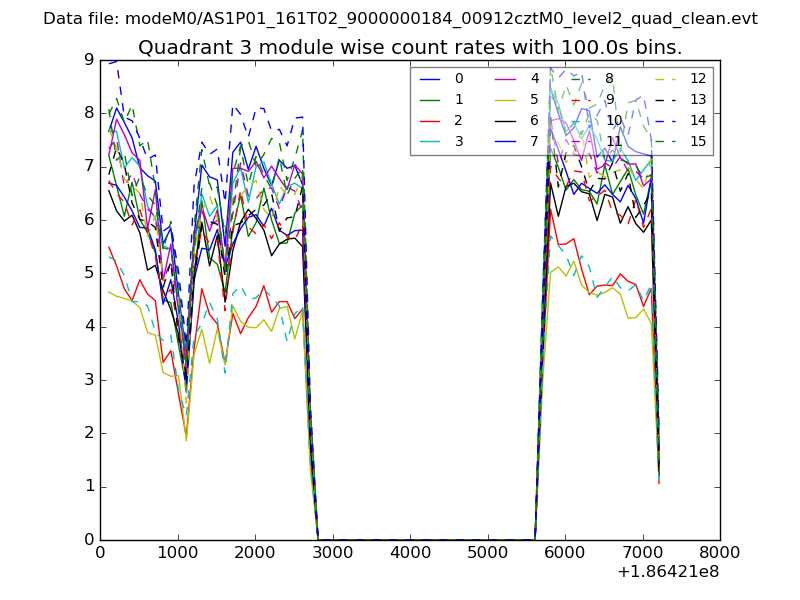
| Module-wise count rates for Quadrant A Data is divided into 100 sec bins |
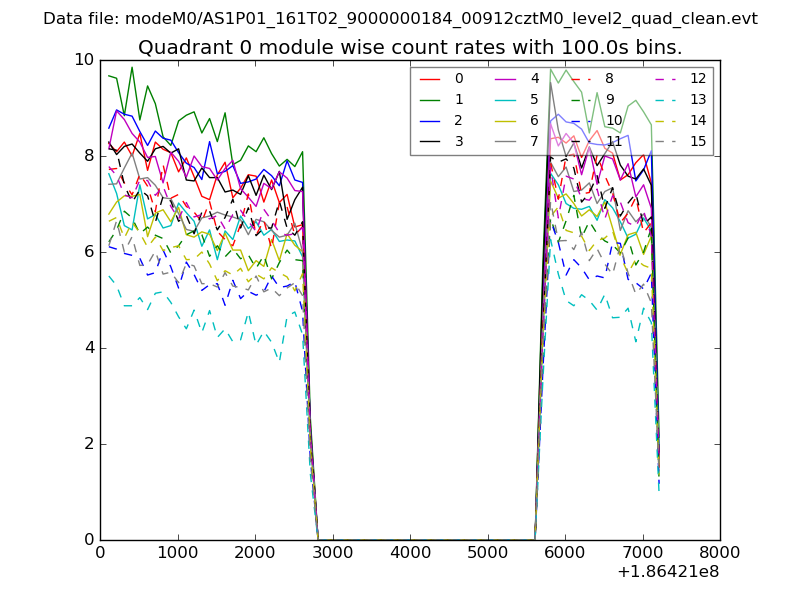 |
 |
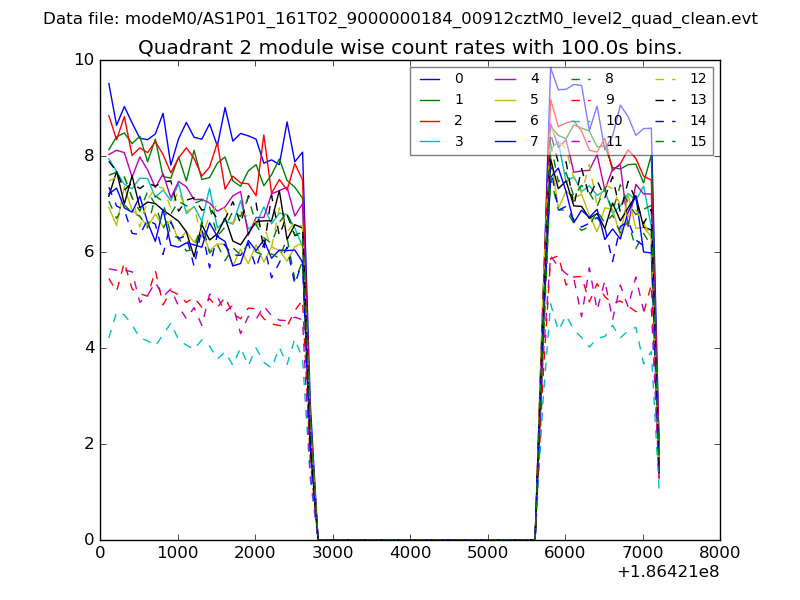
| Module-wise count rates for Quadrant B Data is divided into 100 sec bins |
 |
 |
| Module-wise count rates for Quadrant C Data is divided into 100 sec bins |
 |
 |
| Module-wise count rates for Quadrant D Data is divided into 100 sec bins |
 |
 |
| Parameter | Plot |
|---|---|
| CZT HV Monitor | 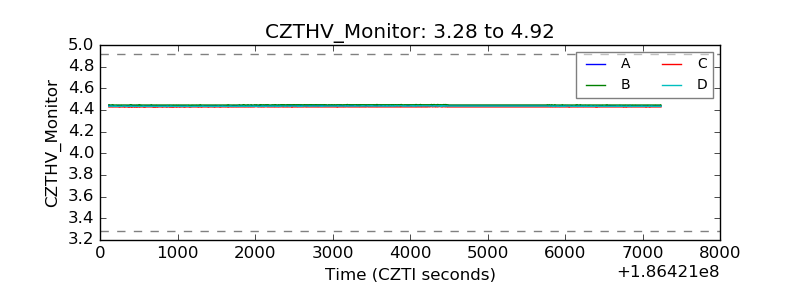 |
| D_VDD | 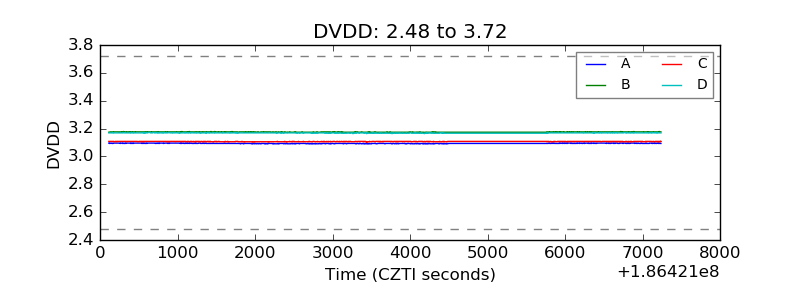 |
| Temperature 1 | 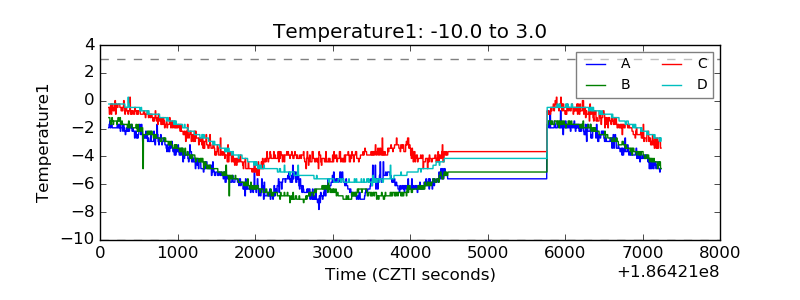 |
| Veto HV Monitor | 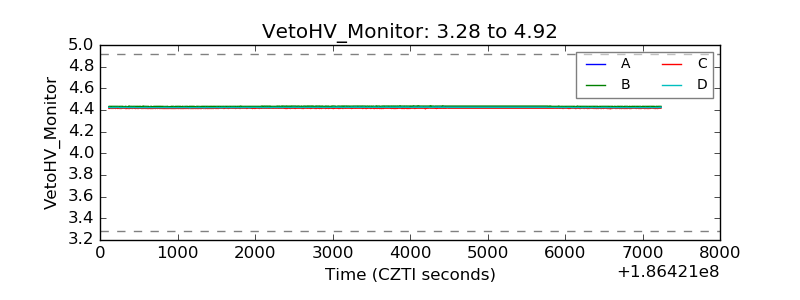 |
| Veto LLD | 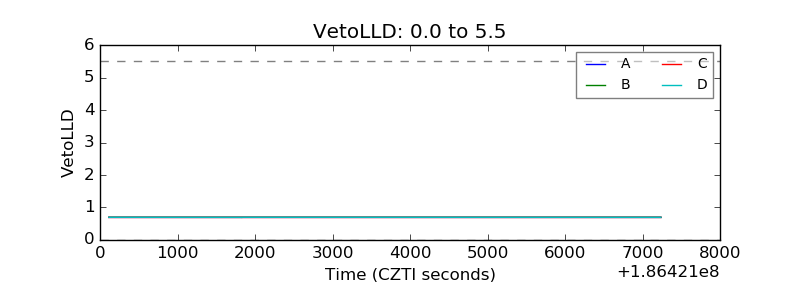 |
| Alpha Counter | 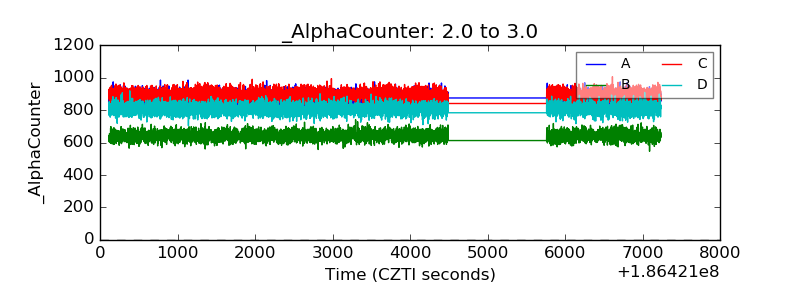 |
| _CPM_Rate | 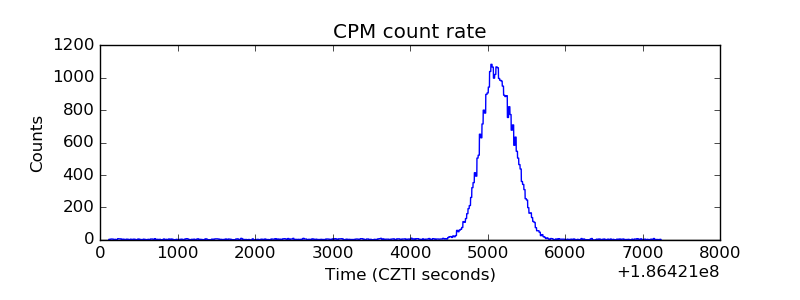 |
| CZT Counter | 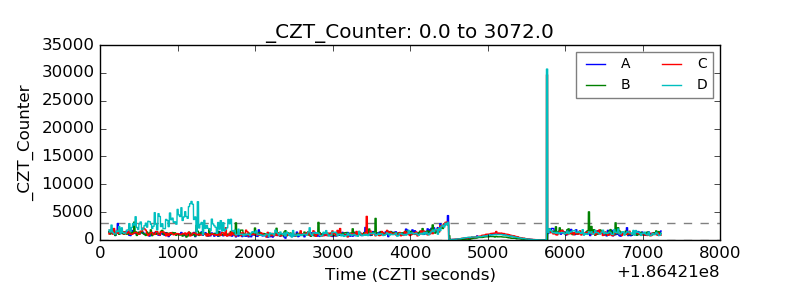 |
| +2.5 Volts monitor |  |
| +5 Volts monitor |  |
| _ROLL_ROT | 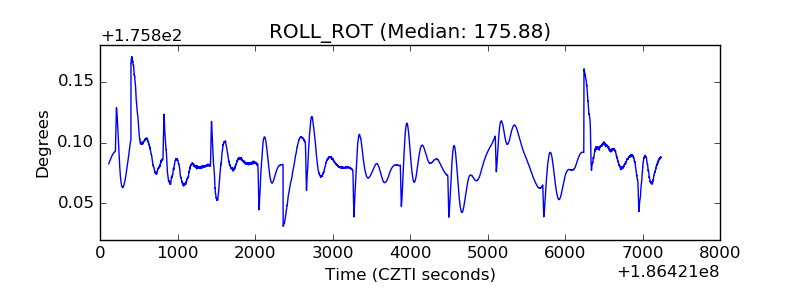 |
| _Roll_DEC | 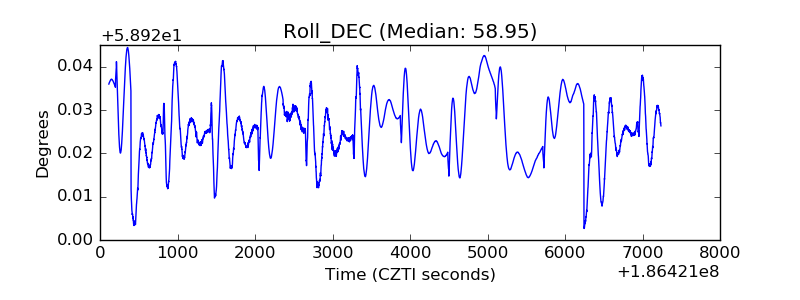 |
| _Roll_RA | 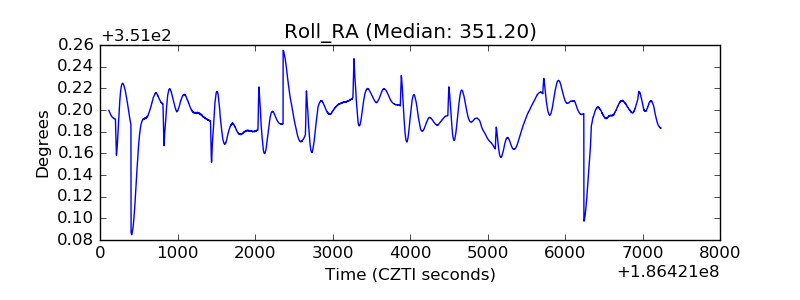 |
| Veto Counter | 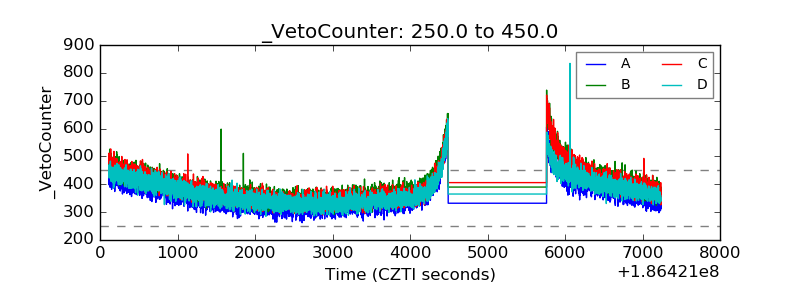 |