| Param | Original file | Final file |
|---|---|---|
| Filename | modeM0/AS1P01_161T02_9000000184_00913cztM0_level2.evt | modeM0/AS1P01_161T02_9000000184_00913cztM0_level2_quad_clean.evt |
| Size (bytes) | 1,005,439,680 | 76,161,600 |
| Size | 958.9 MB | 72.6 MB |
| Events in quadrant A | 7,352,769 | 474,787 |
| Events in quadrant B | 8,089,110 | 472,714 |
| Events in quadrant C | 7,384,213 | 467,365 |
| Events in quadrant D | 7,211,045 | 456,788 |
| Mode SS | |||
|---|---|---|---|
| Quadrant | BADHDUFLAG | Total packets | Discarded packets |
| A | 0 | 126 | 0 |
| B | 0 | 126 | 0 |
| C | 0 | 126 | 0 |
| D | 0 | 126 | 0 |
| Mode M0 | |||
|---|---|---|---|
| Quadrant | BADHDUFLAG | Total packets | Discarded packets |
| A | 0 | 26246 | 0 |
| B | 0 | 28439 | 0 |
| C | 0 | 26368 | 0 |
| D | 0 | 25873 | 0 |
| Mode M9 | |||
|---|---|---|---|
| Quadrant | BADHDUFLAG | Total packets | Discarded packets |
| A | 0 | 12 | 0 |
| B | 0 | 12 | 0 |
| C | 0 | 12 | 0 |
| D | 0 | 12 | 0 |
| Quadrant | Total seconds | Saturated seconds | Saturation percentage |
|---|---|---|---|
| A | 6226 | 11 | 0.176678% |
| B | 6226 | 46 | 0.738837% |
| C | 6227 | 22 | 0.353300% |
| D | 6227 | 18 | 0.289064% |
Noise dominated data is calculated using 1-second bins in cleaned event files. If a bin has >2000 counts, and if more than 50% of those come from <1% of pixels, then it is considered to be noise-dominated and hence unusable.
| Quadrant | # 1 sec bins | Bins with >0 counts | Bins with >2000 counts | High rate bins dominated by noise | Noise dominated (total time) | Noise dominated (detector-on time) | Marked lightcurve |
|---|---|---|---|---|---|---|---|
| A | 7386 | 6227 | 231 | 231 | 3.13% | 3.71% |  |
| B | 7386 | 6227 | 396 | 396 | 5.36% | 6.36% | 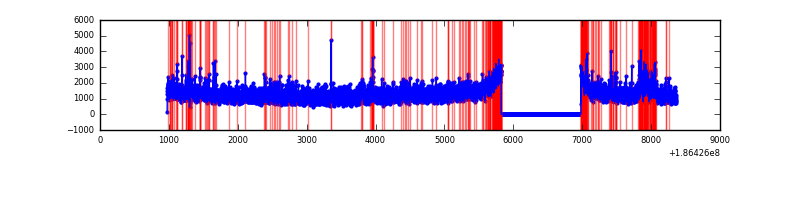 |
| C | 7387 | 6228 | 231 | 231 | 3.13% | 3.71% |  |
| D | 7387 | 6228 | 231 | 231 | 3.13% | 3.71% | 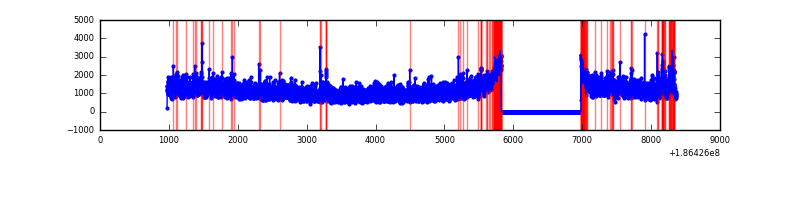 |
Top three noisy pixels from each quadrant. If the there are fewer than three noisy pixels in the level2.evt file, extra rows are filled as -1
| Pixel properties | Quadrant properties | ||||||
|---|---|---|---|---|---|---|---|
| Quadrant | DetID | PixID | Counts | Sigma | Mean | Median | Sigma |
| A | 15 | 127 | 208004 | 467.16 | 1859 | 1878 | 441.2 |
| A | 14 | 170 | 15479 | 30.82 | 1859 | 1878 | 441.2 |
| A | 11 | 79 | 6911 | 11.41 | 1859 | 1878 | 441.2 |
| B | 3 | 0 | 379709 | 829.1 | 1954 | 1962 | 455.6 |
| B | 7 | 221 | 79581 | 170.36 | 1954 | 1962 | 455.6 |
| B | 5 | 249 | 60480 | 128.44 | 1954 | 1962 | 455.6 |
| C | 15 | 241 | 141937 | 278.21 | 1821 | 1884 | 503.4 |
| C | 9 | 83 | 34012 | 63.82 | 1821 | 1884 | 503.4 |
| C | 2 | 53 | 28466 | 52.8 | 1821 | 1884 | 503.4 |
| D | 12 | 188 | 241205 | 445.95 | 1752 | 1815 | 536.8 |
| D | 1 | 4 | 176506 | 325.42 | 1752 | 1815 | 536.8 |
| D | 13 | 73 | 95487 | 174.5 | 1752 | 1815 | 536.8 |
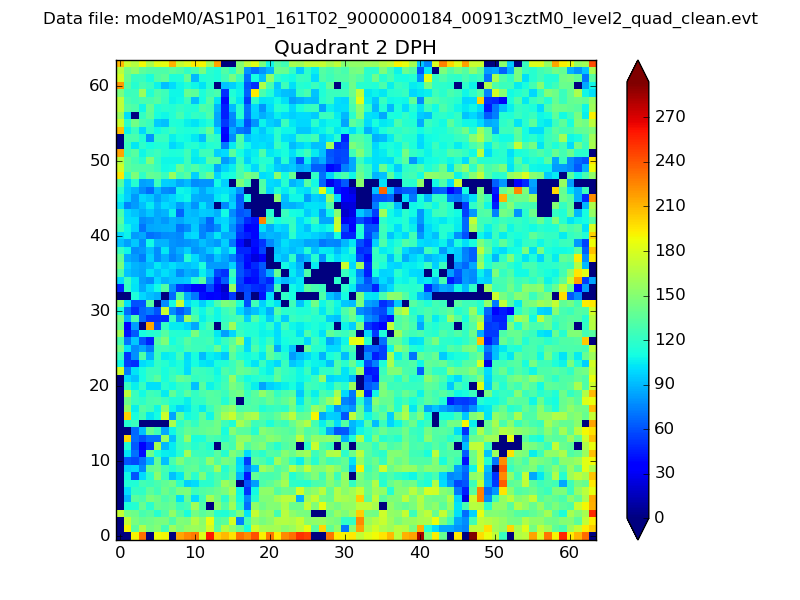
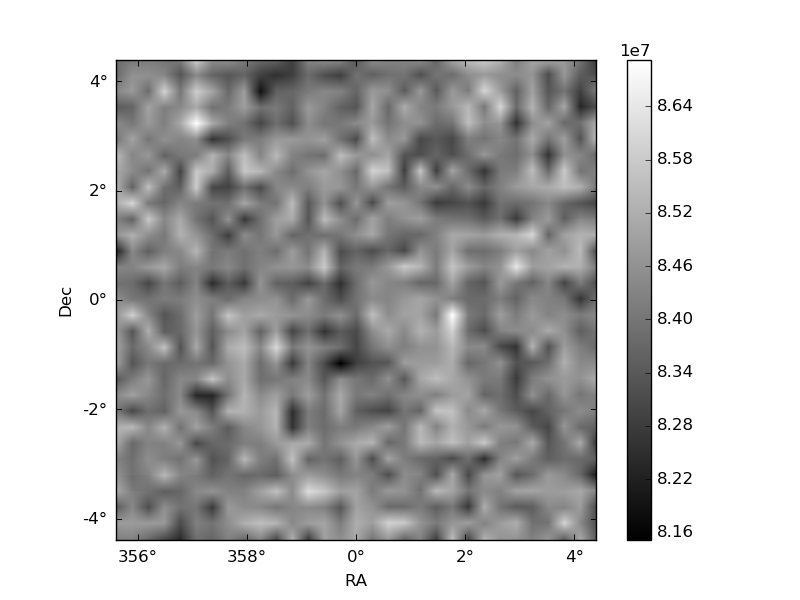
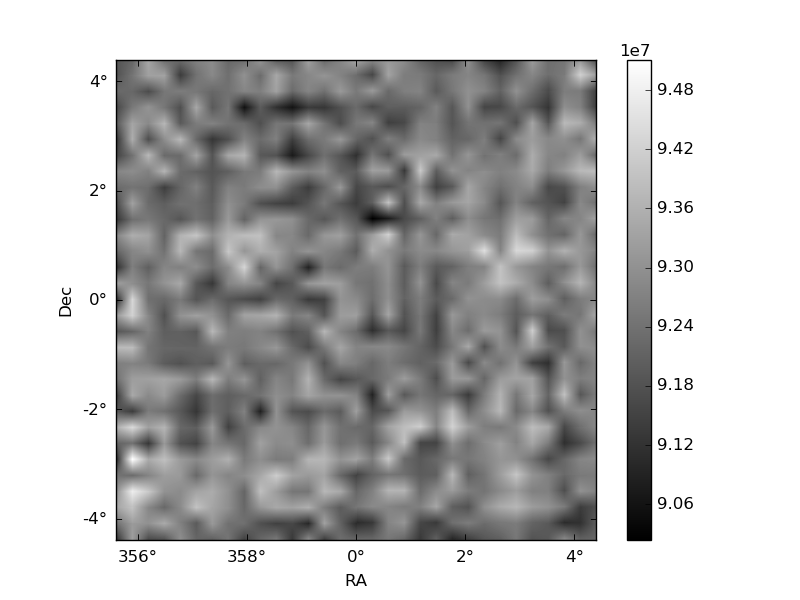
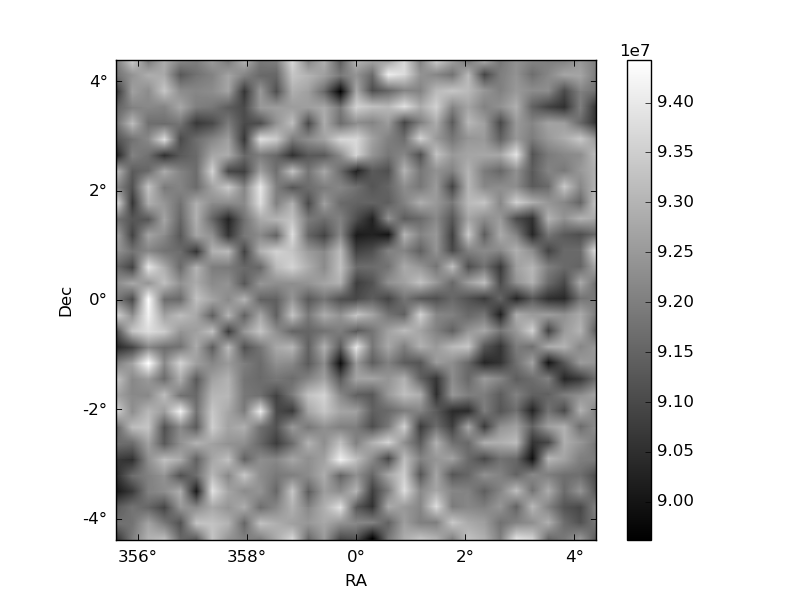
Histogram calculated using DETX and DETY for each event in the final _common_clean file
| Quadrant A | 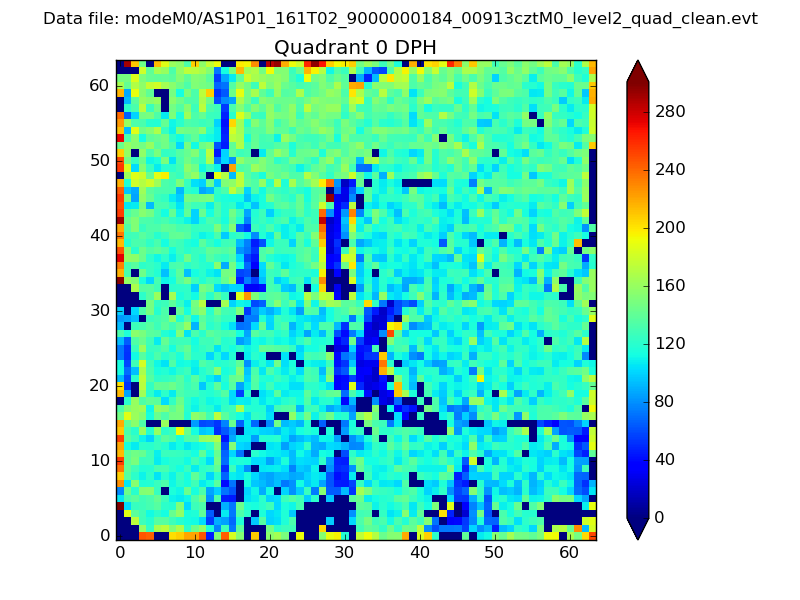 |
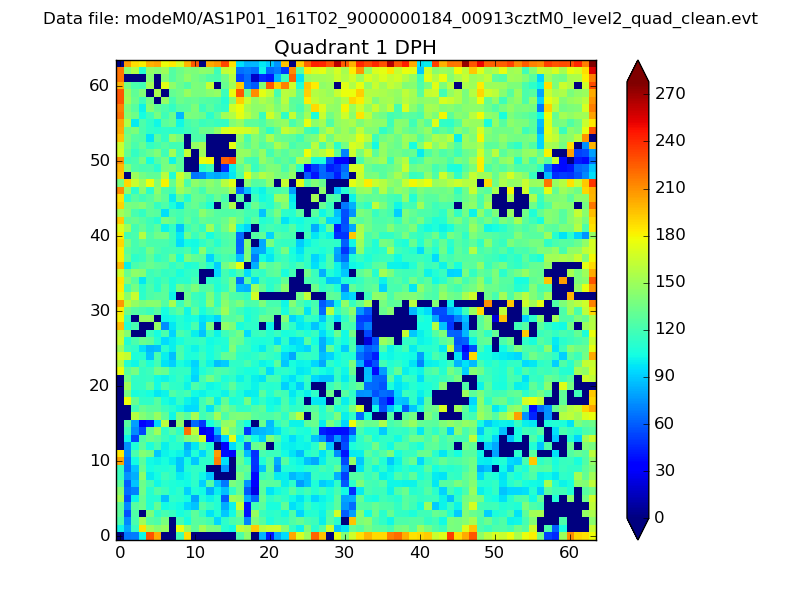 |
Quadrant B |
|---|---|---|---|
| Quadrant D | 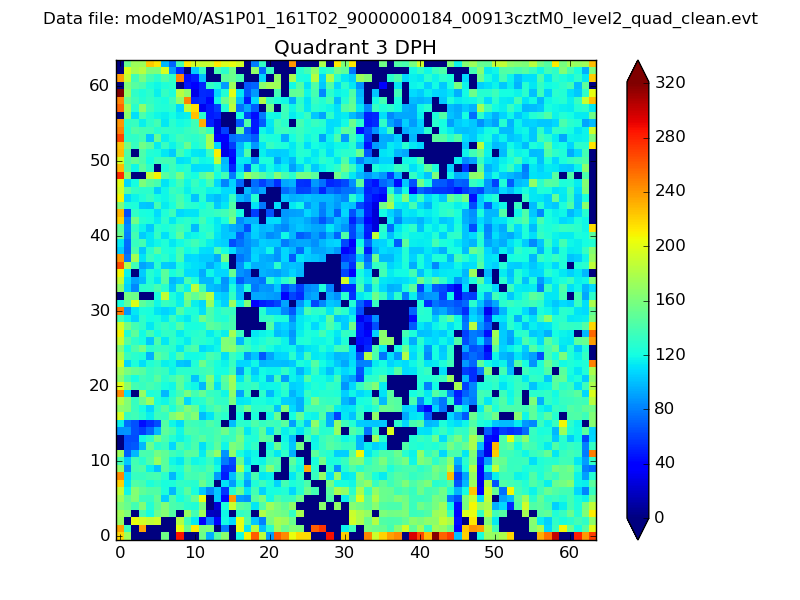 |
 |
Quadrant C |
| Plot type | Count rate plots | Images |
|---|---|---|
| Comparison with Poisson distribution Blue bars denote a histogram of data divided into 1 sec bins. Red curve is a Poisson curve with rate = median count rate of data. |
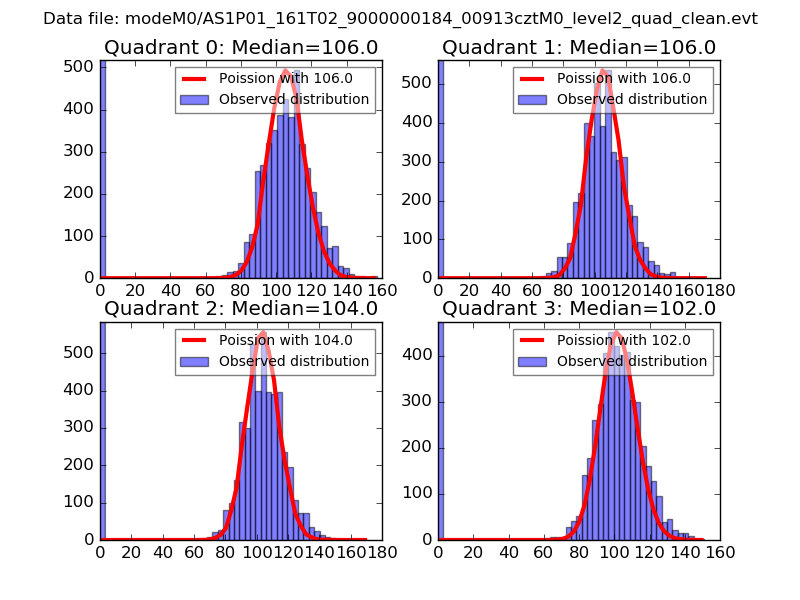 |
 |
| Quadrant-wise count rates Data is divided into 100 sec bins |
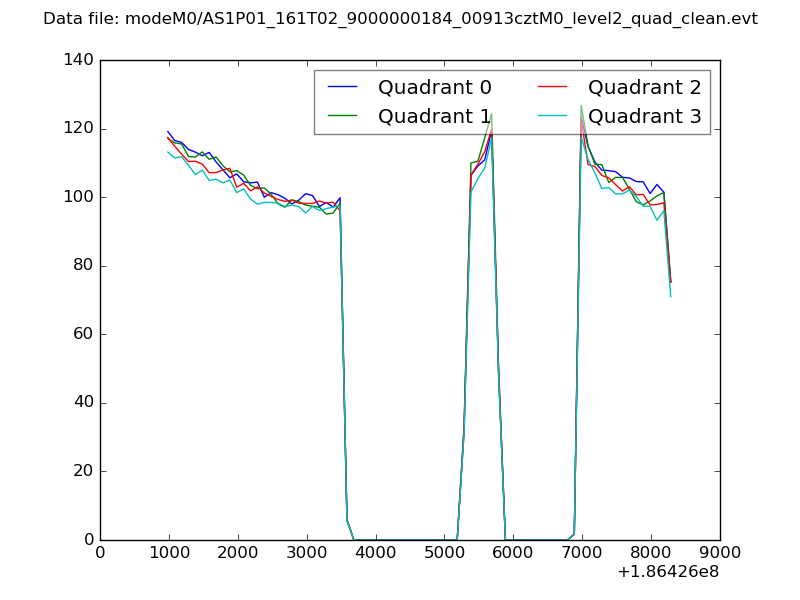 |
|
| Module-wise count rates for Quadrant A Data is divided into 100 sec bins |
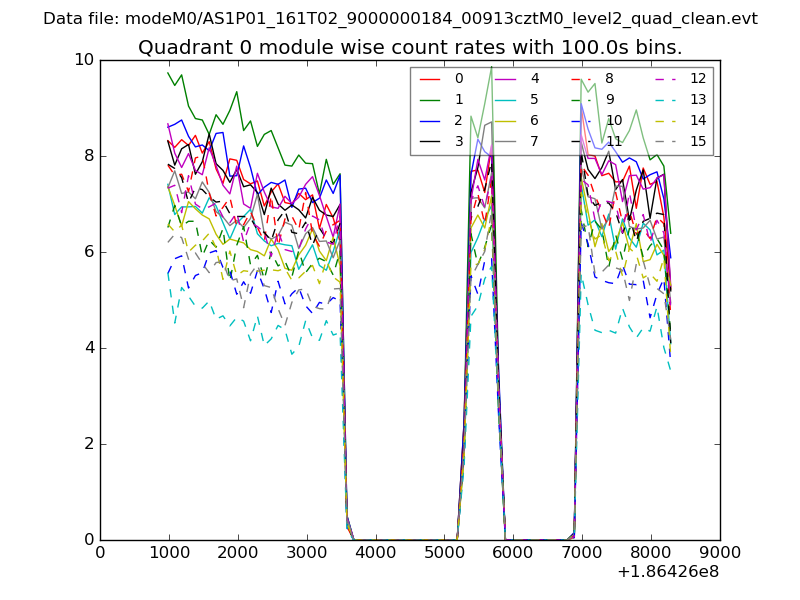 |
 |
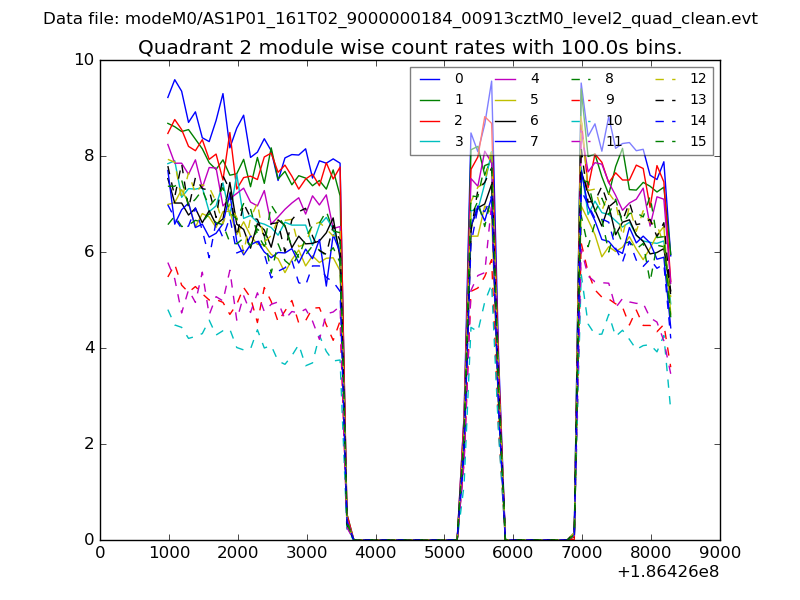
| Module-wise count rates for Quadrant B Data is divided into 100 sec bins |
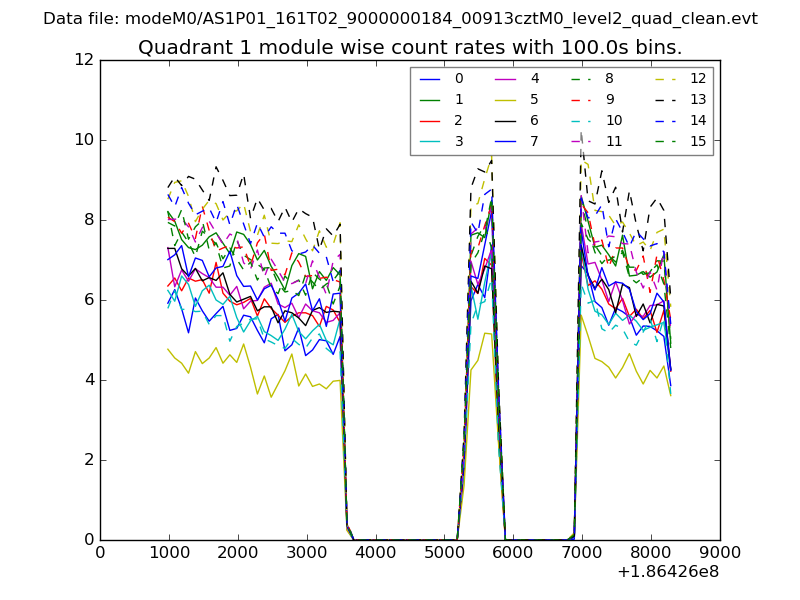 |
 |
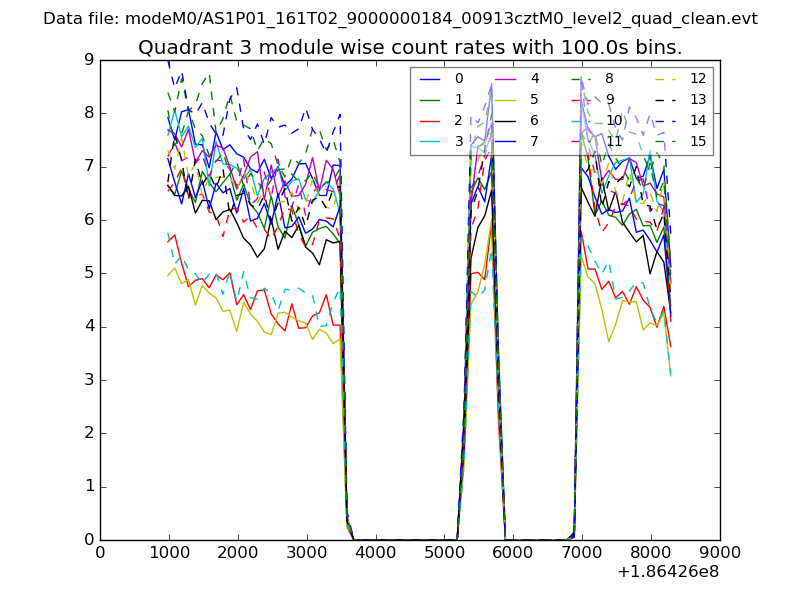
| Module-wise count rates for Quadrant C Data is divided into 100 sec bins |
 |
 |
| Module-wise count rates for Quadrant D Data is divided into 100 sec bins |
 |
 |
| Parameter | Plot |
|---|---|
| CZT HV Monitor | 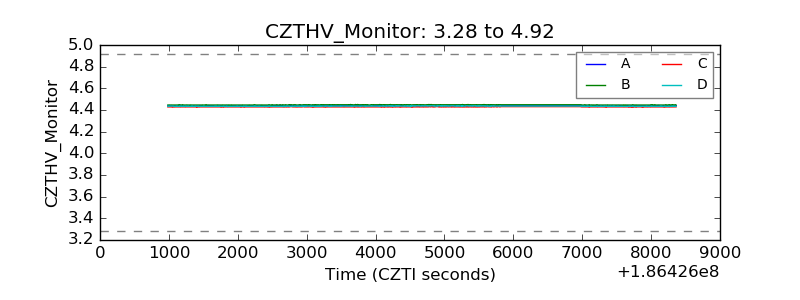 |
| D_VDD | 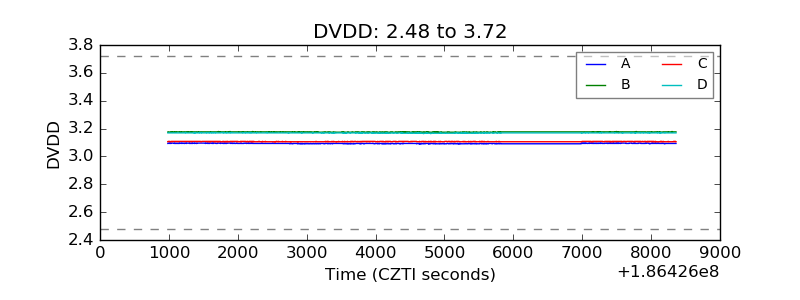 |
| Temperature 1 | 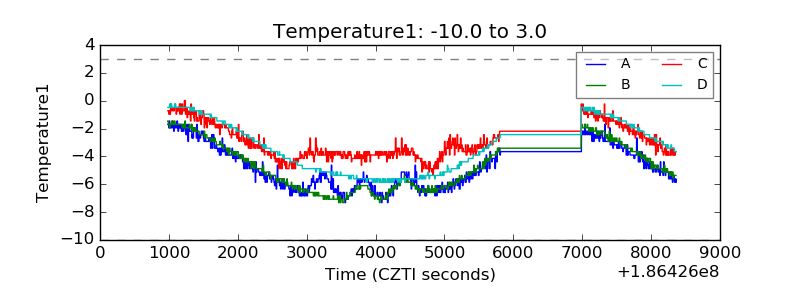 |
| Veto HV Monitor | 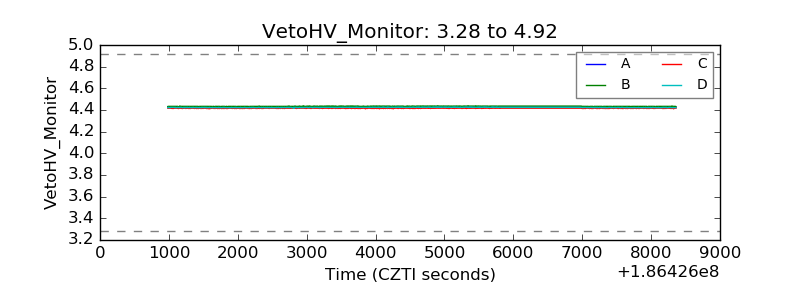 |
| Veto LLD | 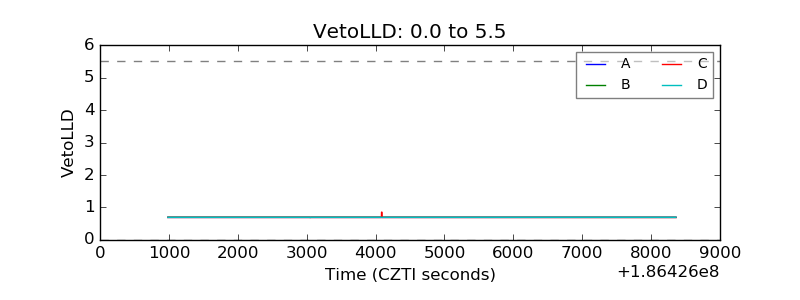 |
| Alpha Counter | 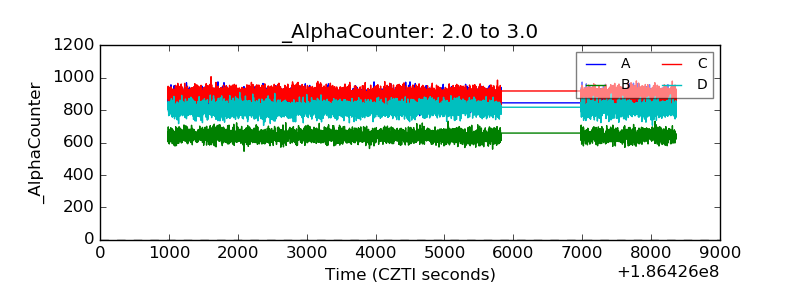 |
| _CPM_Rate | 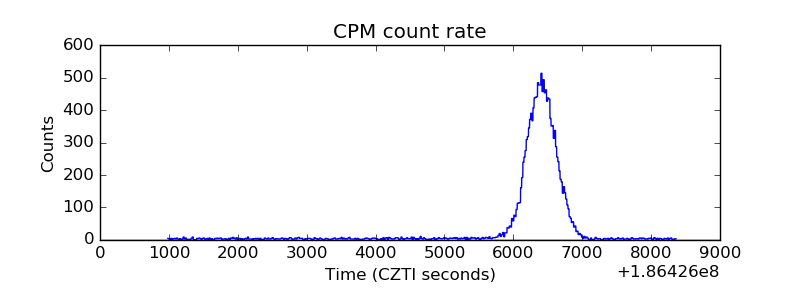 |
| CZT Counter | 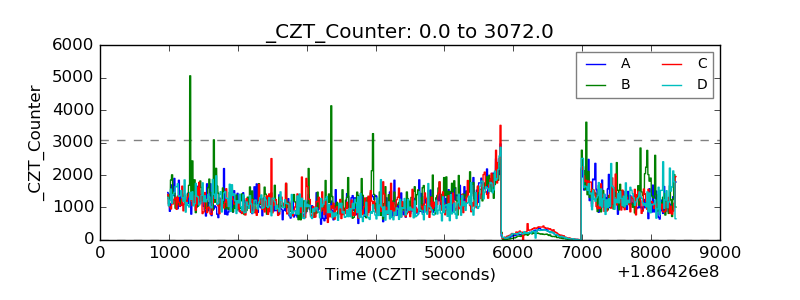 |
| +2.5 Volts monitor |  |
| +5 Volts monitor |  |
| _ROLL_ROT | 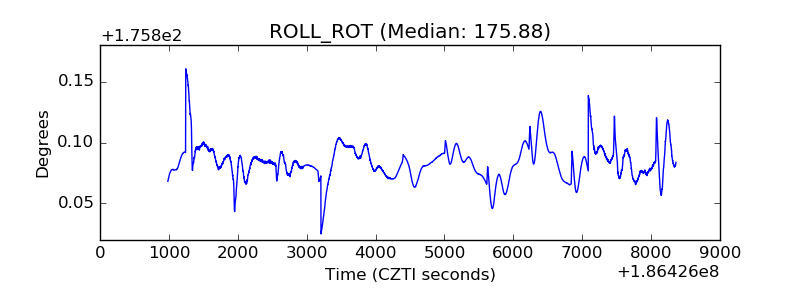 |
| _Roll_DEC | 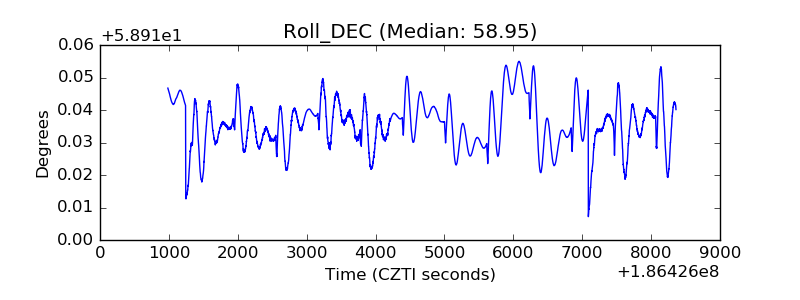 |
| _Roll_RA | 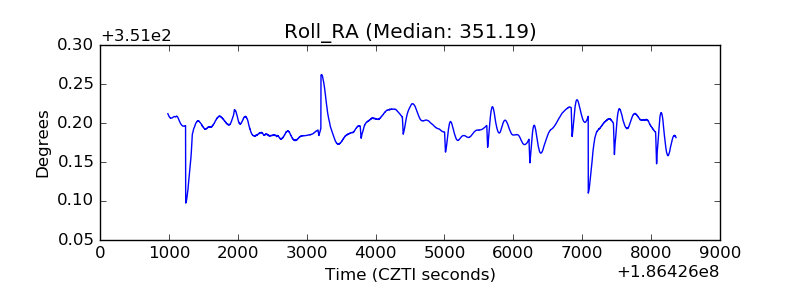 |
| Veto Counter | 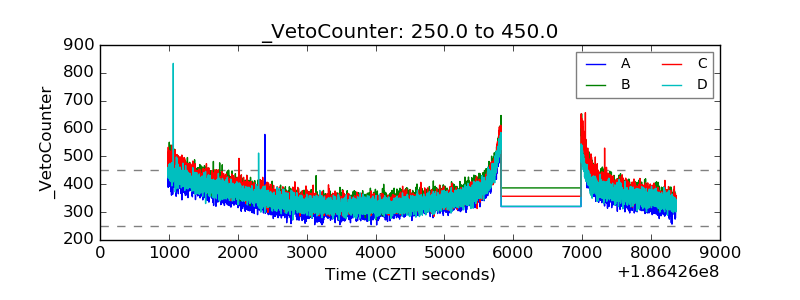 |