| Param | Original file | Final file |
|---|---|---|
| Filename | modeM0/AS1P01_161T02_9000000184_00914cztM0_level2.evt | modeM0/AS1P01_161T02_9000000184_00914cztM0_level2_quad_clean.evt |
| Size (bytes) | 1,086,387,840 | 80,985,600 |
| Size | 1.0 GB | 77.2 MB |
| Events in quadrant A | 7,724,893 | 505,306 |
| Events in quadrant B | 8,566,100 | 501,315 |
| Events in quadrant C | 8,075,365 | 495,875 |
| Events in quadrant D | 8,090,867 | 482,767 |
| Mode SS | |||
|---|---|---|---|
| Quadrant | BADHDUFLAG | Total packets | Discarded packets |
| A | 0 | 136 | 0 |
| B | 0 | 136 | 0 |
| C | 0 | 136 | 0 |
| D | 0 | 136 | 0 |
| Mode M0 | |||
|---|---|---|---|
| Quadrant | BADHDUFLAG | Total packets | Discarded packets |
| A | 0 | 27729 | 0 |
| B | 0 | 30178 | 0 |
| C | 0 | 28720 | 0 |
| D | 0 | 28817 | 0 |
| Mode M9 | |||
|---|---|---|---|
| Quadrant | BADHDUFLAG | Total packets | Discarded packets |
| A | 0 | 9 | 0 |
| B | 0 | 9 | 0 |
| C | 0 | 9 | 0 |
| D | 0 | 9 | 0 |
| Quadrant | Total seconds | Saturated seconds | Saturation percentage |
|---|---|---|---|
| A | 6701 | 5 | 0.074616% |
| B | 6702 | 67 | 0.999702% |
| C | 6702 | 7 | 0.104446% |
| D | 6702 | 104 | 1.551776% |
Noise dominated data is calculated using 1-second bins in cleaned event files. If a bin has >2000 counts, and if more than 50% of those come from <1% of pixels, then it is considered to be noise-dominated and hence unusable.
| Quadrant | # 1 sec bins | Bins with >0 counts | Bins with >2000 counts | High rate bins dominated by noise | Noise dominated (total time) | Noise dominated (detector-on time) | Marked lightcurve |
|---|---|---|---|---|---|---|---|
| A | 7601 | 6702 | 185 | 185 | 2.43% | 2.76% | 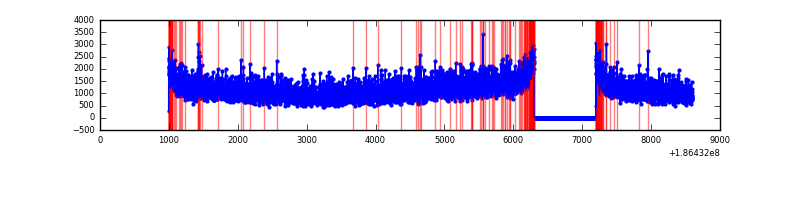 |
| B | 7602 | 6703 | 415 | 415 | 5.46% | 6.19% | 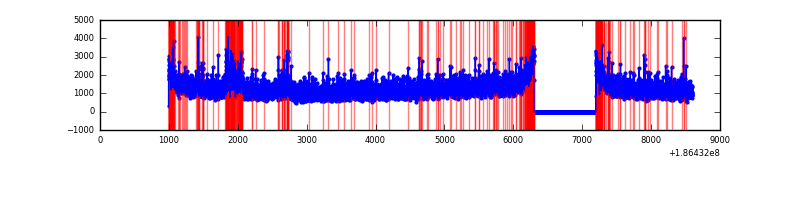 |
| C | 7602 | 6703 | 227 | 227 | 2.99% | 3.39% | 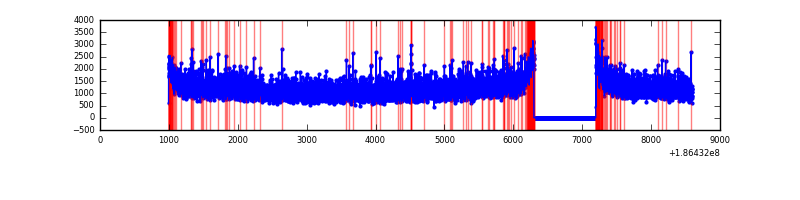 |
| D | 7602 | 6703 | 430 | 430 | 5.66% | 6.42% | 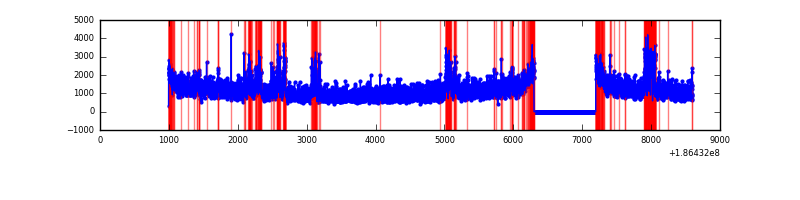 |
Top three noisy pixels from each quadrant. If the there are fewer than three noisy pixels in the level2.evt file, extra rows are filled as -1
| Pixel properties | Quadrant properties | ||||||
|---|---|---|---|---|---|---|---|
| Quadrant | DetID | PixID | Counts | Sigma | Mean | Median | Sigma |
| A | 15 | 127 | 72561 | 148.71 | 1990 | 2001 | 474.5 |
| A | 14 | 170 | 15467 | 28.38 | 1990 | 2001 | 474.5 |
| A | 11 | 79 | 8677 | 14.07 | 1990 | 2001 | 474.5 |
| B | 3 | 0 | 422173 | 860.71 | 2098 | 2106 | 488.0 |
| B | 8 | 234 | 31993 | 61.24 | 2098 | 2106 | 488.0 |
| B | 7 | 221 | 28916 | 54.93 | 2098 | 2106 | 488.0 |
| C | 15 | 241 | 382352 | 707.72 | 1941 | 2014 | 537.4 |
| C | 3 | 111 | 25305 | 43.34 | 1941 | 2014 | 537.4 |
| C | 9 | 83 | 24094 | 41.09 | 1941 | 2014 | 537.4 |
| D | 12 | 188 | 535848 | 935.2 | 1858 | 1923 | 570.9 |
| D | 1 | 4 | 266759 | 463.88 | 1858 | 1923 | 570.9 |
| D | 2 | 170 | 232333 | 403.58 | 1858 | 1923 | 570.9 |
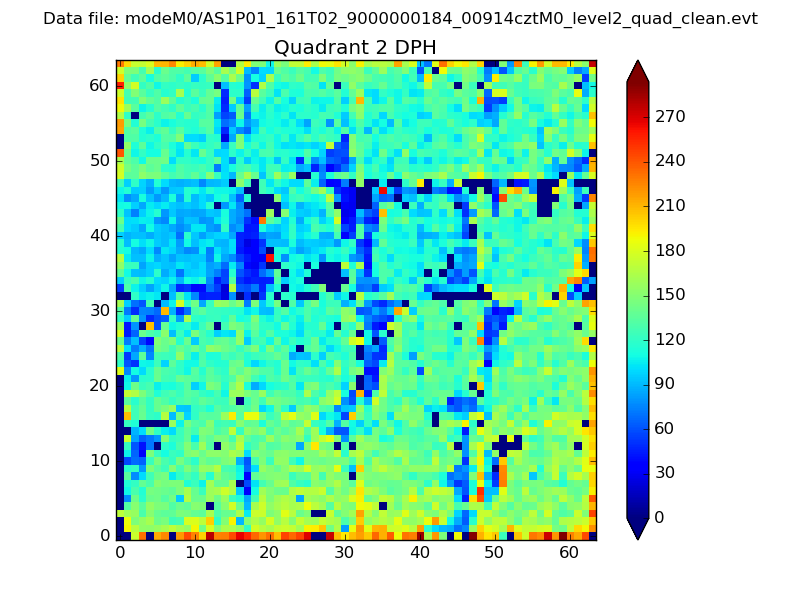
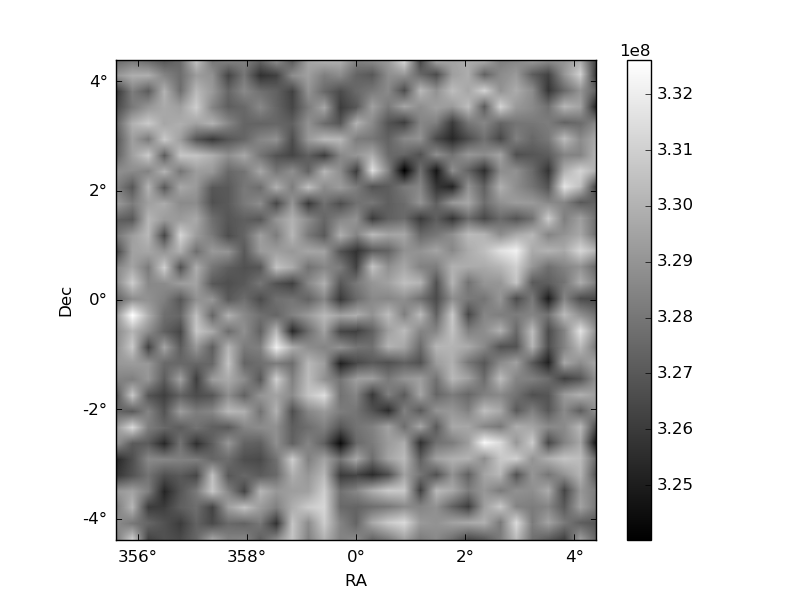
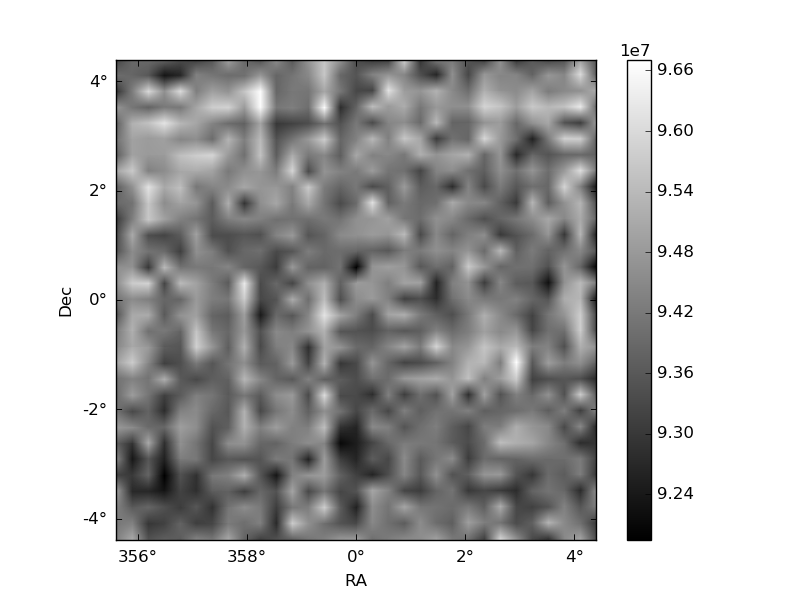
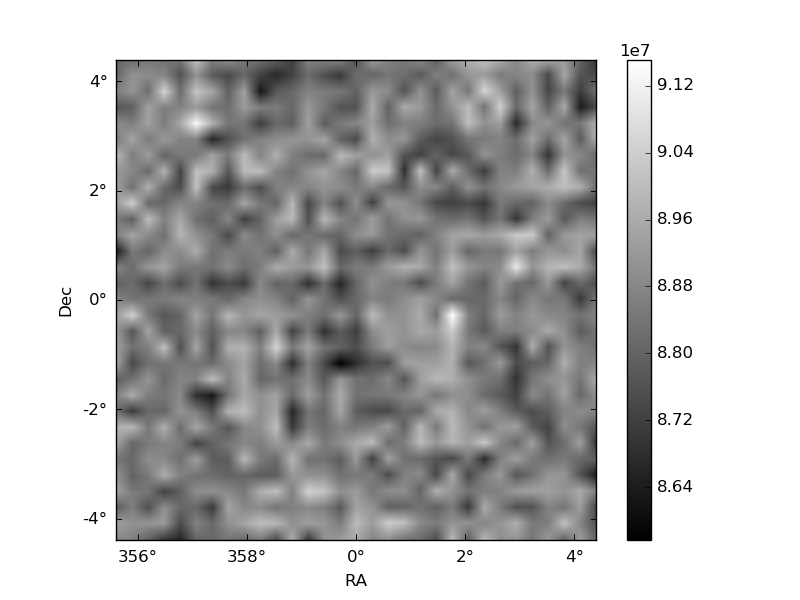
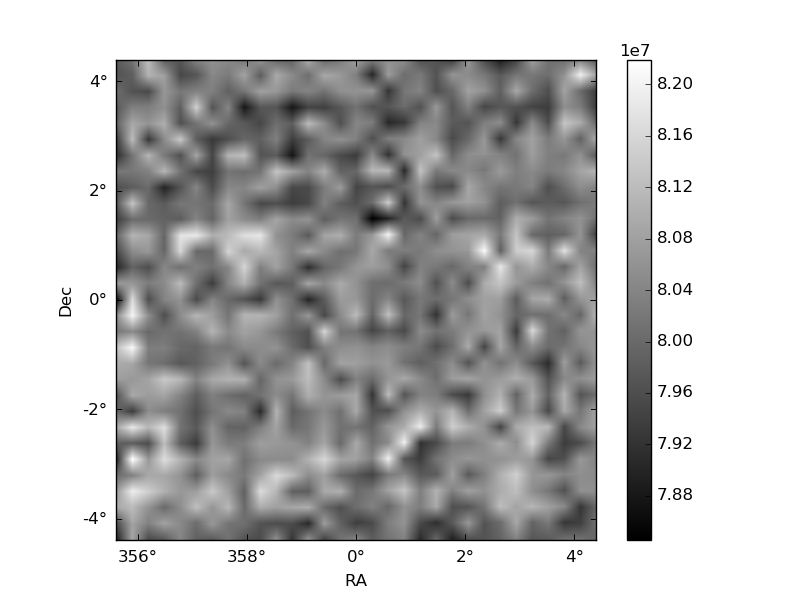
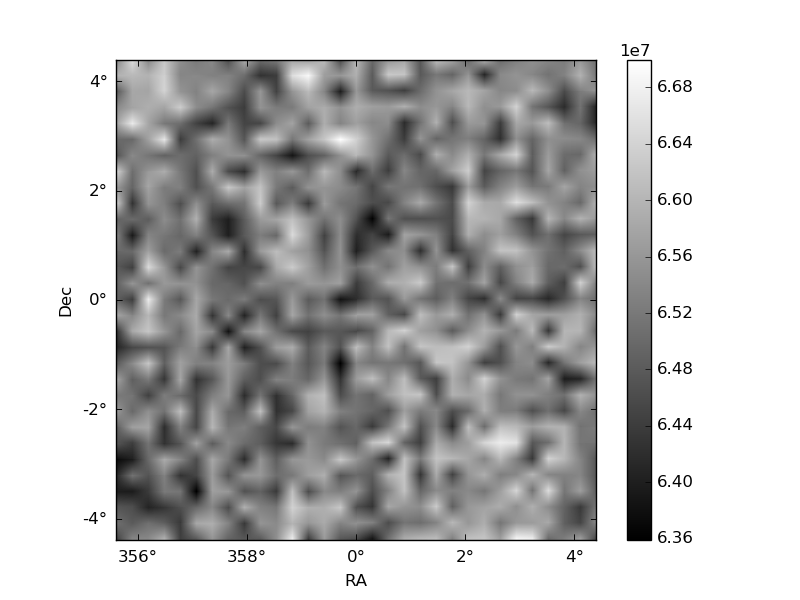
Histogram calculated using DETX and DETY for each event in the final _common_clean file
| Quadrant A | 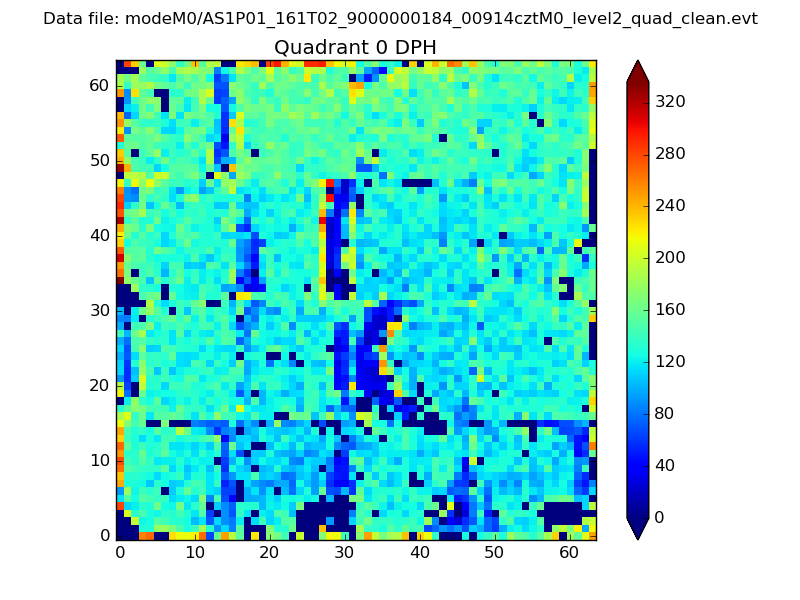 |
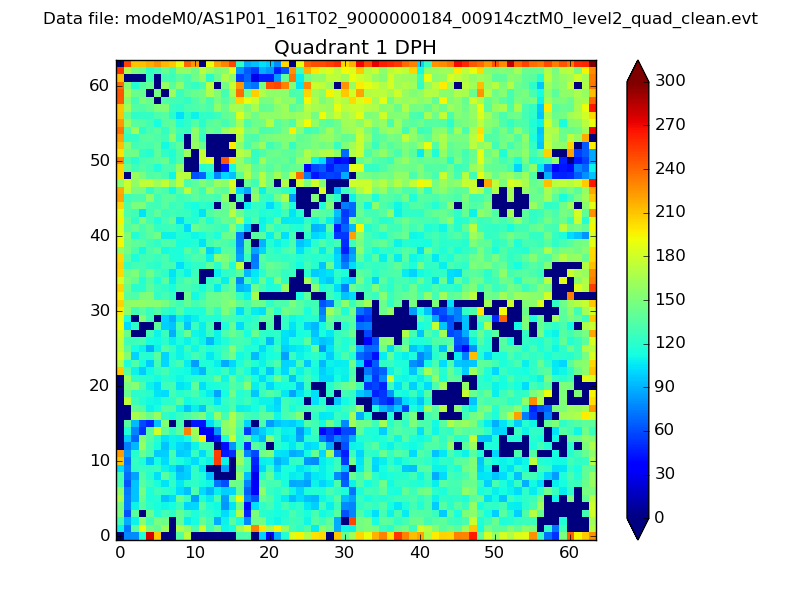 |
Quadrant B |
|---|---|---|---|
| Quadrant D | 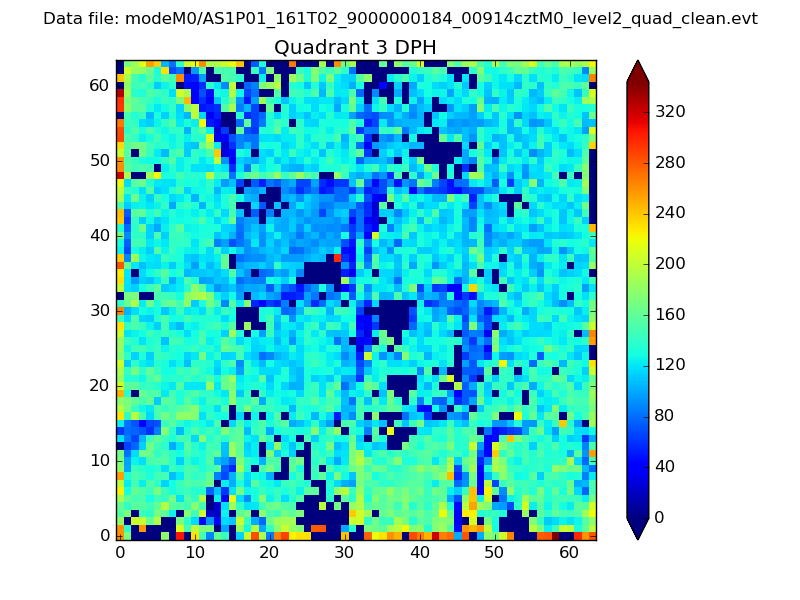 |
 |
Quadrant C |
| Plot type | Count rate plots | Images |
|---|---|---|
| Comparison with Poisson distribution Blue bars denote a histogram of data divided into 1 sec bins. Red curve is a Poisson curve with rate = median count rate of data. |
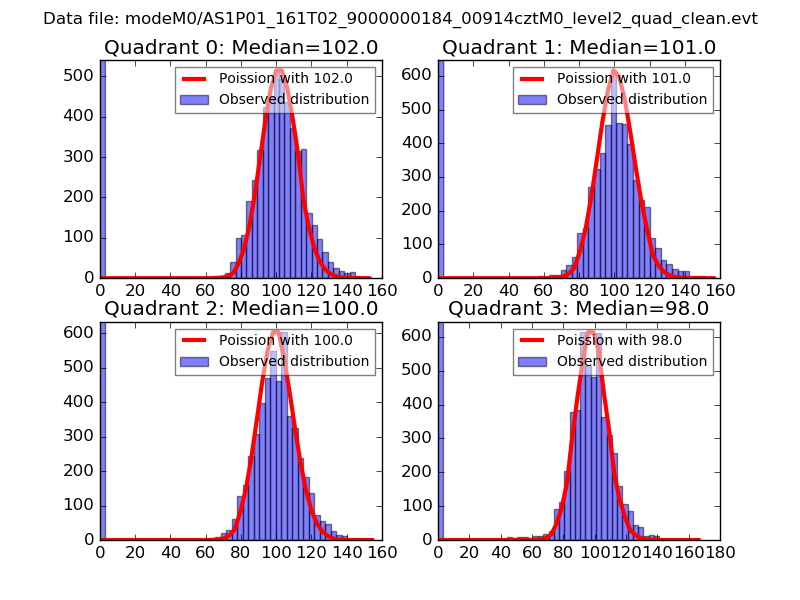 |
 |
| Quadrant-wise count rates Data is divided into 100 sec bins |
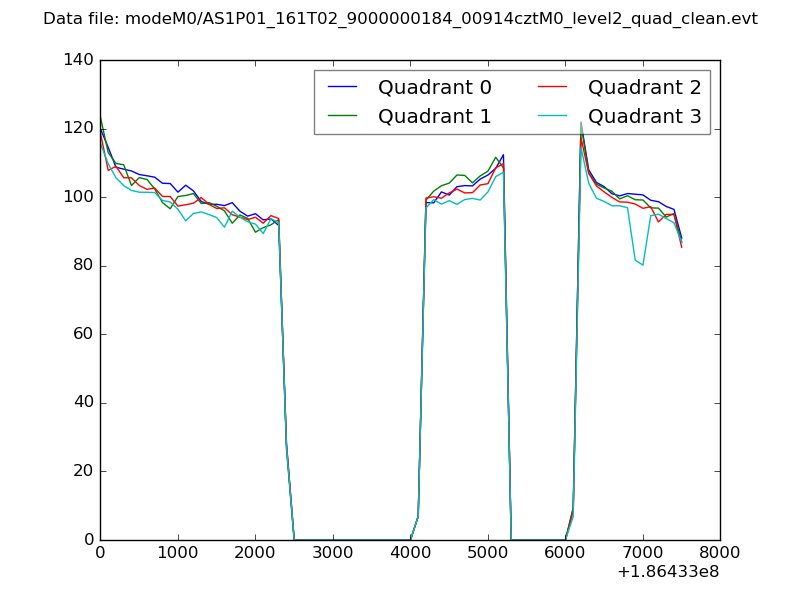 |
|
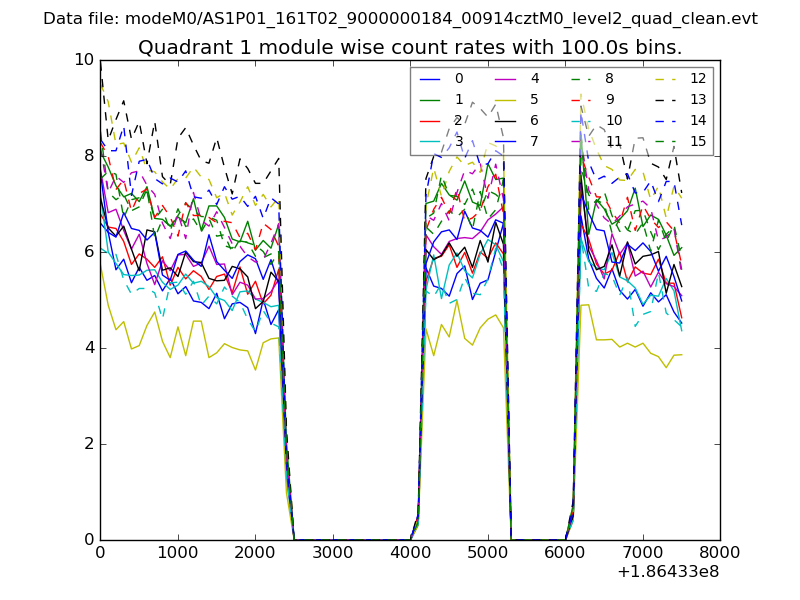
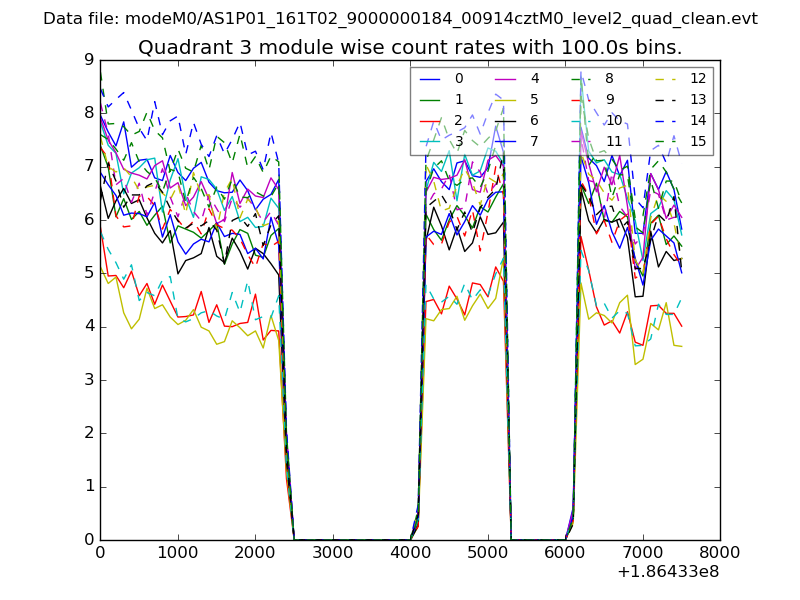
| Module-wise count rates for Quadrant A Data is divided into 100 sec bins |
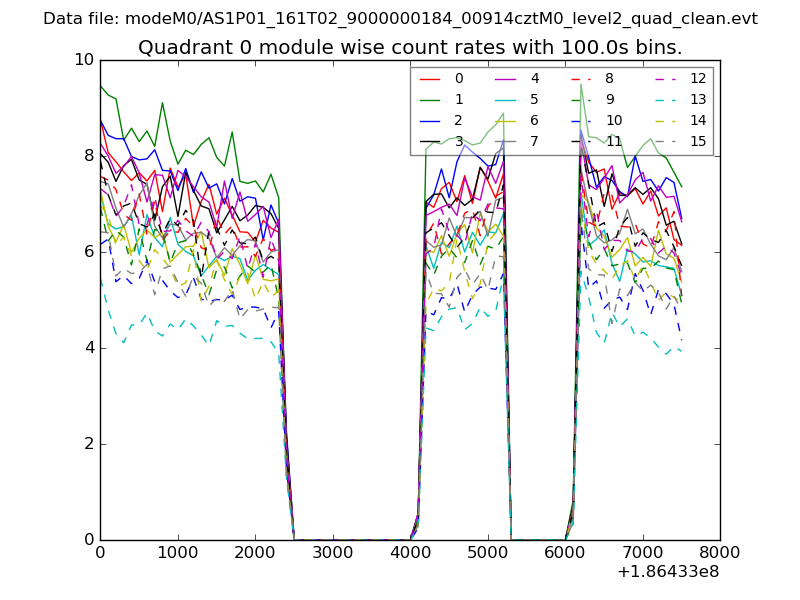 |
 |
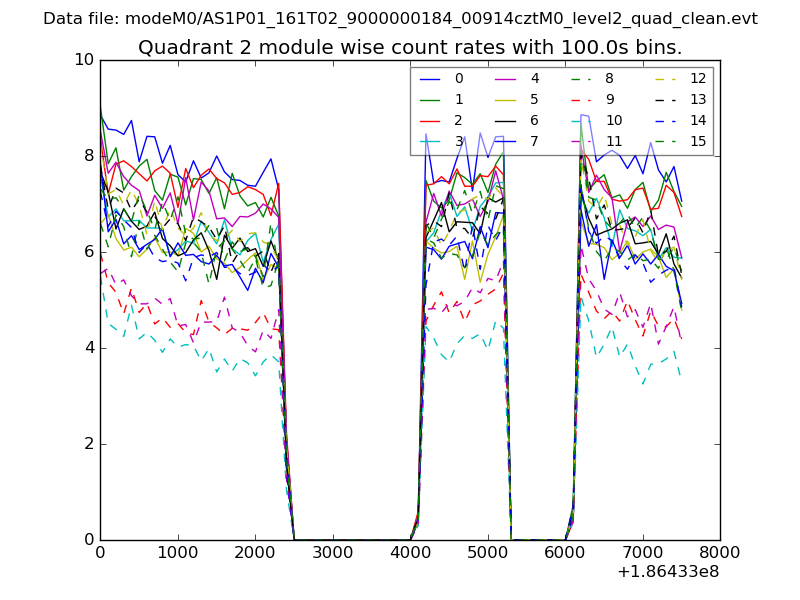
| Module-wise count rates for Quadrant B Data is divided into 100 sec bins |
 |
 |
| Module-wise count rates for Quadrant C Data is divided into 100 sec bins |
 |
 |
| Module-wise count rates for Quadrant D Data is divided into 100 sec bins |
 |
 |
| Parameter | Plot |
|---|---|
| CZT HV Monitor | 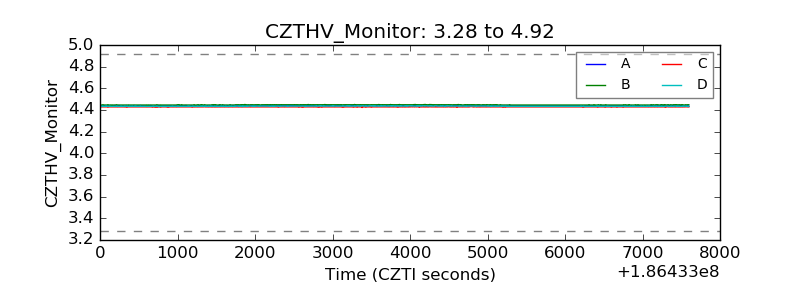 |
| D_VDD | 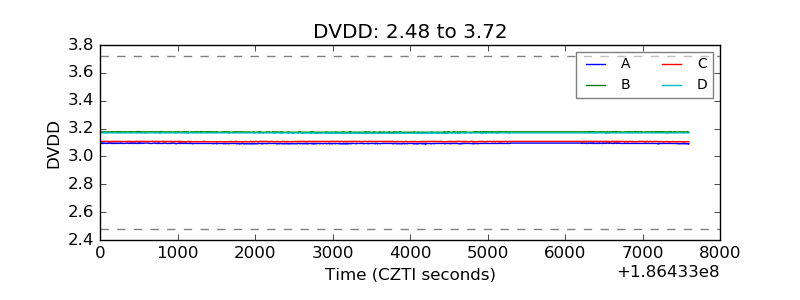 |
| Temperature 1 | 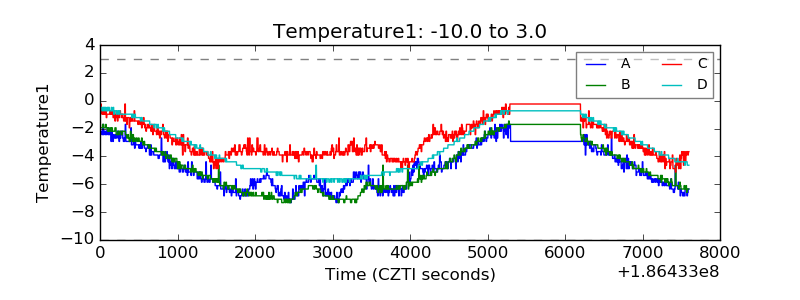 |
| Veto HV Monitor | 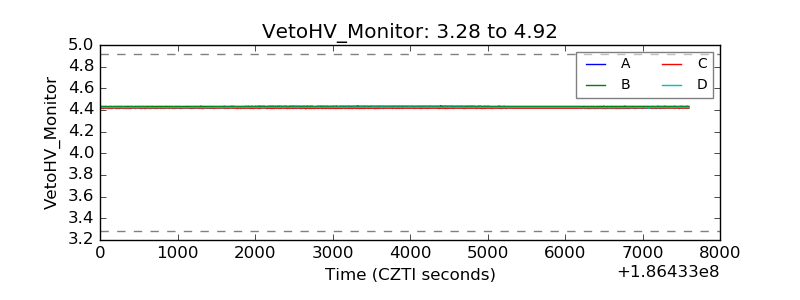 |
| Veto LLD | 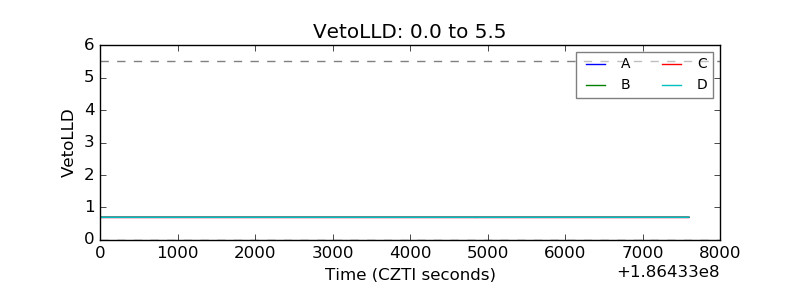 |
| Alpha Counter | 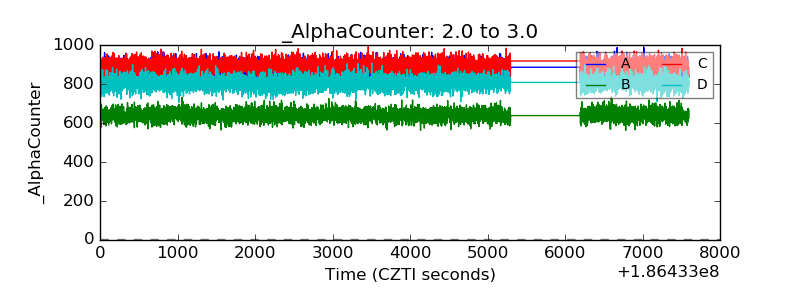 |
| _CPM_Rate | 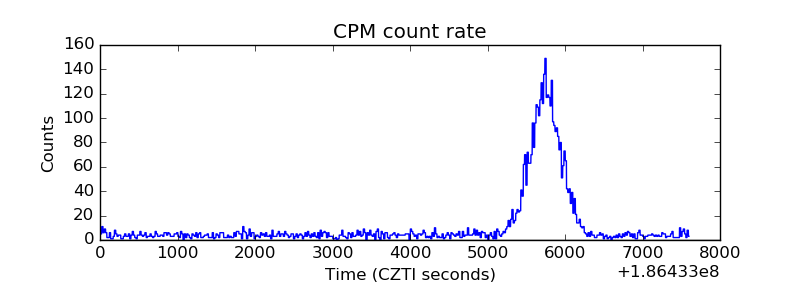 |
| CZT Counter | 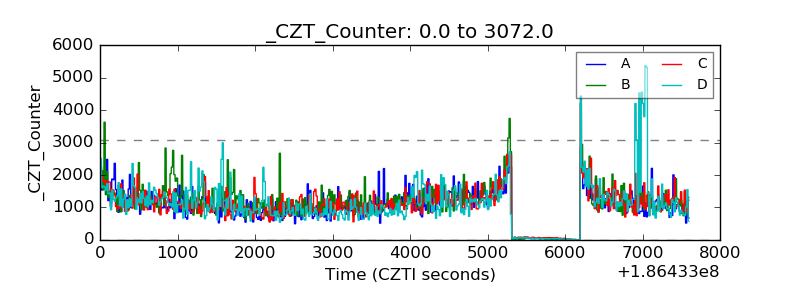 |
| +2.5 Volts monitor |  |
| +5 Volts monitor | 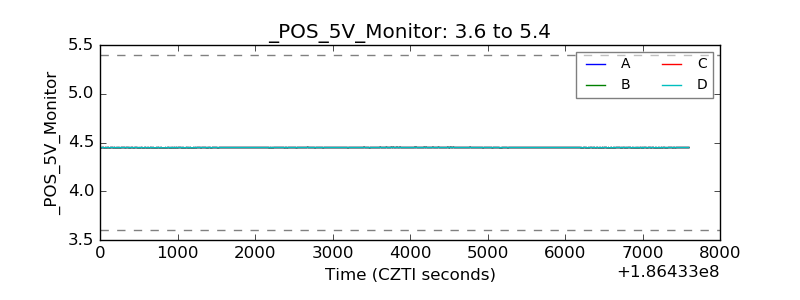 |
| _ROLL_ROT | 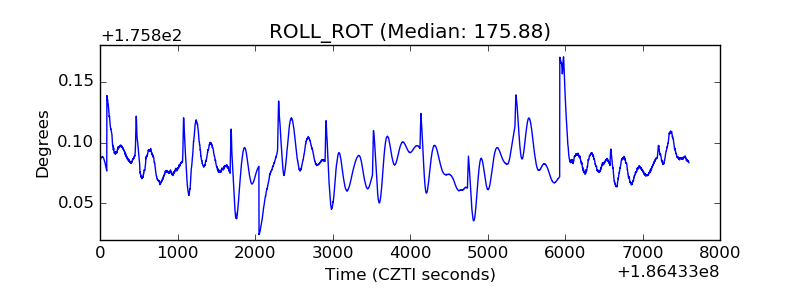 |
| _Roll_DEC | 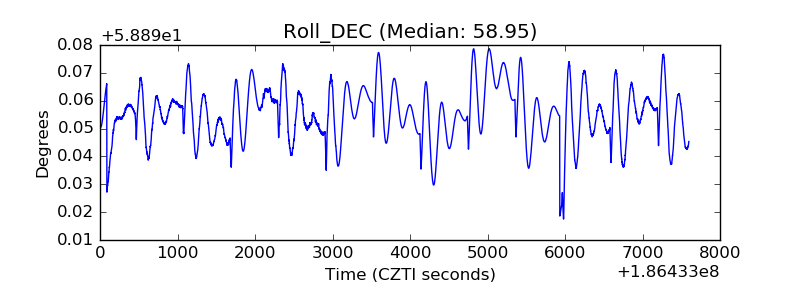 |
| _Roll_RA | 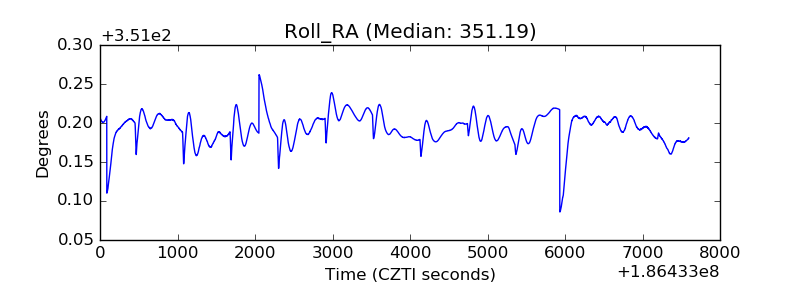 |
| Veto Counter | 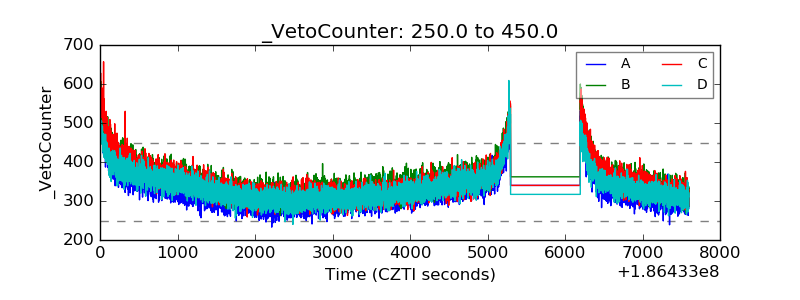 |