| Param | Original file | Final file |
|---|---|---|
| Filename | modeM0/AS1P01_161T02_9000000184_00915cztM0_level2.evt | modeM0/AS1P01_161T02_9000000184_00915cztM0_level2_quad_clean.evt |
| Size (bytes) | 448,980,480 | 37,503,360 |
| Size | 428.2 MB | 35.8 MB |
| Events in quadrant A | 3,072,718 | 247,542 |
| Events in quadrant B | 3,564,638 | 241,259 |
| Events in quadrant C | 3,237,648 | 240,866 |
| Events in quadrant D | 3,560,893 | 231,945 |
| Mode SS | |||
|---|---|---|---|
| Quadrant | BADHDUFLAG | Total packets | Discarded packets |
| A | 0 | 52 | 0 |
| B | 0 | 52 | 0 |
| C | 0 | 50 | 0 |
| D | 0 | 52 | 0 |
| Mode M0 | |||
|---|---|---|---|
| Quadrant | BADHDUFLAG | Total packets | Discarded packets |
| A | 0 | 10828 | 0 |
| B | 0 | 12301 | 0 |
| C | 0 | 11328 | 0 |
| D | 0 | 12287 | 0 |
| Mode M9 | |||
|---|---|---|---|
| Quadrant | BADHDUFLAG | Total packets | Discarded packets |
| A | 0 | 5 | 0 |
| B | 0 | 5 | 0 |
| C | 0 | 5 | 0 |
| D | 0 | 5 | 0 |
| Quadrant | Total seconds | Saturated seconds | Saturation percentage |
|---|---|---|---|
| A | 2414 | 4 | 0.165700% |
| B | 2404 | 79 | 3.286190% |
| C | 2416 | 10 | 0.413907% |
| D | 2410 | 60 | 2.489627% |
Noise dominated data is calculated using 1-second bins in cleaned event files. If a bin has >2000 counts, and if more than 50% of those come from <1% of pixels, then it is considered to be noise-dominated and hence unusable.
| Quadrant | # 1 sec bins | Bins with >0 counts | Bins with >2000 counts | High rate bins dominated by noise | Noise dominated (total time) | Noise dominated (detector-on time) | Marked lightcurve |
|---|---|---|---|---|---|---|---|
| A | 3139 | 2435 | 150 | 150 | 4.78% | 6.16% | 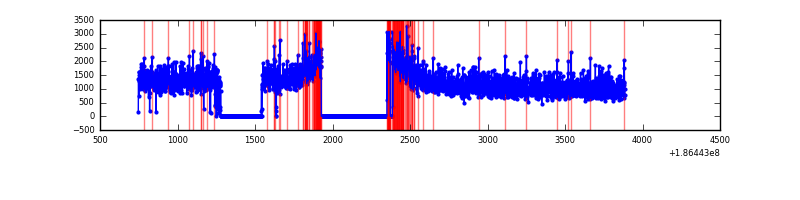 |
| B | 3138 | 2425 | 364 | 364 | 11.60% | 15.01% | 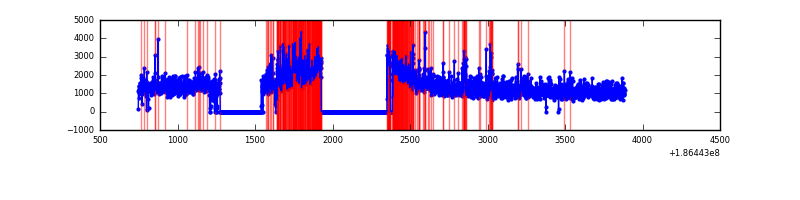 |
| C | 3138 | 2430 | 173 | 173 | 5.51% | 7.12% | 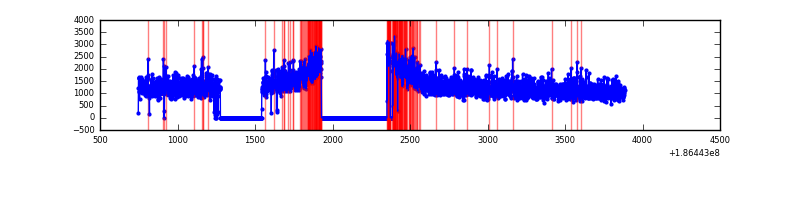 |
| D | 3137 | 2424 | 372 | 372 | 11.86% | 15.35% | 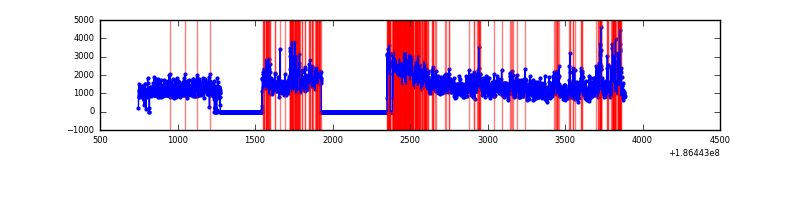 |
Top three noisy pixels from each quadrant. If the there are fewer than three noisy pixels in the level2.evt file, extra rows are filled as -1
| Pixel properties | Quadrant properties | ||||||
|---|---|---|---|---|---|---|---|
| Quadrant | DetID | PixID | Counts | Sigma | Mean | Median | Sigma |
| A | 15 | 127 | 20377 | 101.42 | 795 | 799 | 193.0 |
| A | 11 | 79 | 2838 | 10.56 | 795 | 799 | 193.0 |
| A | 3 | 111 | 2403 | 8.31 | 795 | 799 | 193.0 |
| B | 3 | 0 | 279326 | 1427.7 | 820 | 819 | 195.1 |
| B | 7 | 221 | 45922 | 231.21 | 820 | 819 | 195.1 |
| B | 15 | 22 | 30977 | 154.6 | 820 | 819 | 195.1 |
| C | 15 | 241 | 139526 | 629.75 | 780 | 808 | 220.3 |
| C | 7 | 159 | 12812 | 54.5 | 780 | 808 | 220.3 |
| C | 3 | 111 | 10226 | 42.76 | 780 | 808 | 220.3 |
| D | 12 | 188 | 348758 | 1507.27 | 749 | 775 | 230.9 |
| D | 1 | 4 | 281535 | 1216.1 | 749 | 775 | 230.9 |
| D | 13 | 88 | 72317 | 309.88 | 749 | 775 | 230.9 |
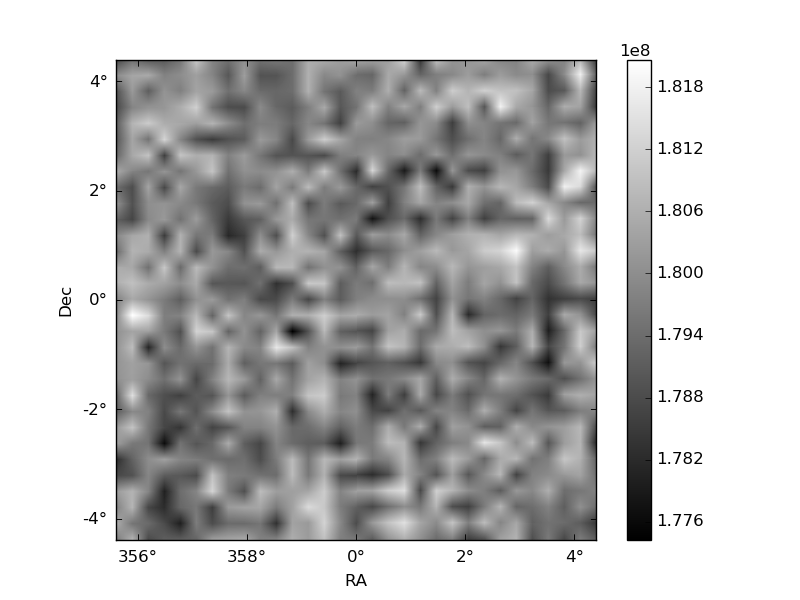
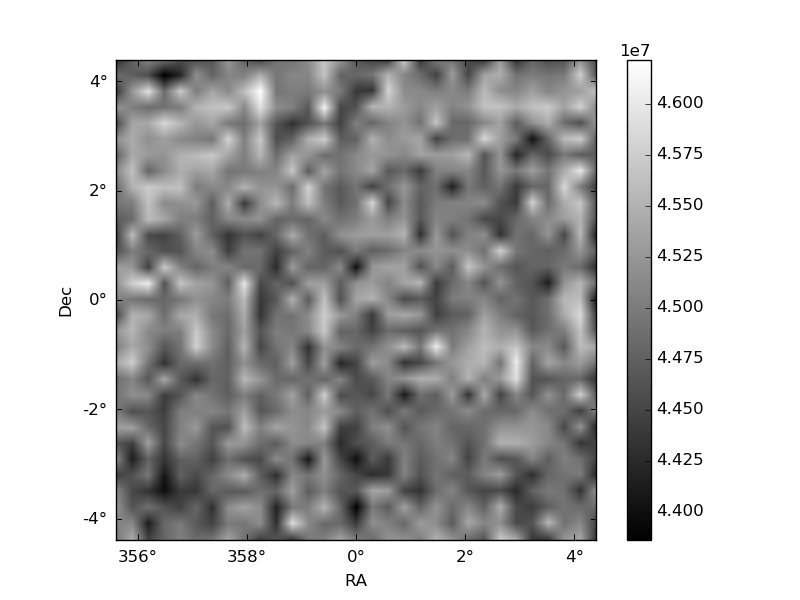
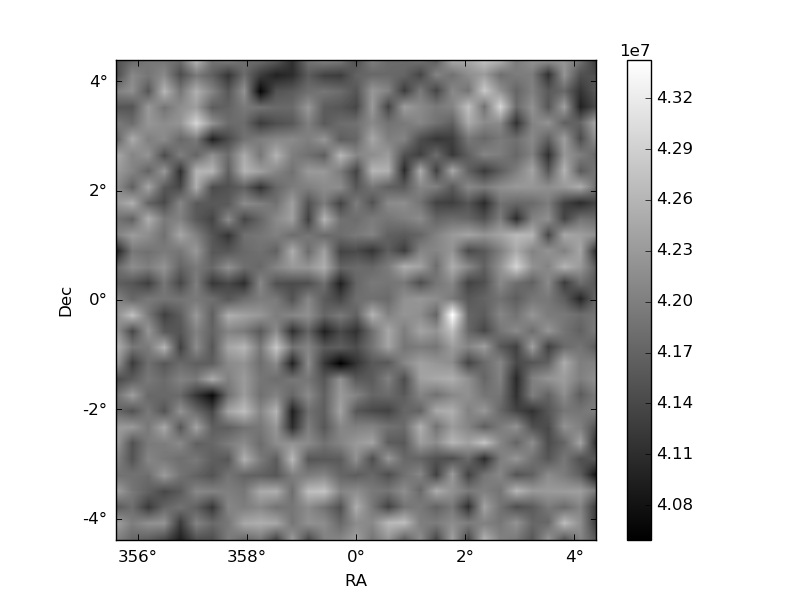
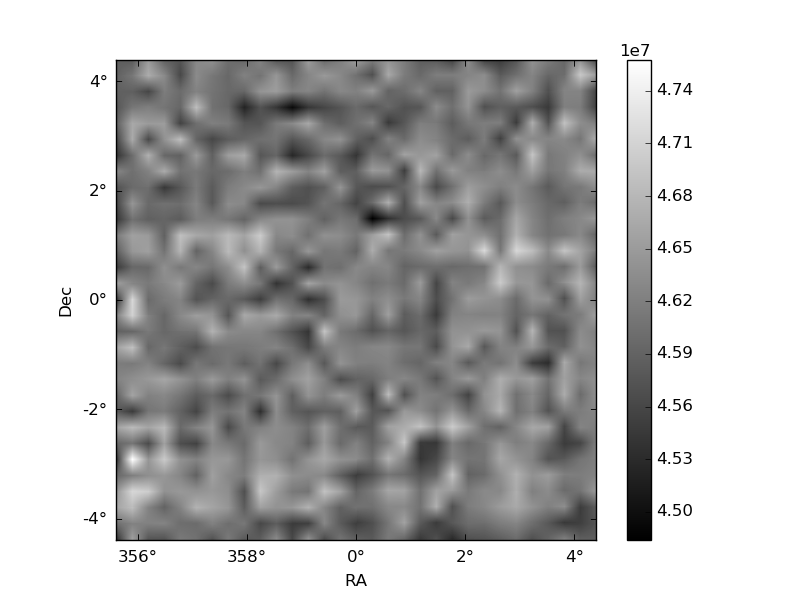
Histogram calculated using DETX and DETY for each event in the final _common_clean file
| Quadrant A | 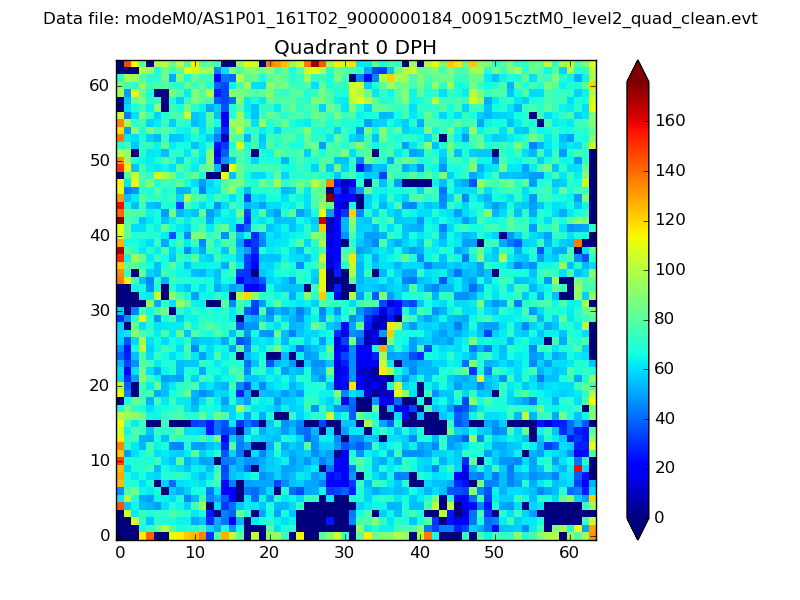 |
 |
Quadrant B |
|---|---|---|---|
| Quadrant D | 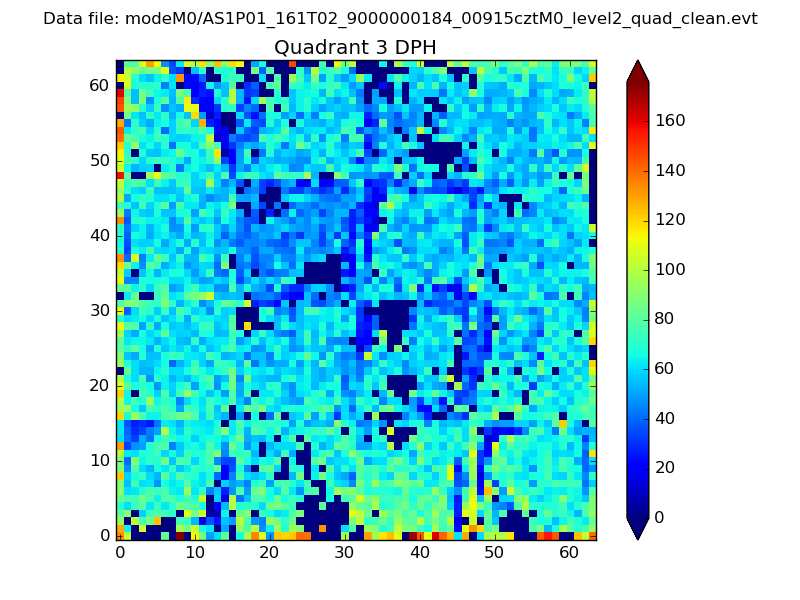 |
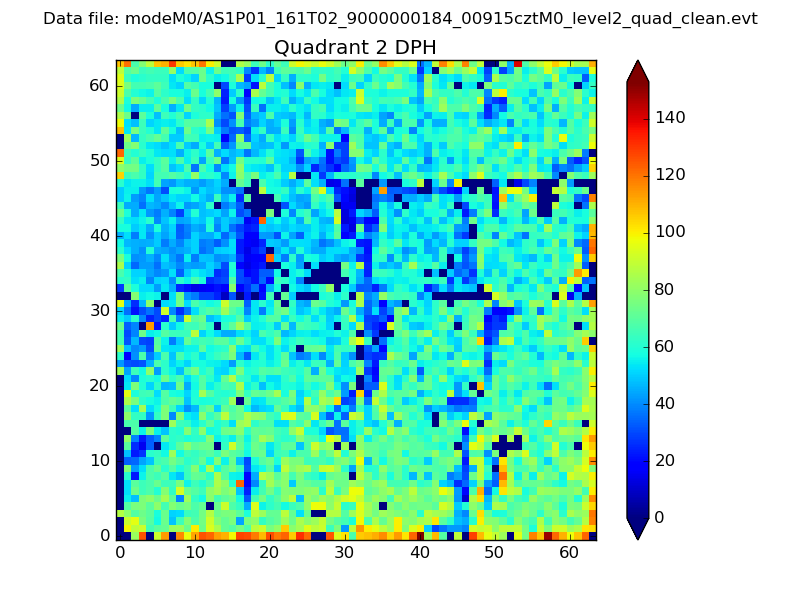 |
Quadrant C |
| Plot type | Count rate plots | Images |
|---|---|---|
| Comparison with Poisson distribution Blue bars denote a histogram of data divided into 1 sec bins. Red curve is a Poisson curve with rate = median count rate of data. |
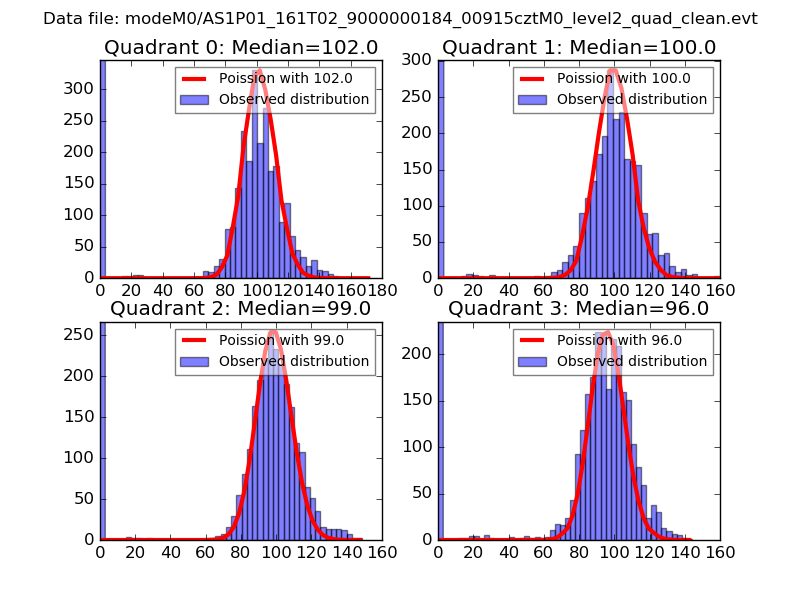 |
 |
| Quadrant-wise count rates Data is divided into 100 sec bins |
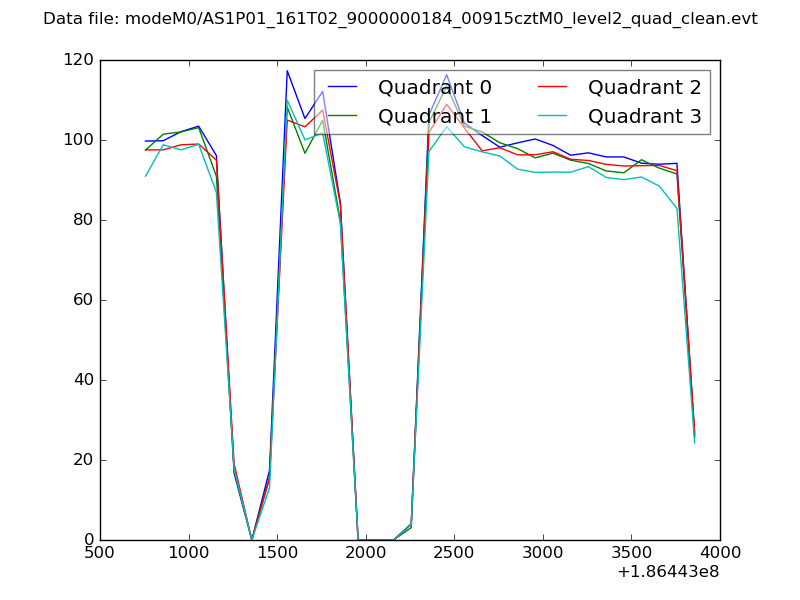 |
|
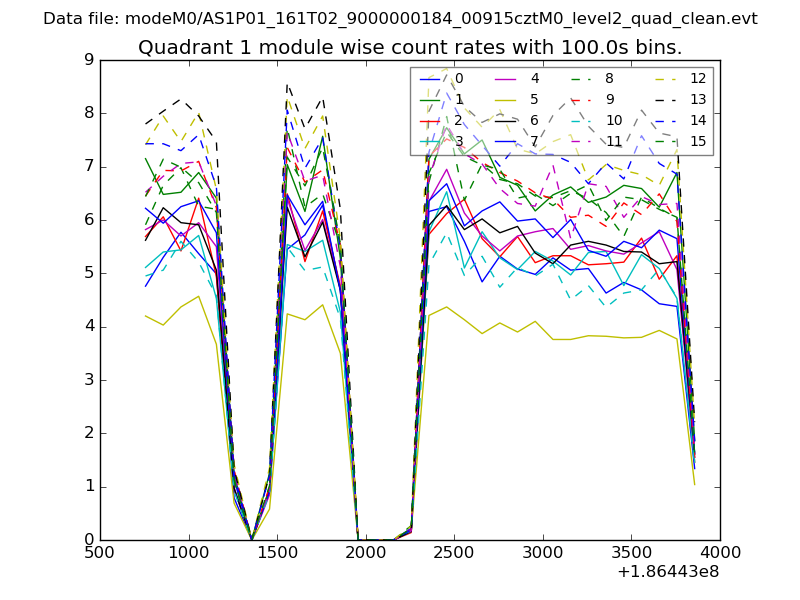
| Module-wise count rates for Quadrant A Data is divided into 100 sec bins |
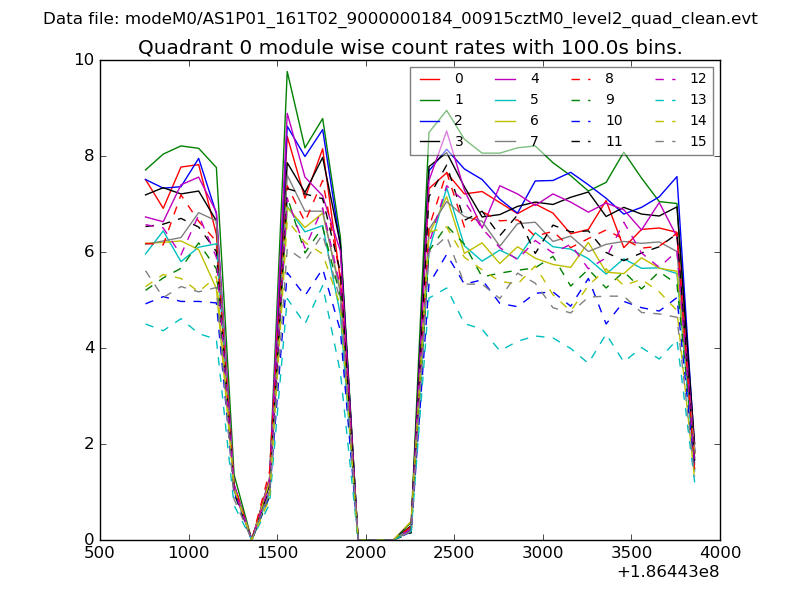 |
 |
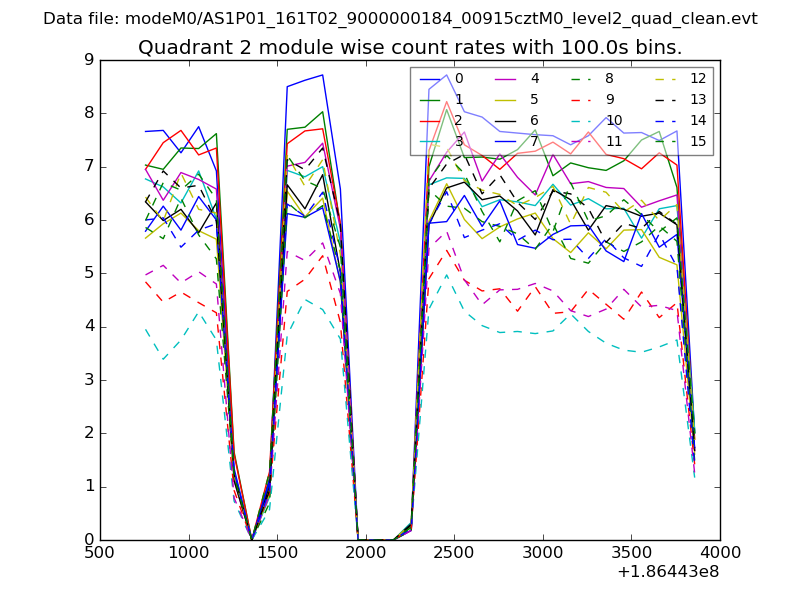
| Module-wise count rates for Quadrant B Data is divided into 100 sec bins |
 |
 |
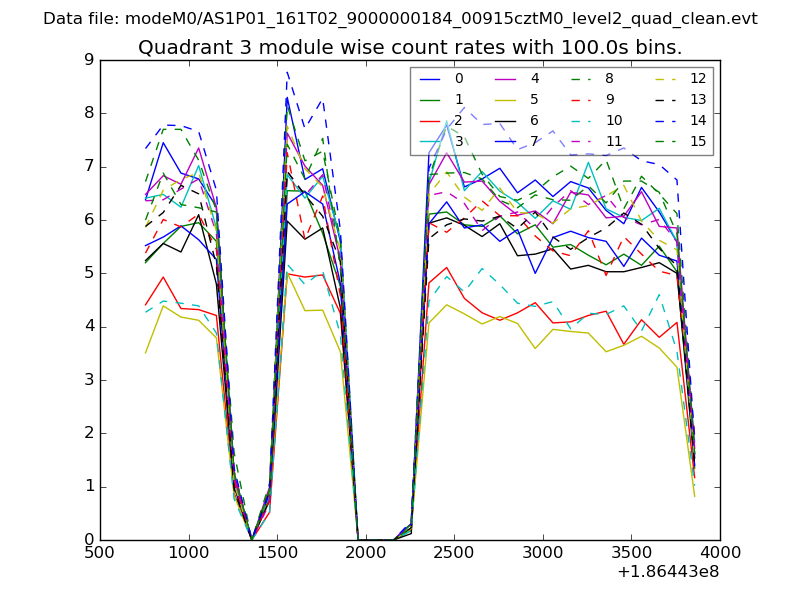
| Module-wise count rates for Quadrant C Data is divided into 100 sec bins |
 |
 |
| Module-wise count rates for Quadrant D Data is divided into 100 sec bins |
 |
 |
| Parameter | Plot |
|---|---|
| CZT HV Monitor | 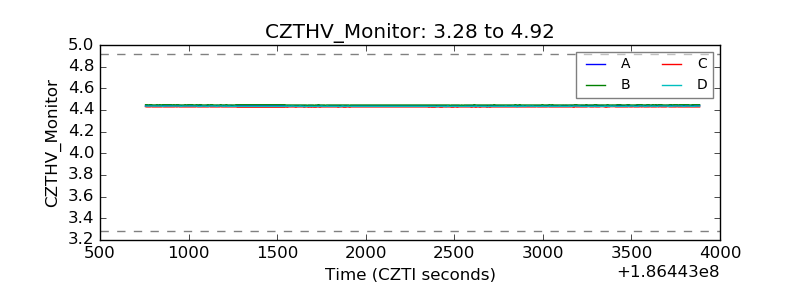 |
| D_VDD | 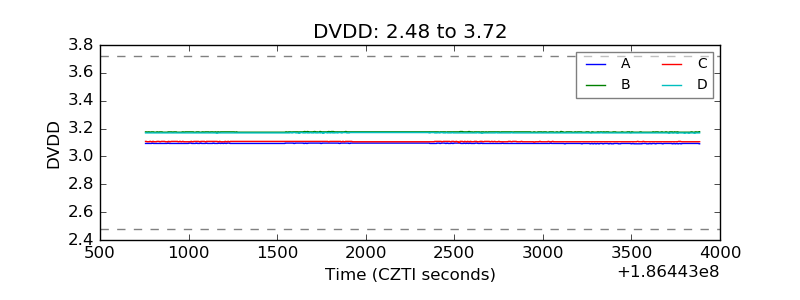 |
| Temperature 1 | 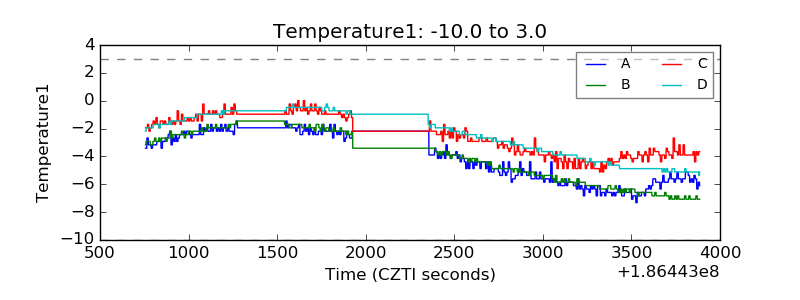 |
| Veto HV Monitor | 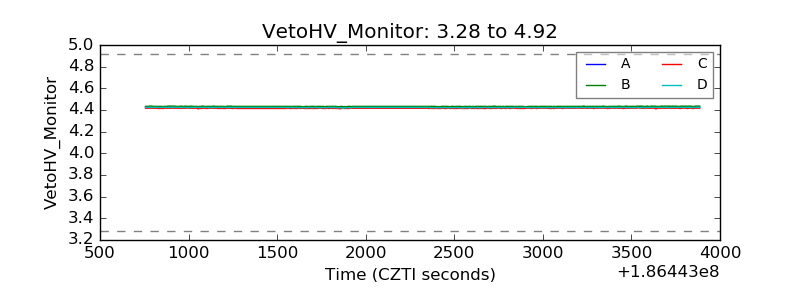 |
| Veto LLD | 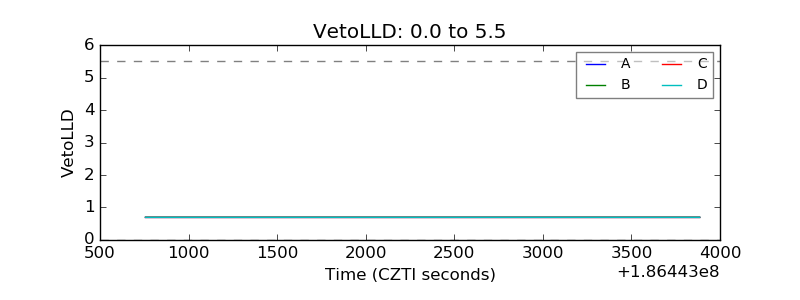 |
| Alpha Counter | 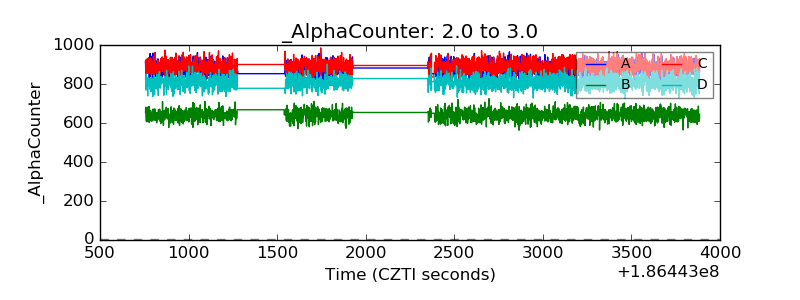 |
| _CPM_Rate | 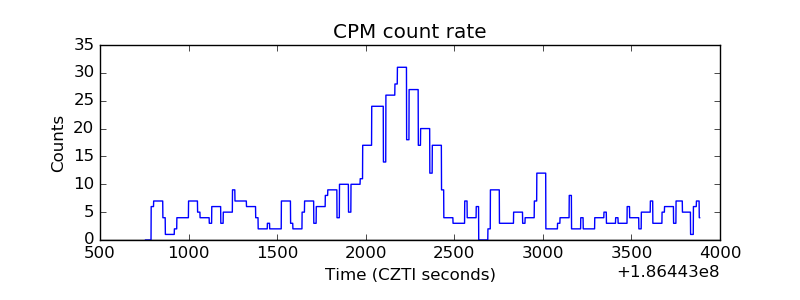 |
| CZT Counter | 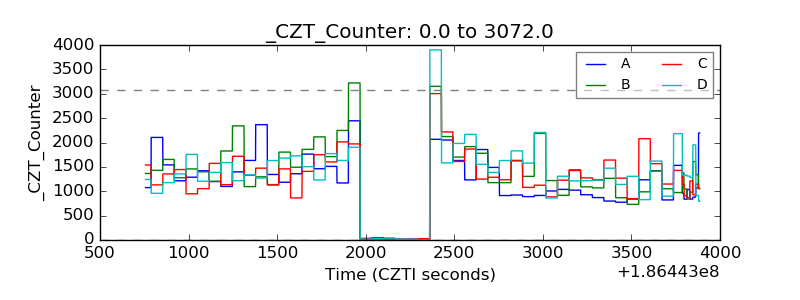 |
| +2.5 Volts monitor |  |
| +5 Volts monitor |  |
| _ROLL_ROT | 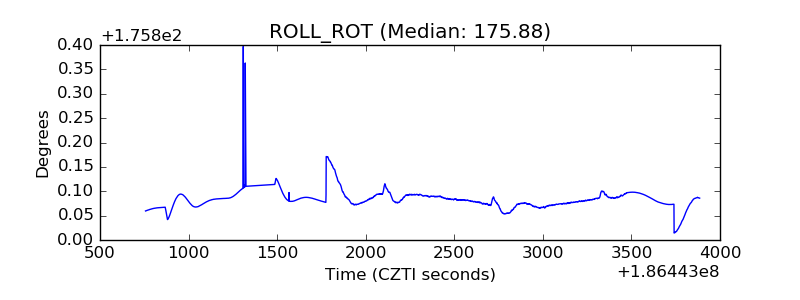 |
| _Roll_DEC | 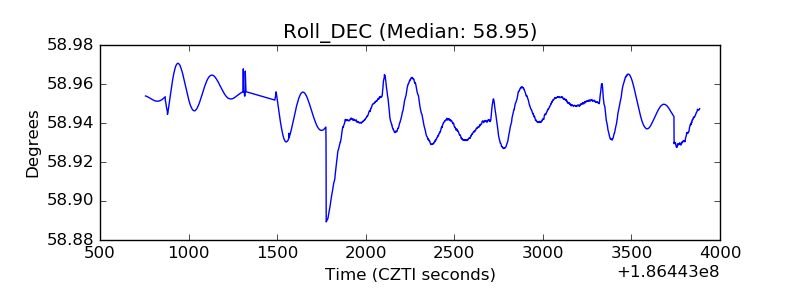 |
| _Roll_RA | 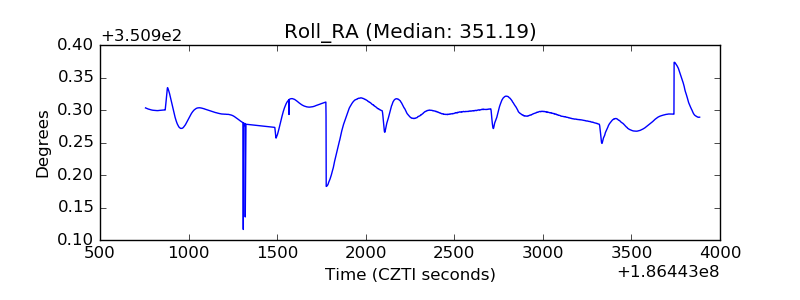 |
| Veto Counter | 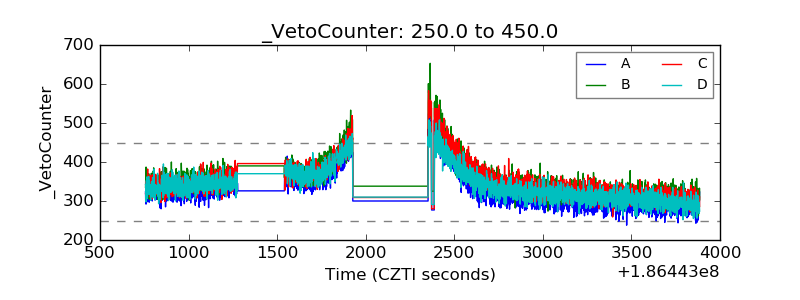 |