| Param | Original file | Final file |
|---|---|---|
| Filename | modeM0/AS1P01_161T02_9000000184_00916cztM0_level2.evt | modeM0/AS1P01_161T02_9000000184_00916cztM0_level2_quad_clean.evt |
| Size (bytes) | 1,237,766,400 | 90,961,920 |
| Size | 1.2 GB | 86.7 MB |
| Events in quadrant A | 8,950,520 | 569,115 |
| Events in quadrant B | 9,806,229 | 562,708 |
| Events in quadrant C | 9,202,749 | 552,761 |
| Events in quadrant D | 9,022,662 | 540,676 |
| Mode SS | |||
|---|---|---|---|
| Quadrant | BADHDUFLAG | Total packets | Discarded packets |
| A | 0 | 152 | 0 |
| B | 0 | 152 | 0 |
| C | 0 | 152 | 0 |
| D | 0 | 152 | 0 |
| Mode M0 | |||
|---|---|---|---|
| Quadrant | BADHDUFLAG | Total packets | Discarded packets |
| A | 0 | 32033 | 0 |
| B | 0 | 34524 | 0 |
| C | 0 | 32708 | 0 |
| D | 0 | 32215 | 0 |
| Quadrant | Total seconds | Saturated seconds | Saturation percentage |
|---|---|---|---|
| A | 7608 | 4 | 0.052576% |
| B | 7608 | 56 | 0.736067% |
| C | 7609 | 4 | 0.052569% |
| D | 7609 | 55 | 0.722828% |
Noise dominated data is calculated using 1-second bins in cleaned event files. If a bin has >2000 counts, and if more than 50% of those come from <1% of pixels, then it is considered to be noise-dominated and hence unusable.
| Quadrant | # 1 sec bins | Bins with >0 counts | Bins with >2000 counts | High rate bins dominated by noise | Noise dominated (total time) | Noise dominated (detector-on time) | Marked lightcurve |
|---|---|---|---|---|---|---|---|
| A | 7608 | 7608 | 246 | 246 | 3.23% | 3.23% | 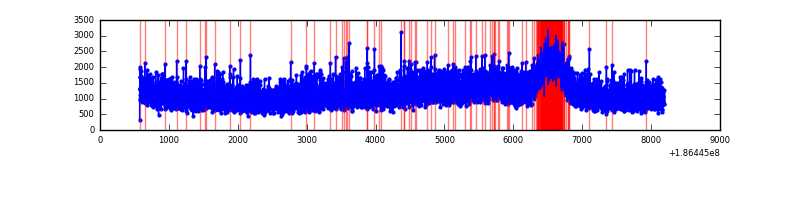 |
| B | 7608 | 7608 | 491 | 491 | 6.45% | 6.45% | 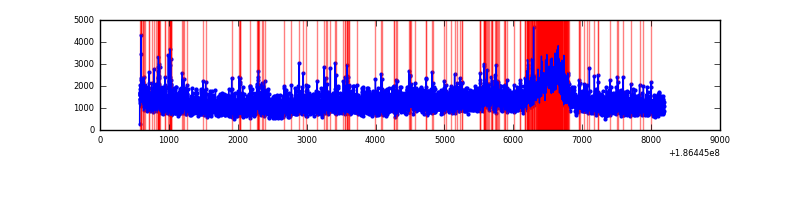 |
| C | 7609 | 7609 | 279 | 279 | 3.67% | 3.67% | 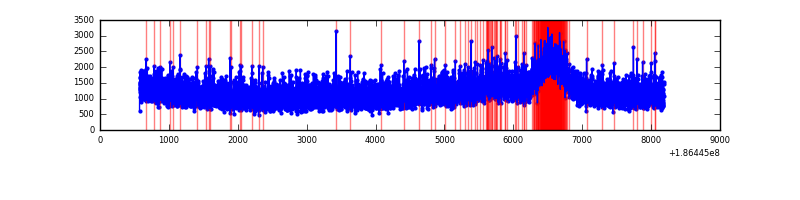 |
| D | 7609 | 7609 | 363 | 363 | 4.77% | 4.77% | 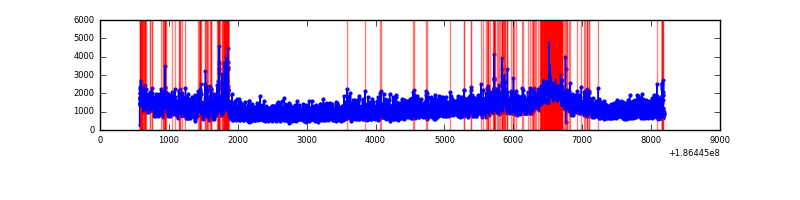 |
Top three noisy pixels from each quadrant. If the there are fewer than three noisy pixels in the level2.evt file, extra rows are filled as -1
| Pixel properties | Quadrant properties | ||||||
|---|---|---|---|---|---|---|---|
| Quadrant | DetID | PixID | Counts | Sigma | Mean | Median | Sigma |
| A | 15 | 127 | 39919 | 67.39 | 2322 | 2336 | 557.7 |
| A | 11 | 79 | 9090 | 12.11 | 2322 | 2336 | 557.7 |
| A | 3 | 111 | 7250 | 8.81 | 2322 | 2336 | 557.7 |
| B | 3 | 0 | 213495 | 366.93 | 2441 | 2448 | 575.2 |
| B | 7 | 221 | 101511 | 172.23 | 2441 | 2448 | 575.2 |
| B | 0 | 182 | 95407 | 161.62 | 2441 | 2448 | 575.2 |
| C | 15 | 241 | 379201 | 605.34 | 2239 | 2317 | 622.6 |
| C | 3 | 111 | 33434 | 49.98 | 2239 | 2317 | 622.6 |
| C | 3 | 79 | 26582 | 38.97 | 2239 | 2317 | 622.6 |
| D | 12 | 188 | 495769 | 737.59 | 2143 | 2222 | 669.1 |
| D | 1 | 4 | 445809 | 662.93 | 2143 | 2222 | 669.1 |
| D | 13 | 73 | 36216 | 50.8 | 2143 | 2222 | 669.1 |
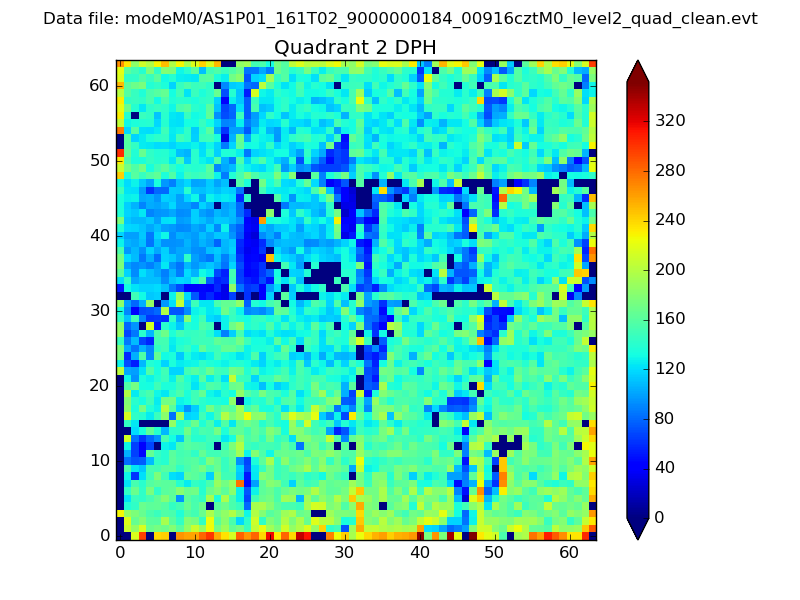
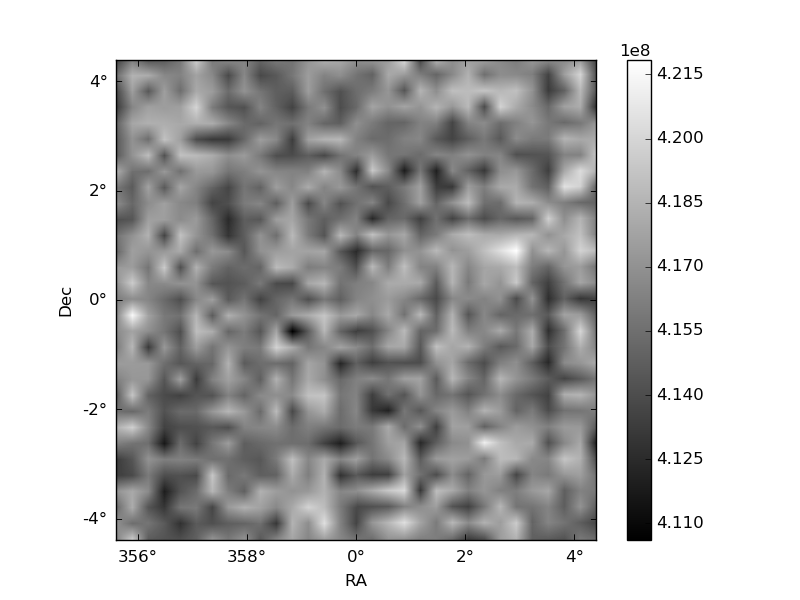
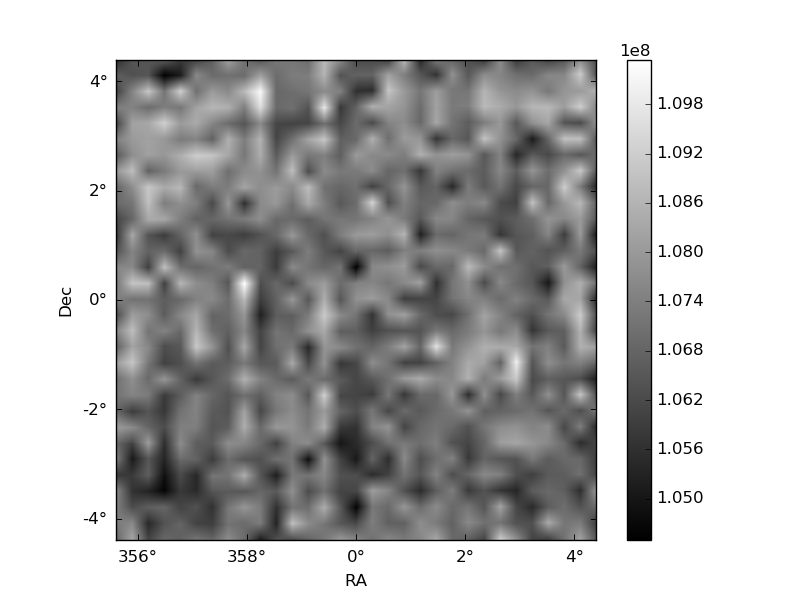
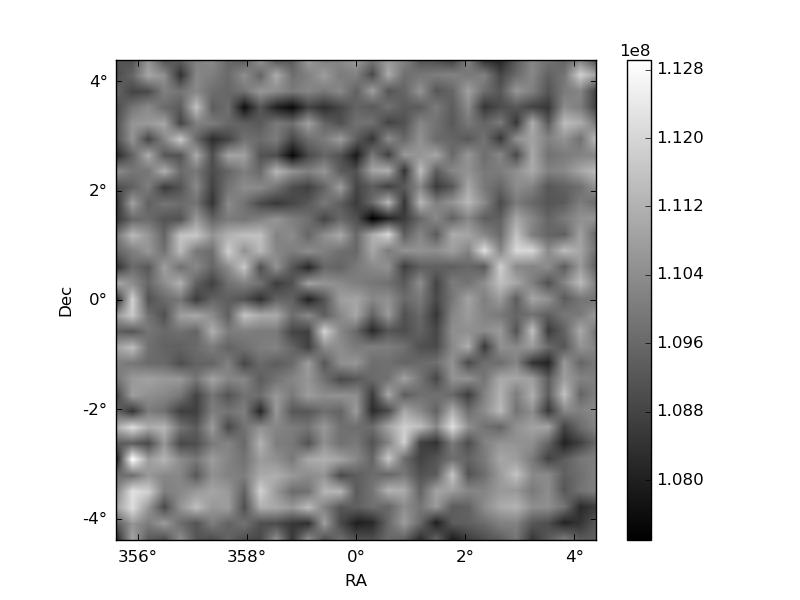
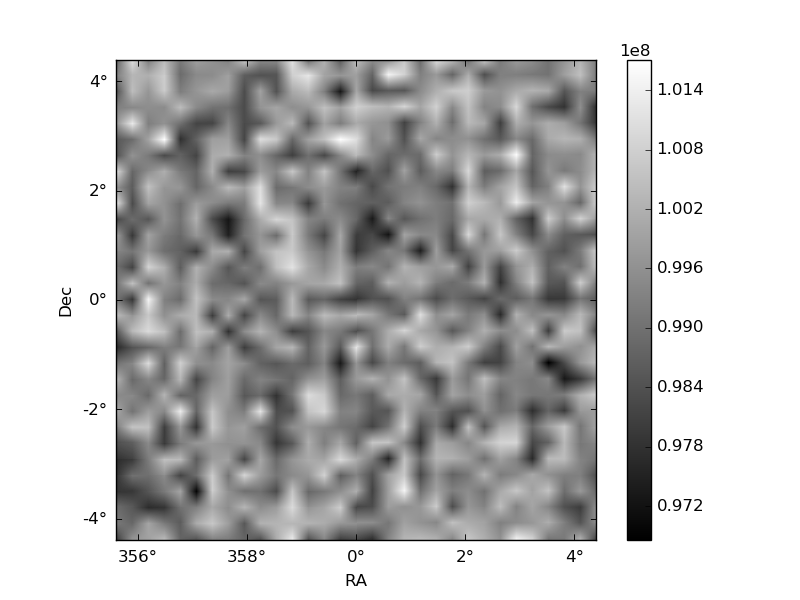
Histogram calculated using DETX and DETY for each event in the final _common_clean file
| Quadrant A | 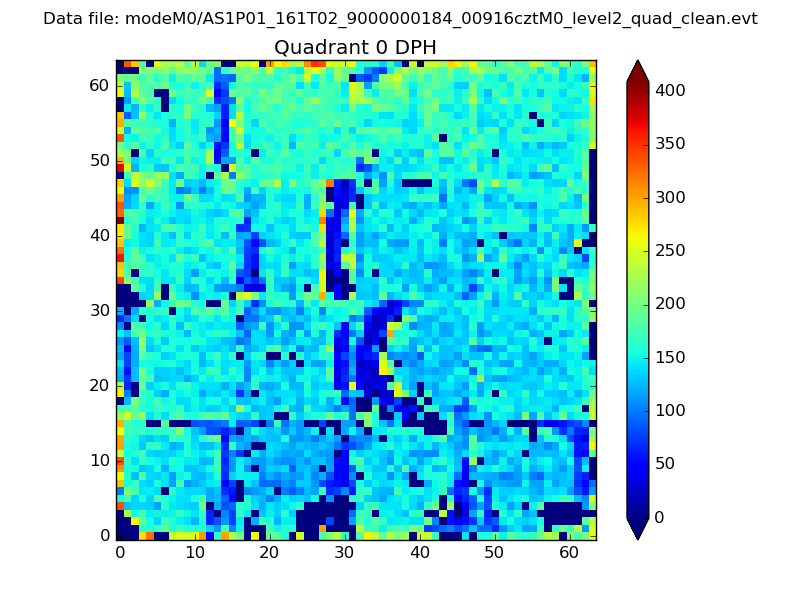 |
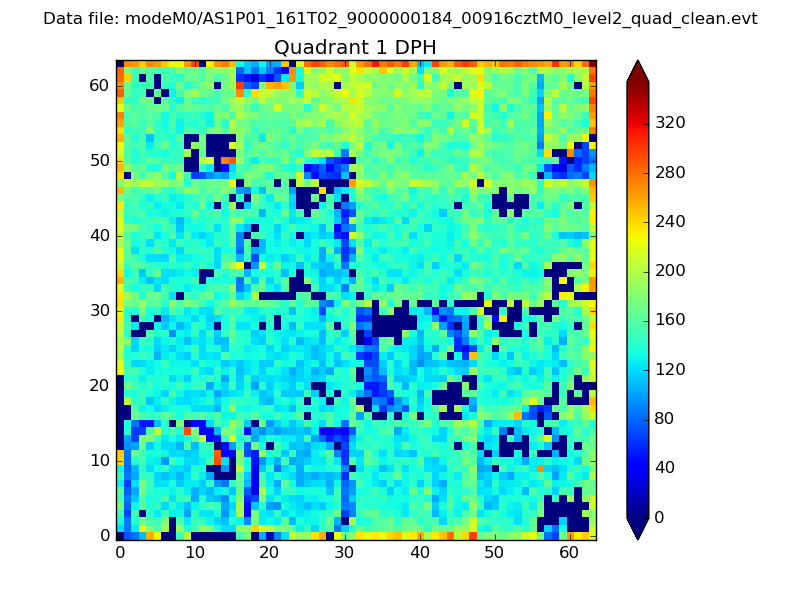 |
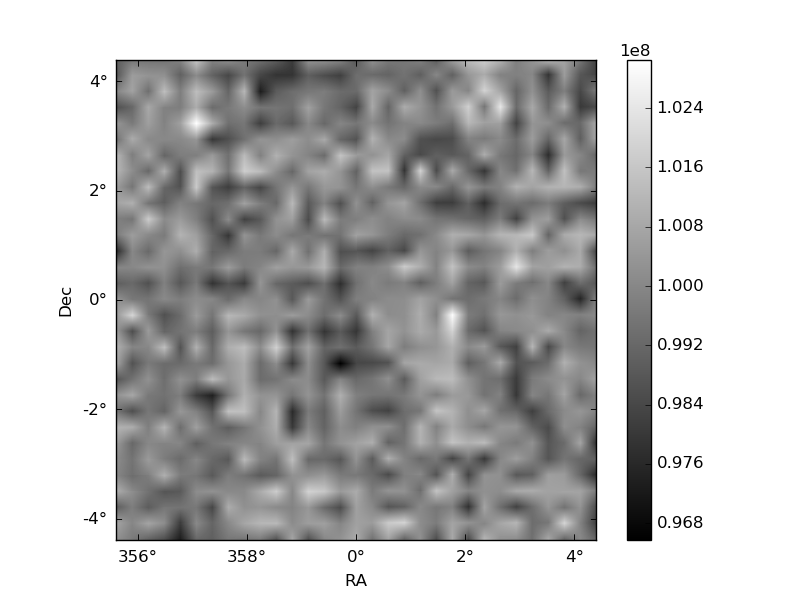
Quadrant B |
|---|---|---|---|
| Quadrant D | 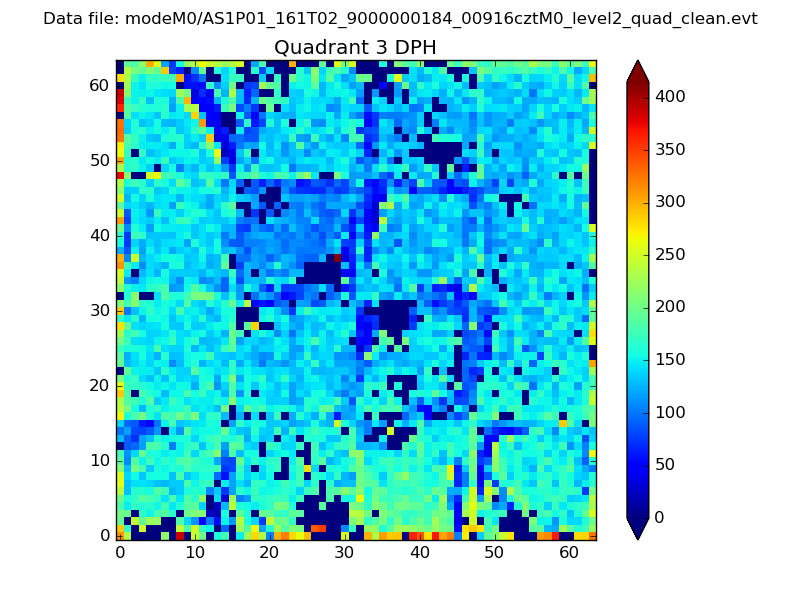 |
 |
Quadrant C |
| Plot type | Count rate plots | Images |
|---|---|---|
| Comparison with Poisson distribution Blue bars denote a histogram of data divided into 1 sec bins. Red curve is a Poisson curve with rate = median count rate of data. |
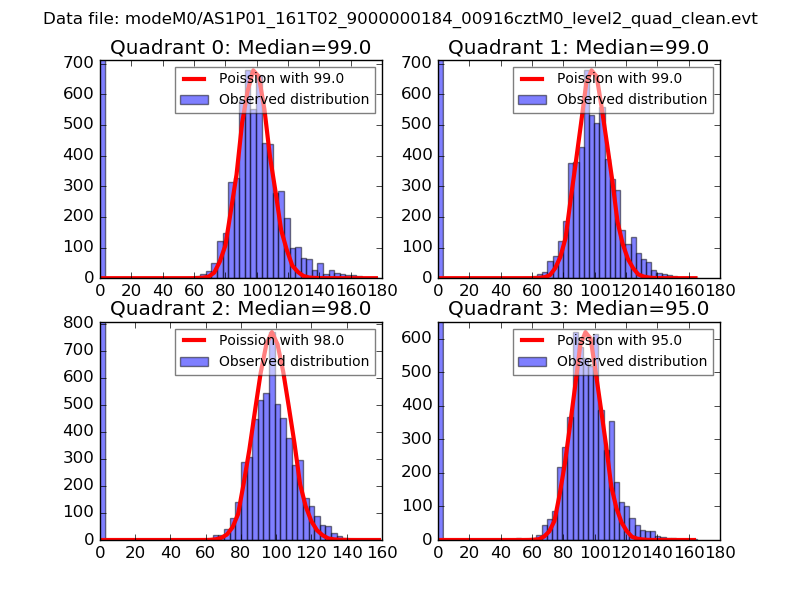 |
 |
| Quadrant-wise count rates Data is divided into 100 sec bins |
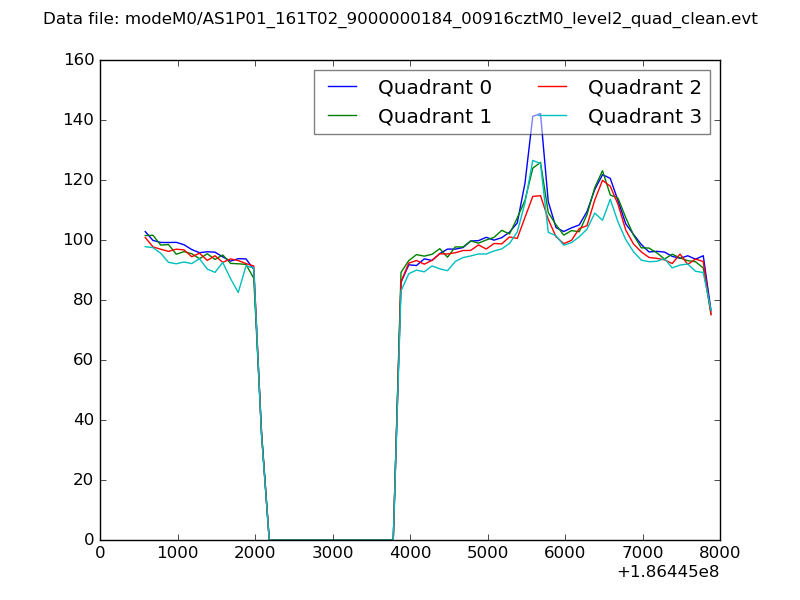 |
|
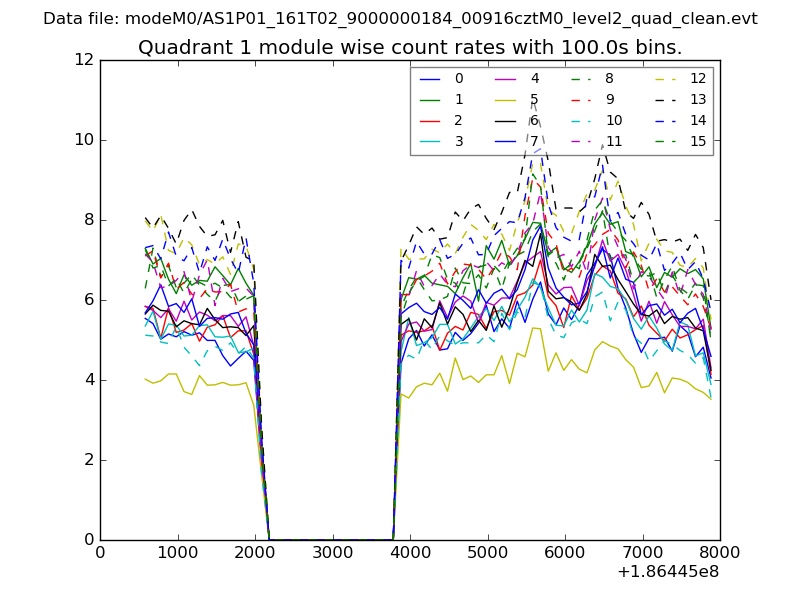
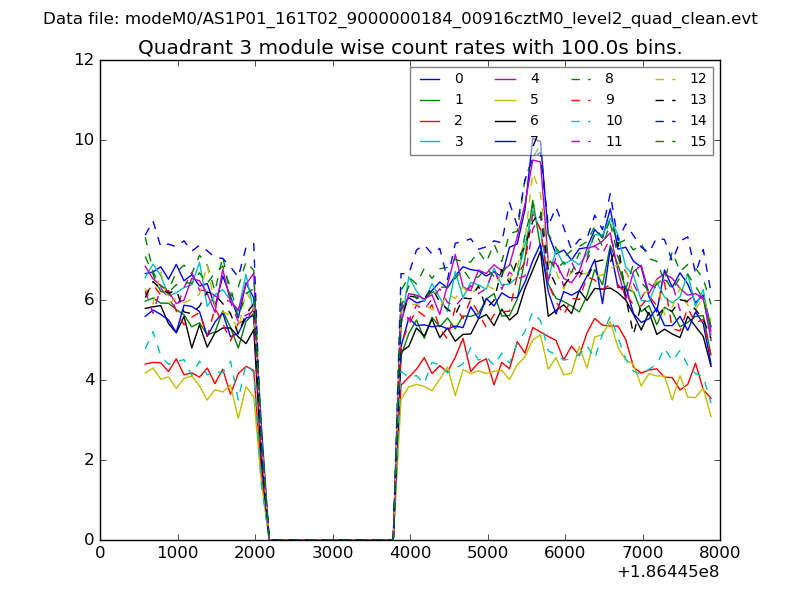
| Module-wise count rates for Quadrant A Data is divided into 100 sec bins |
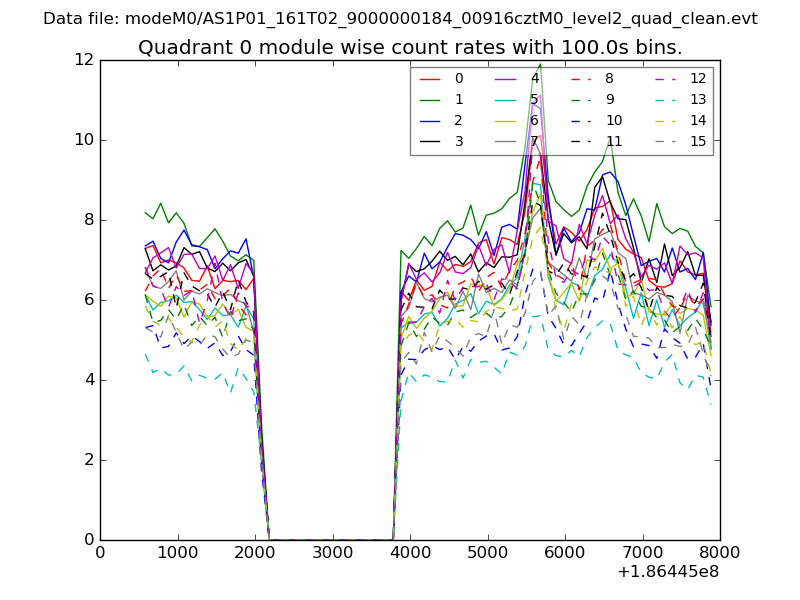 |
 |
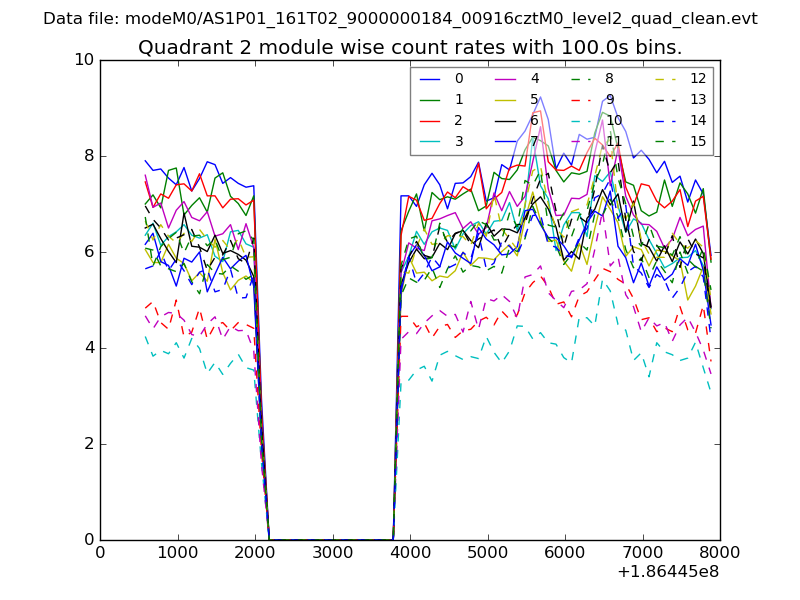
| Module-wise count rates for Quadrant B Data is divided into 100 sec bins |
 |
 |
| Module-wise count rates for Quadrant C Data is divided into 100 sec bins |
 |
 |
| Module-wise count rates for Quadrant D Data is divided into 100 sec bins |
 |
 |
| Parameter | Plot |
|---|---|
| CZT HV Monitor | 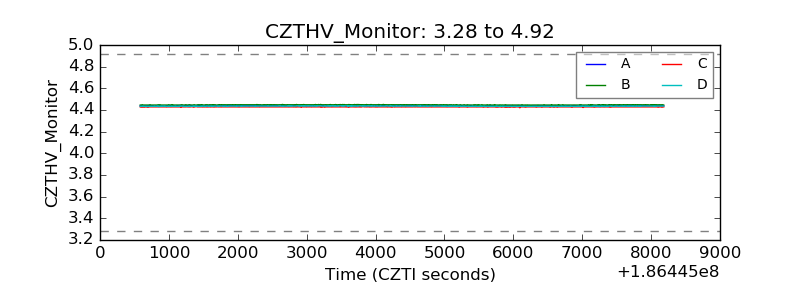 |
| D_VDD | 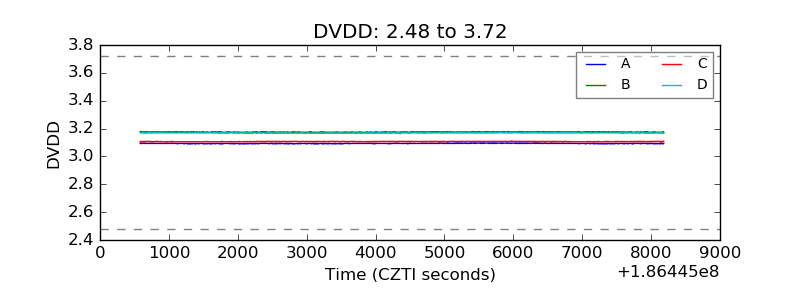 |
| Temperature 1 | 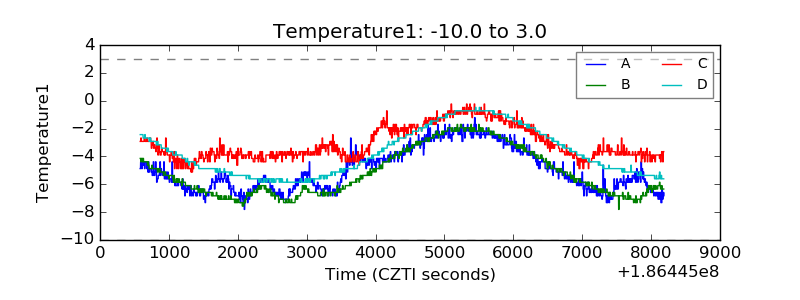 |
| Veto HV Monitor |  |
| Veto LLD | 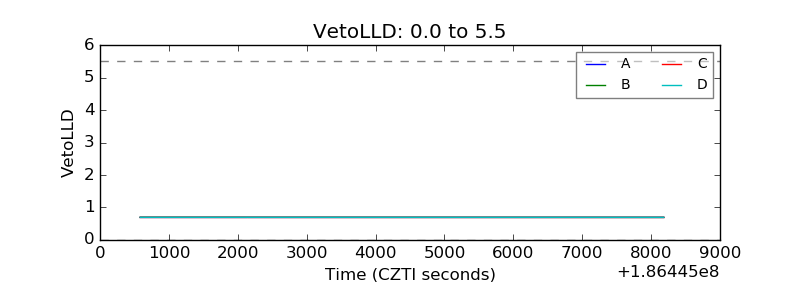 |
| Alpha Counter | 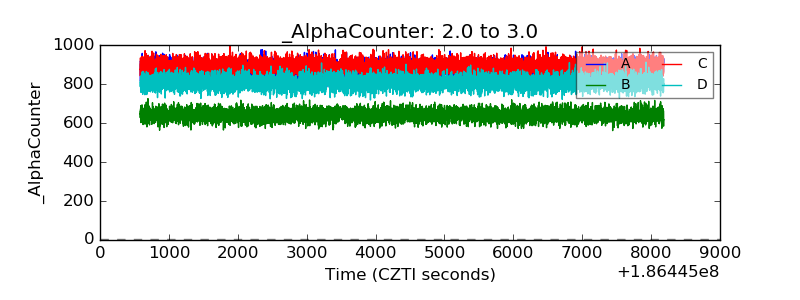 |
| _CPM_Rate | 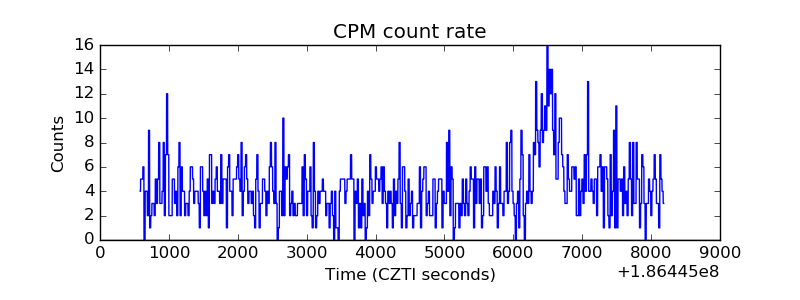 |
| CZT Counter | 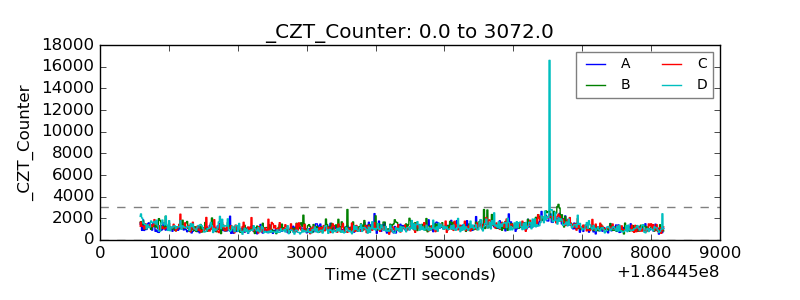 |
| +2.5 Volts monitor |  |
| +5 Volts monitor | 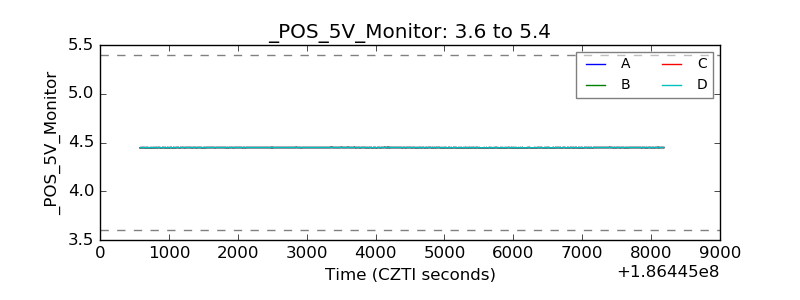 |
| _ROLL_ROT | 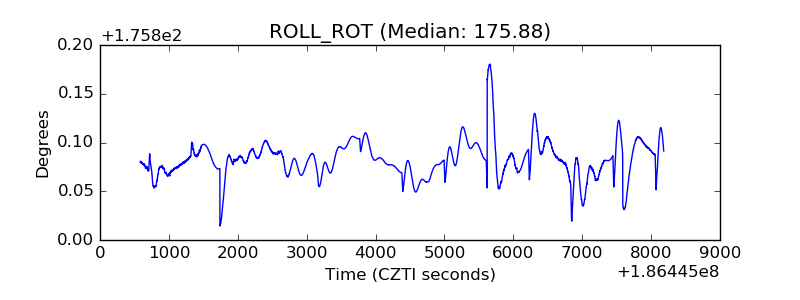 |
| _Roll_DEC | 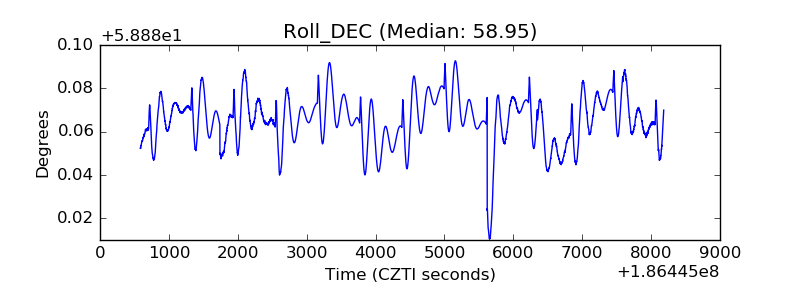 |
| _Roll_RA | 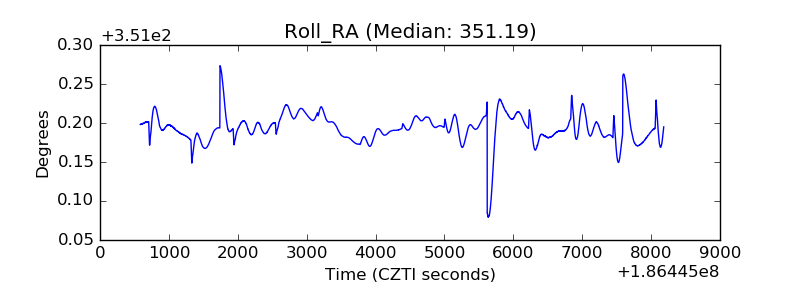 |
| Veto Counter | 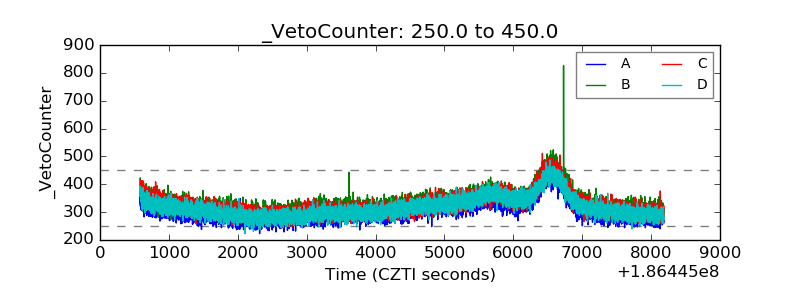 |