| Param | Original file | Final file |
|---|---|---|
| Filename | modeM0/AS1P01_161T02_9000000184_00917cztM0_level2.evt | modeM0/AS1P01_161T02_9000000184_00917cztM0_level2_quad_clean.evt |
| Size (bytes) | 1,224,259,200 | 82,235,520 |
| Size | 1.1 GB | 78.4 MB |
| Events in quadrant A | 8,827,592 | 501,297 |
| Events in quadrant B | 9,608,826 | 499,685 |
| Events in quadrant C | 9,427,997 | 488,955 |
| Events in quadrant D | 8,717,437 | 479,895 |
| Mode SS | |||
|---|---|---|---|
| Quadrant | BADHDUFLAG | Total packets | Discarded packets |
| A | 0 | 150 | 0 |
| B | 0 | 150 | 0 |
| C | 0 | 150 | 0 |
| D | 0 | 150 | 0 |
| Mode M0 | |||
|---|---|---|---|
| Quadrant | BADHDUFLAG | Total packets | Discarded packets |
| A | 0 | 31544 | 0 |
| B | 0 | 33807 | 0 |
| C | 0 | 33280 | 0 |
| D | 0 | 31202 | 0 |
| Quadrant | Total seconds | Saturated seconds | Saturation percentage |
|---|---|---|---|
| A | 7475 | 18 | 0.240803% |
| B | 7475 | 56 | 0.749164% |
| C | 7476 | 79 | 1.056715% |
| D | 7476 | 60 | 0.802568% |
Noise dominated data is calculated using 1-second bins in cleaned event files. If a bin has >2000 counts, and if more than 50% of those come from <1% of pixels, then it is considered to be noise-dominated and hence unusable.
| Quadrant | # 1 sec bins | Bins with >0 counts | Bins with >2000 counts | High rate bins dominated by noise | Noise dominated (total time) | Noise dominated (detector-on time) | Marked lightcurve |
|---|---|---|---|---|---|---|---|
| A | 7515 | 7476 | 304 | 304 | 4.05% | 4.07% | 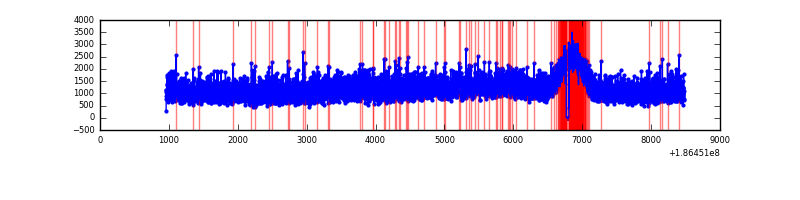 |
| B | 7515 | 7476 | 488 | 488 | 6.49% | 6.53% | 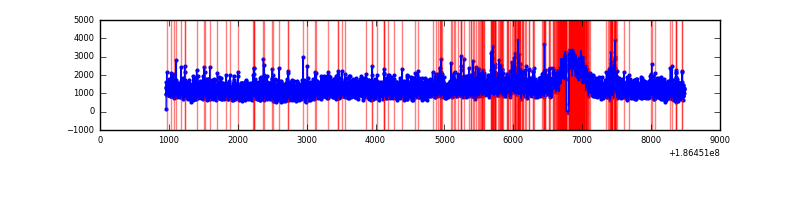 |
| C | 7516 | 7477 | 441 | 441 | 5.87% | 5.90% | 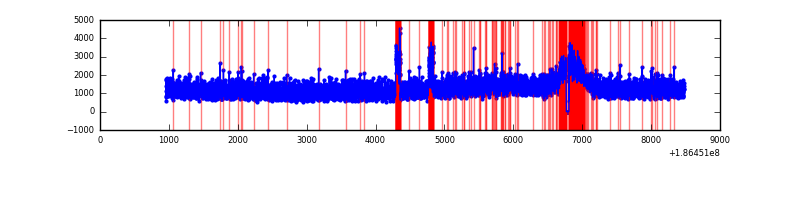 |
| D | 7516 | 7477 | 369 | 369 | 4.91% | 4.94% | 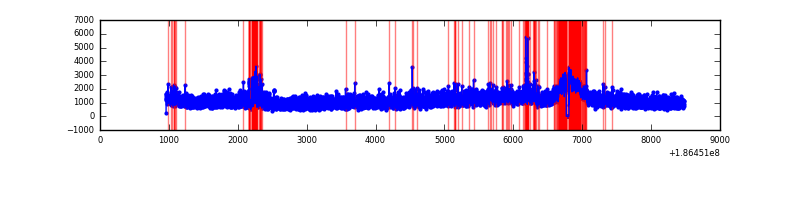 |
Top three noisy pixels from each quadrant. If the there are fewer than three noisy pixels in the level2.evt file, extra rows are filled as -1
| Pixel properties | Quadrant properties | ||||||
|---|---|---|---|---|---|---|---|
| Quadrant | DetID | PixID | Counts | Sigma | Mean | Median | Sigma |
| A | 15 | 127 | 40558 | 69.17 | 2290 | 2311 | 552.9 |
| A | 11 | 79 | 9419 | 12.85 | 2290 | 2311 | 552.9 |
| A | 3 | 111 | 7331 | 9.08 | 2290 | 2311 | 552.9 |
| B | 3 | 0 | 157205 | 270.33 | 2414 | 2425 | 572.6 |
| B | 0 | 182 | 93999 | 159.94 | 2414 | 2425 | 572.6 |
| B | 5 | 191 | 58621 | 98.15 | 2414 | 2425 | 572.6 |
| C | 15 | 241 | 422518 | 685.43 | 2200 | 2273 | 613.1 |
| C | 9 | 83 | 354562 | 574.59 | 2200 | 2273 | 613.1 |
| C | 3 | 111 | 31249 | 47.26 | 2200 | 2273 | 613.1 |
| D | 12 | 188 | 334695 | 510.26 | 2100 | 2179 | 651.7 |
| D | 1 | 4 | 300404 | 457.64 | 2100 | 2179 | 651.7 |
| D | 7 | 207 | 158136 | 239.32 | 2100 | 2179 | 651.7 |
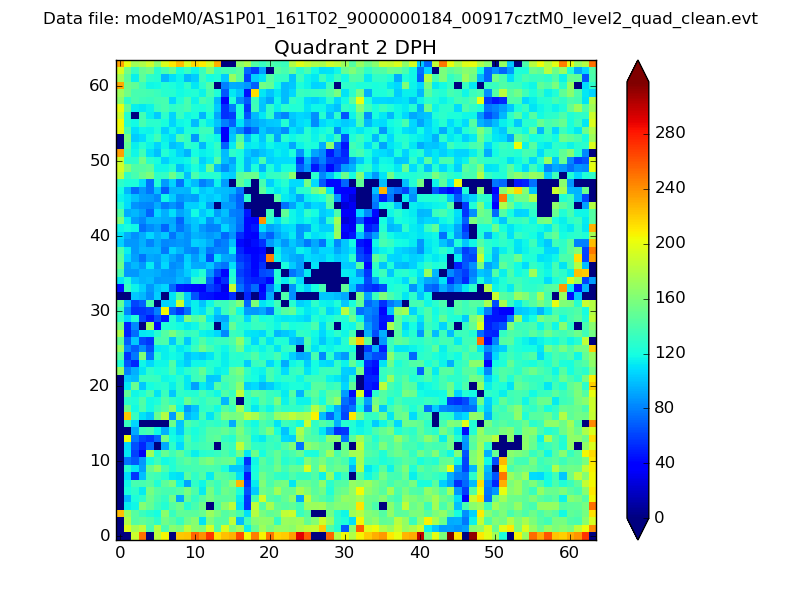
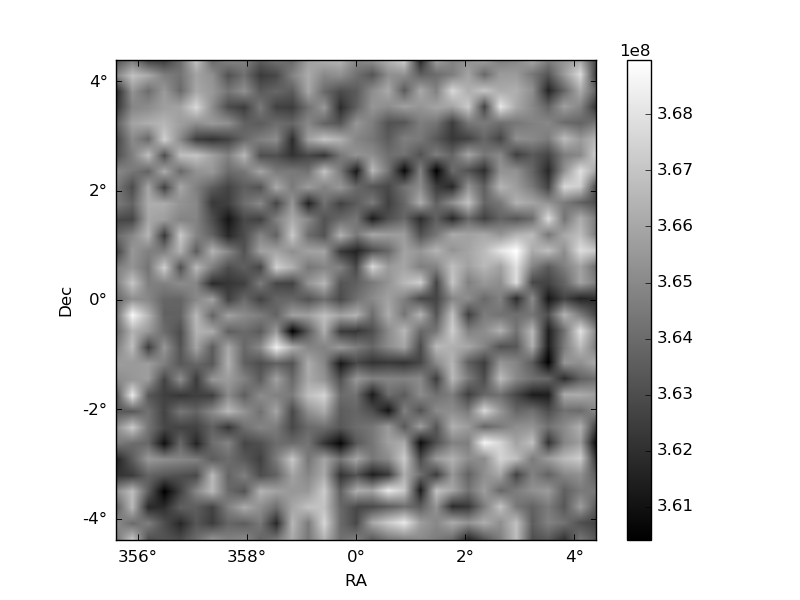
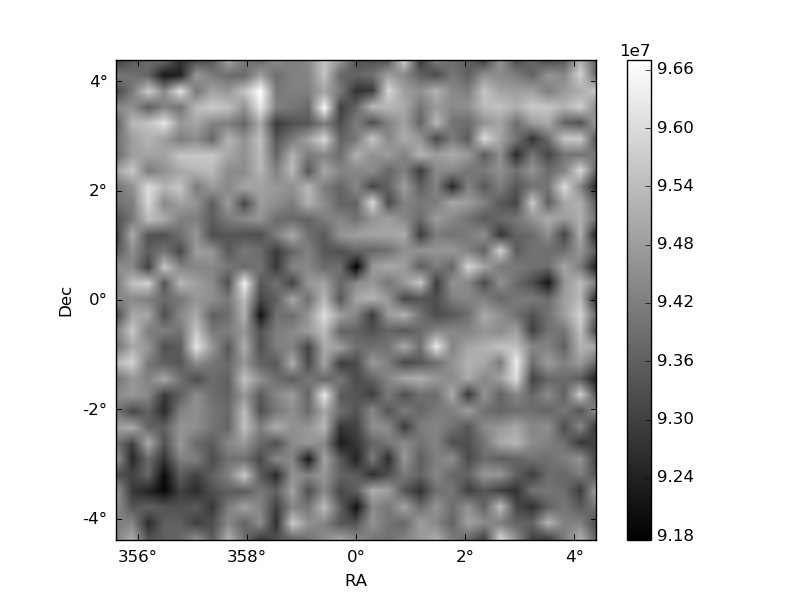
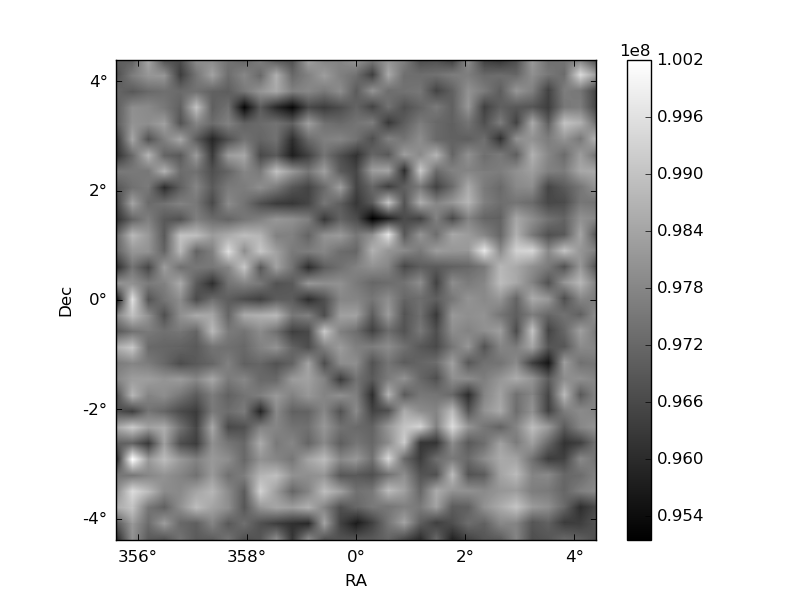
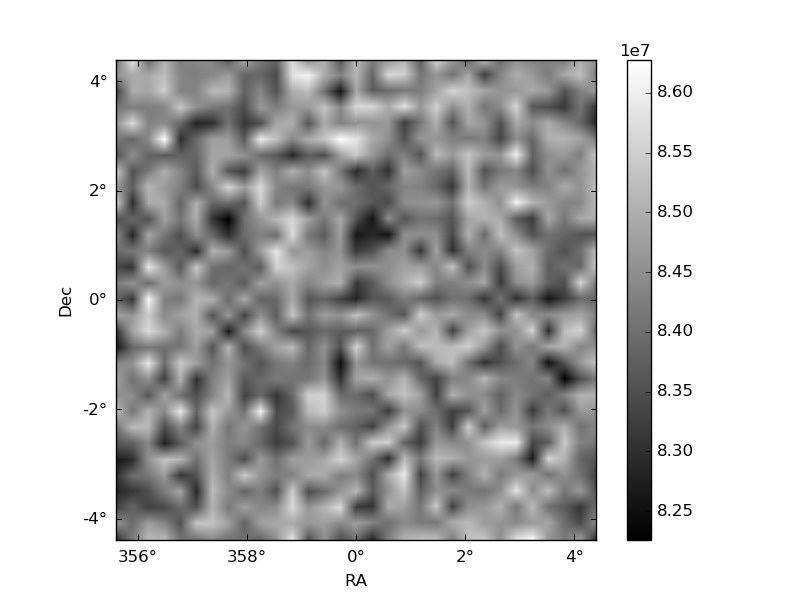
Histogram calculated using DETX and DETY for each event in the final _common_clean file
| Quadrant A | 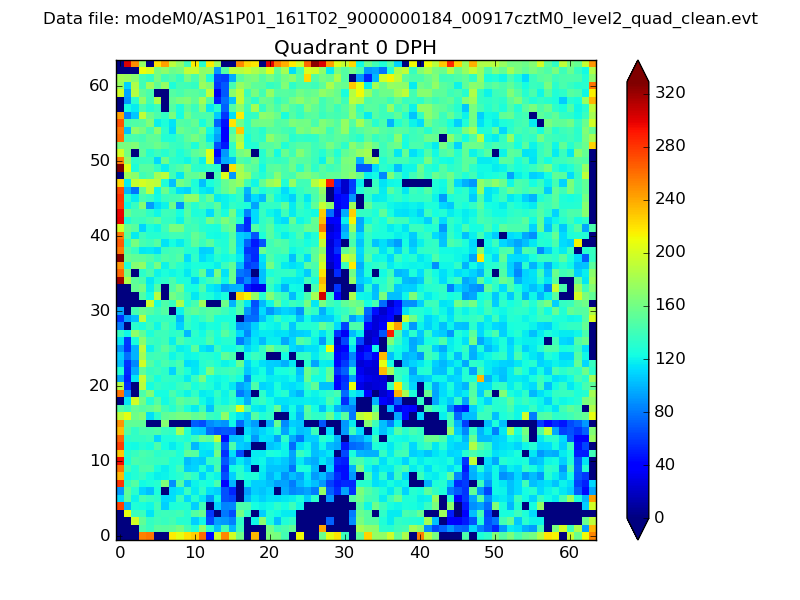 |
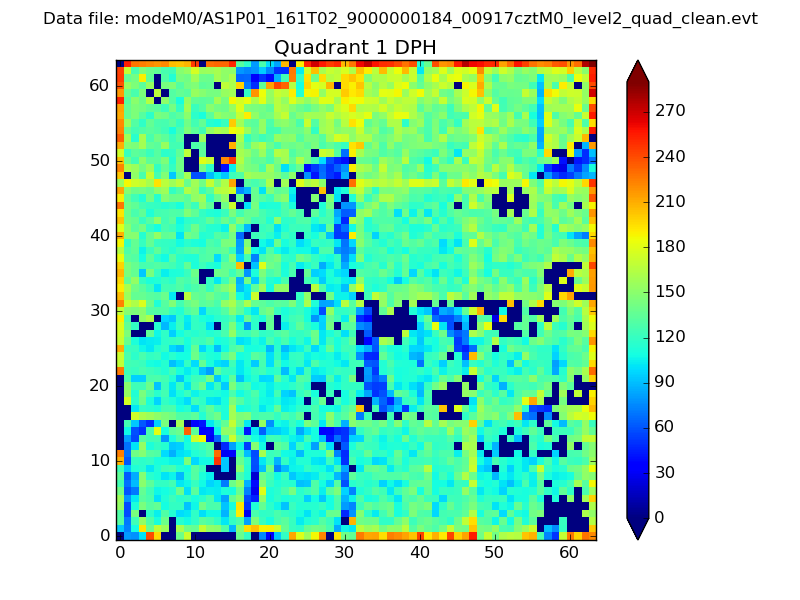 |
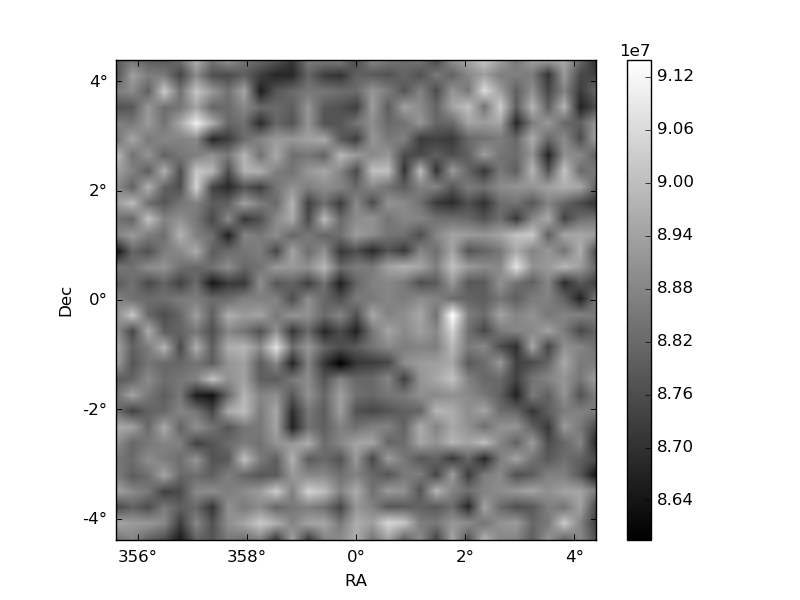
Quadrant B |
|---|---|---|---|
| Quadrant D | 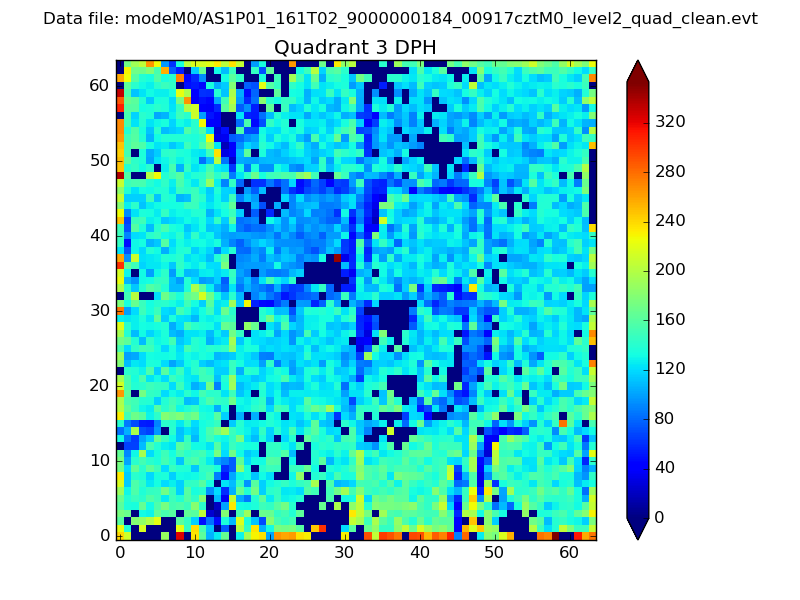 |
 |
Quadrant C |
| Plot type | Count rate plots | Images |
|---|---|---|
| Comparison with Poisson distribution Blue bars denote a histogram of data divided into 1 sec bins. Red curve is a Poisson curve with rate = median count rate of data. |
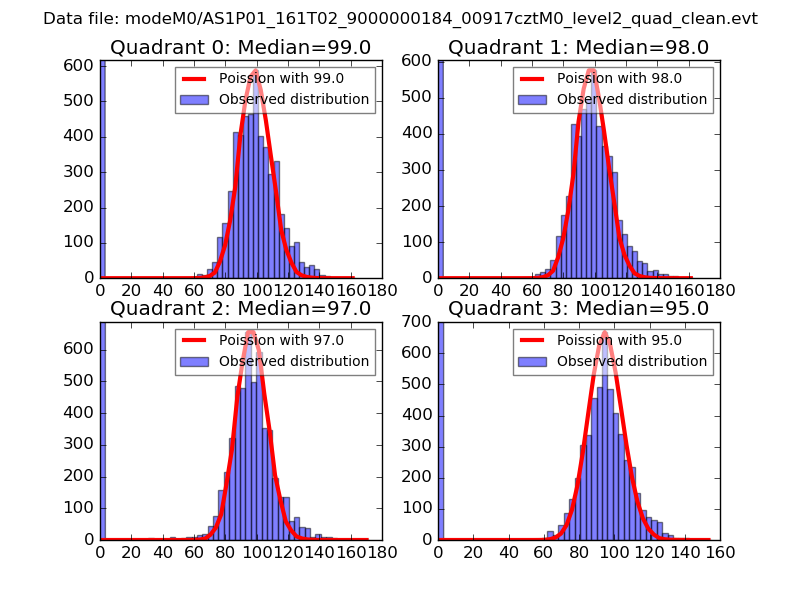 |
 |
| Quadrant-wise count rates Data is divided into 100 sec bins |
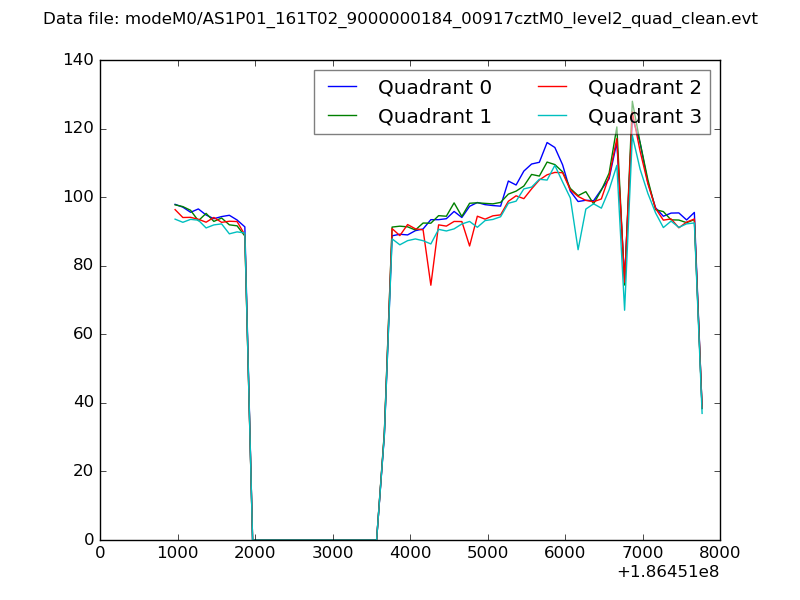 |
|
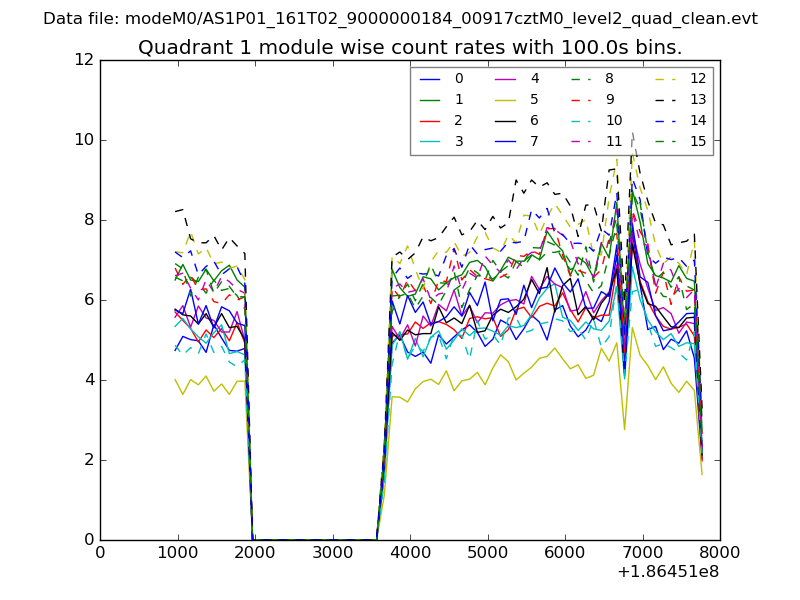
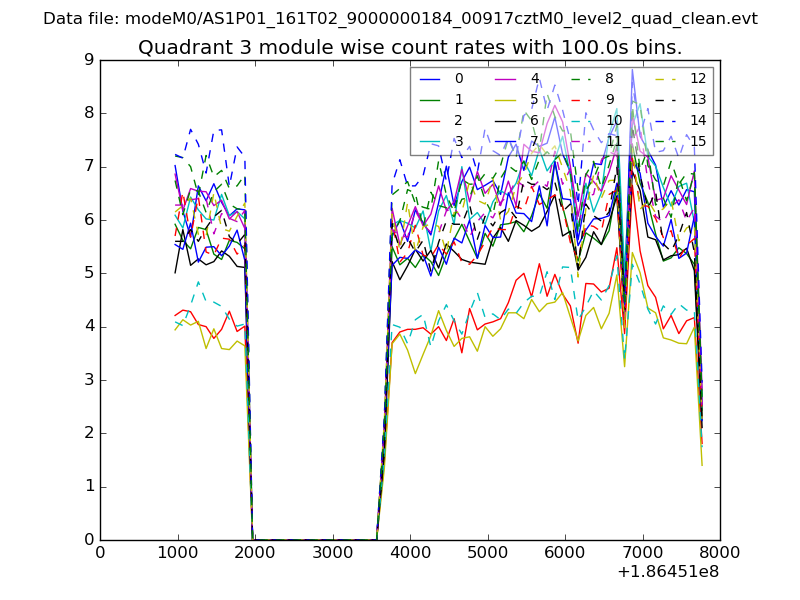
| Module-wise count rates for Quadrant A Data is divided into 100 sec bins |
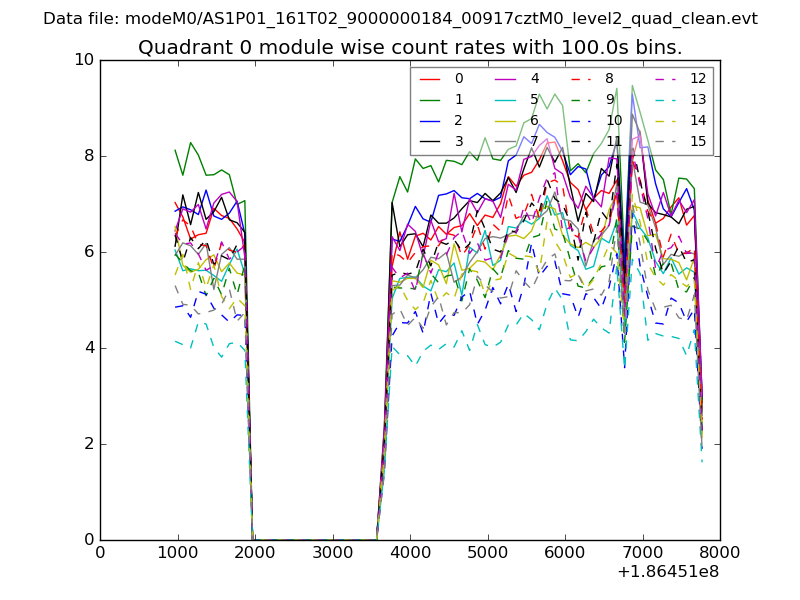 |
 |
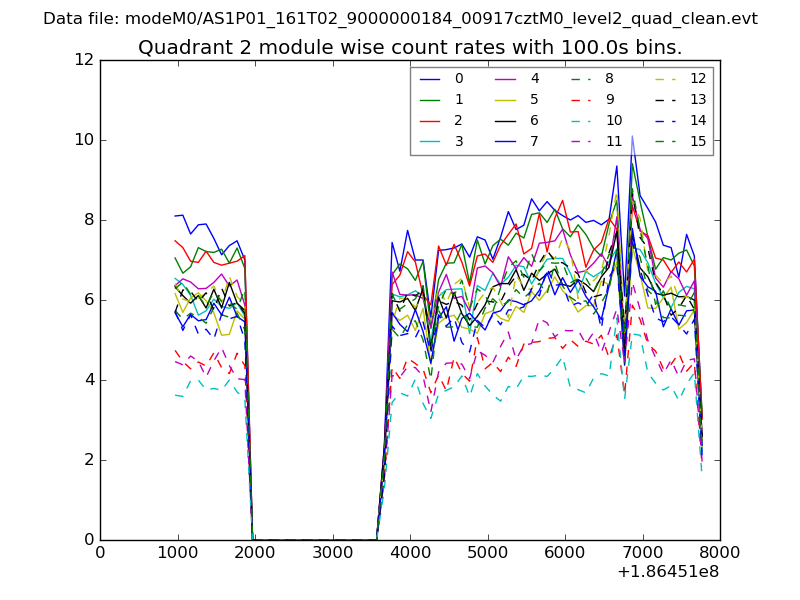
| Module-wise count rates for Quadrant B Data is divided into 100 sec bins |
 |
 |
| Module-wise count rates for Quadrant C Data is divided into 100 sec bins |
 |
 |
| Module-wise count rates for Quadrant D Data is divided into 100 sec bins |
 |
 |
| Parameter | Plot |
|---|---|
| CZT HV Monitor | 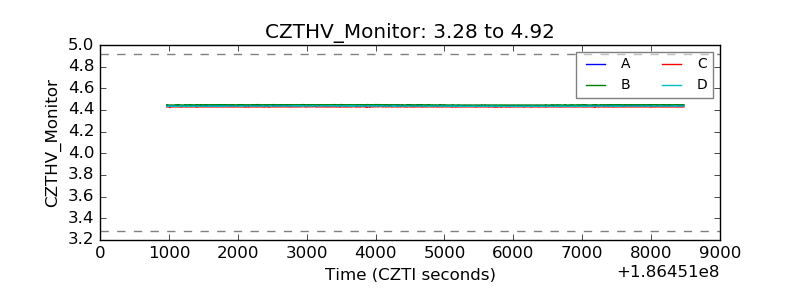 |
| D_VDD | 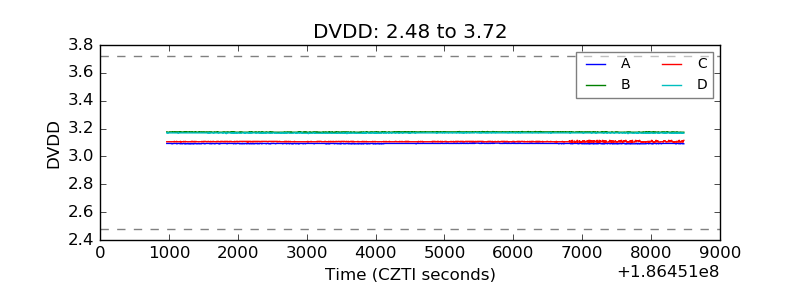 |
| Temperature 1 |  |
| Veto HV Monitor | 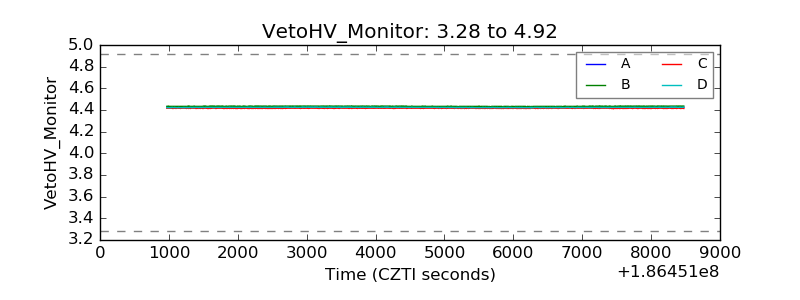 |
| Veto LLD | 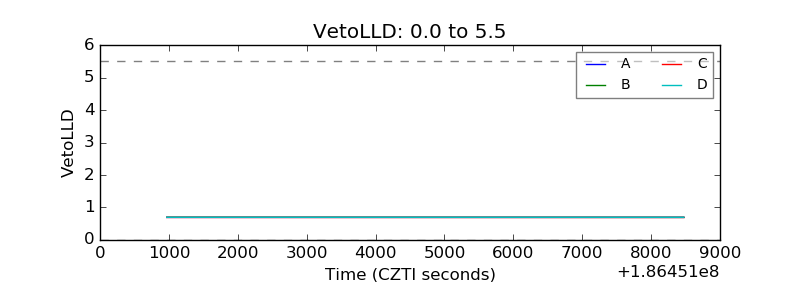 |
| Alpha Counter | 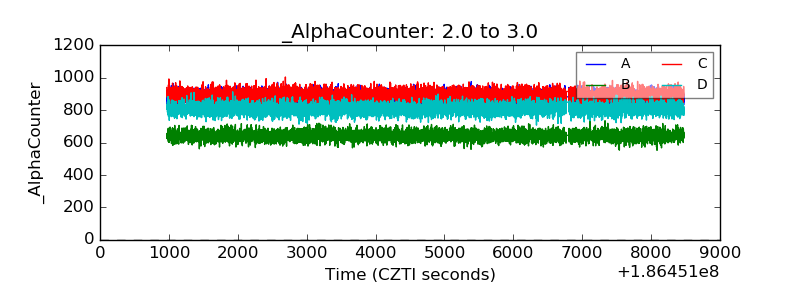 |
| _CPM_Rate | 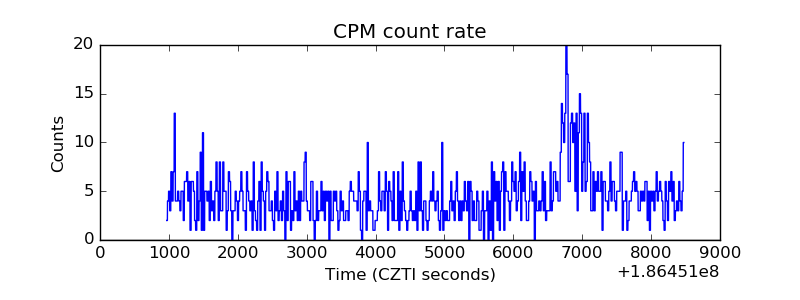 |
| CZT Counter | 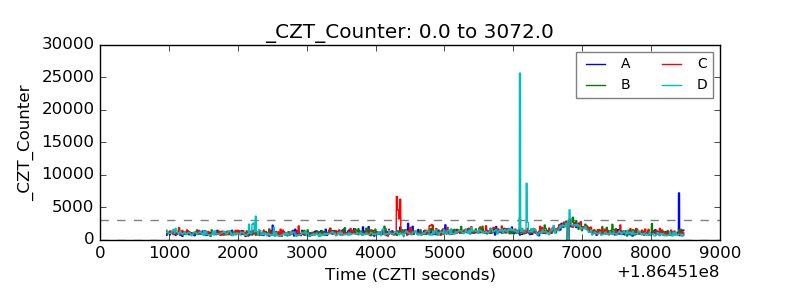 |
| +2.5 Volts monitor |  |
| +5 Volts monitor |  |
| _ROLL_ROT | 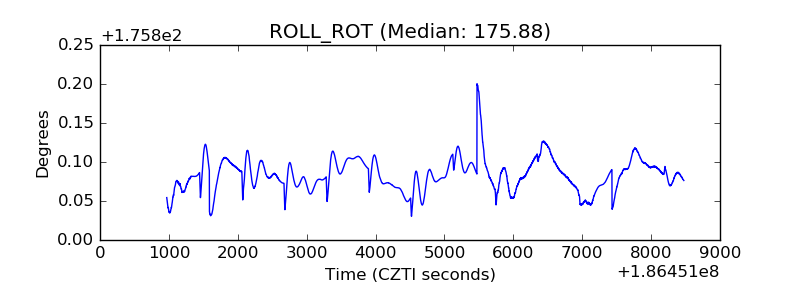 |
| _Roll_DEC | 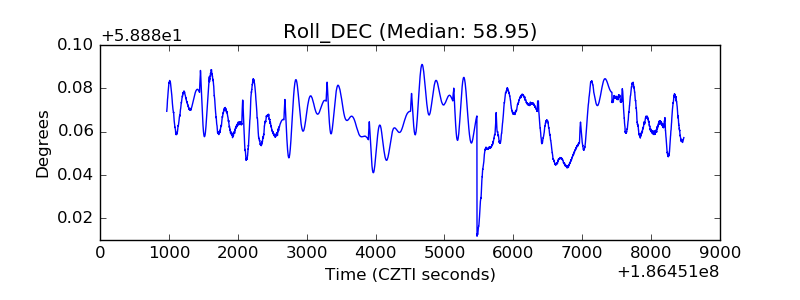 |
| _Roll_RA | 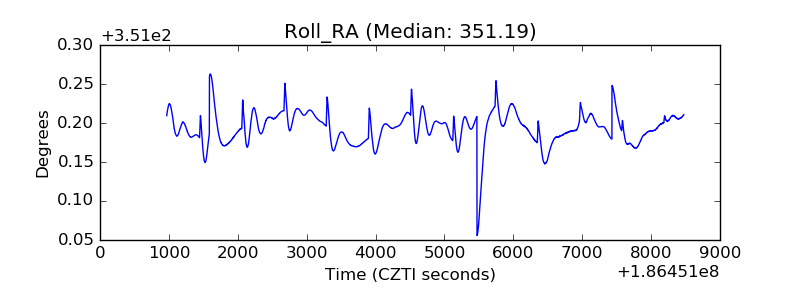 |
| Veto Counter | 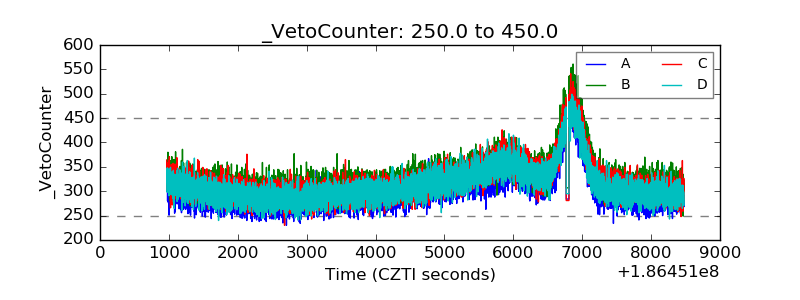 |