| Param | Original file | Final file |
|---|---|---|
| Filename | modeM0/AS1P01_161T02_9000000184_00918cztM0_level2.evt | modeM0/AS1P01_161T02_9000000184_00918cztM0_level2_quad_clean.evt |
| Size (bytes) | 723,559,680 | 46,313,280 |
| Size | 690.0 MB | 44.2 MB |
| Events in quadrant A | 5,217,898 | 275,132 |
| Events in quadrant B | 6,053,896 | 268,127 |
| Events in quadrant C | 5,464,713 | 268,586 |
| Events in quadrant D | 4,867,777 | 264,401 |
| Mode SS | |||
|---|---|---|---|
| Quadrant | BADHDUFLAG | Total packets | Discarded packets |
| A | 0 | 92 | 0 |
| B | 0 | 92 | 0 |
| C | 0 | 92 | 0 |
| D | 0 | 92 | 0 |
| Mode M0 | |||
|---|---|---|---|
| Quadrant | BADHDUFLAG | Total packets | Discarded packets |
| A | 0 | 18766 | 0 |
| B | 0 | 21295 | 0 |
| C | 0 | 19544 | 0 |
| D | 0 | 17787 | 0 |
| Quadrant | Total seconds | Saturated seconds | Saturation percentage |
|---|---|---|---|
| A | 4636 | 0 | 0.000000% |
| B | 4636 | 122 | 2.631579% |
| C | 4637 | 1 | 0.021566% |
| D | 4637 | 3 | 0.064697% |
Noise dominated data is calculated using 1-second bins in cleaned event files. If a bin has >2000 counts, and if more than 50% of those come from <1% of pixels, then it is considered to be noise-dominated and hence unusable.
| Quadrant | # 1 sec bins | Bins with >0 counts | Bins with >2000 counts | High rate bins dominated by noise | Noise dominated (total time) | Noise dominated (detector-on time) | Marked lightcurve |
|---|---|---|---|---|---|---|---|
| A | 4636 | 4636 | 39 | 39 | 0.84% | 0.84% | 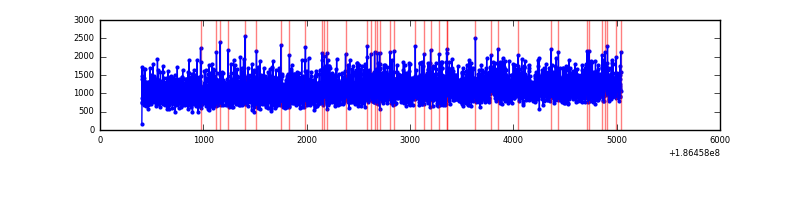 |
| B | 4636 | 4636 | 358 | 358 | 7.72% | 7.72% | 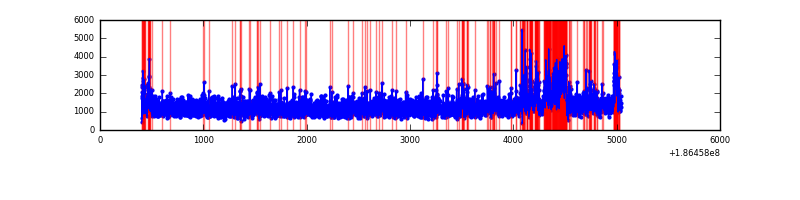 |
| C | 4637 | 4637 | 55 | 55 | 1.19% | 1.19% | 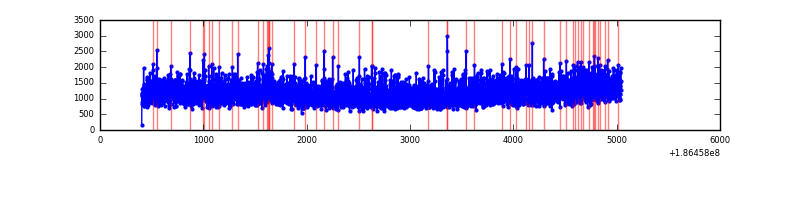 |
| D | 4637 | 4637 | 45 | 45 | 0.97% | 0.97% | 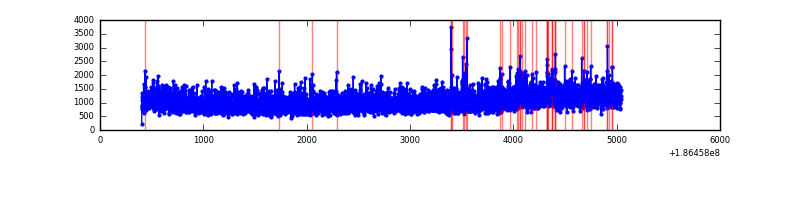 |
Top three noisy pixels from each quadrant. If the there are fewer than three noisy pixels in the level2.evt file, extra rows are filled as -1
| Pixel properties | Quadrant properties | ||||||
|---|---|---|---|---|---|---|---|
| Quadrant | DetID | PixID | Counts | Sigma | Mean | Median | Sigma |
| A | 11 | 79 | 4898 | 10.66 | 1359 | 1371 | 330.8 |
| A | 3 | 111 | 4320 | 8.92 | 1359 | 1371 | 330.8 |
| A | 14 | 203 | 3582 | 6.68 | 1359 | 1371 | 330.8 |
| B | 3 | 0 | 610384 | 1832.59 | 1400 | 1409 | 332.3 |
| B | 8 | 234 | 38232 | 110.81 | 1400 | 1409 | 332.3 |
| B | 7 | 221 | 18231 | 50.62 | 1400 | 1409 | 332.3 |
| C | 15 | 241 | 378140 | 1063.7 | 1265 | 1311 | 354.3 |
| C | 9 | 83 | 99583 | 277.4 | 1265 | 1311 | 354.3 |
| C | 3 | 111 | 21861 | 58.01 | 1265 | 1311 | 354.3 |
| D | 1 | 4 | 130889 | 338.22 | 1232 | 1279 | 383.2 |
| D | 13 | 73 | 35713 | 89.86 | 1232 | 1279 | 383.2 |
| D | 12 | 188 | 35177 | 88.46 | 1232 | 1279 | 383.2 |
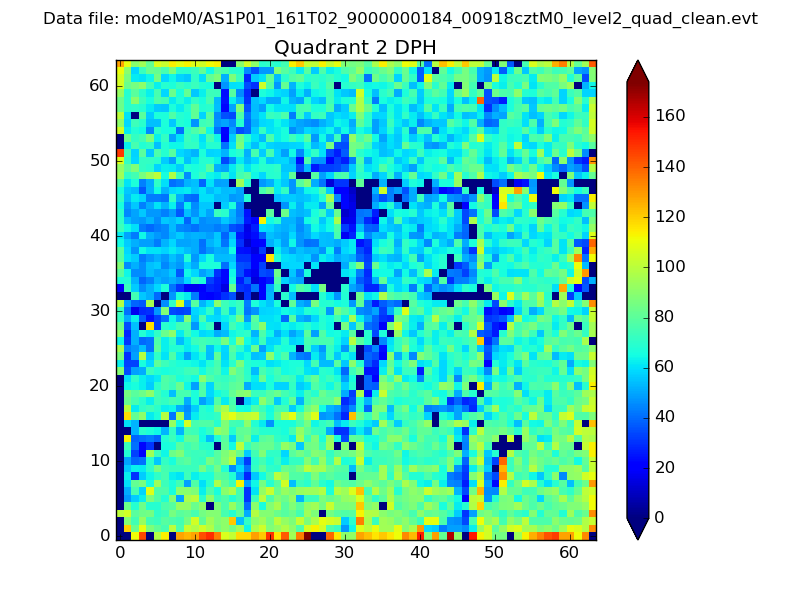
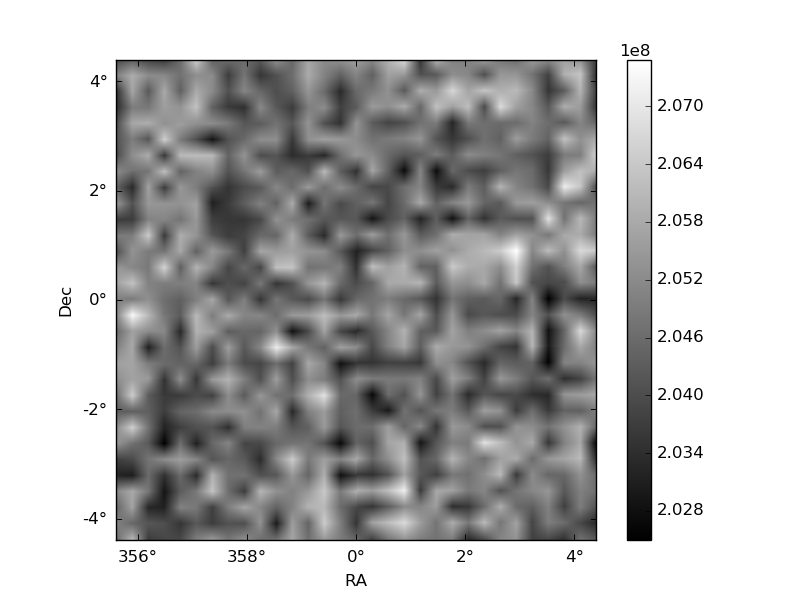
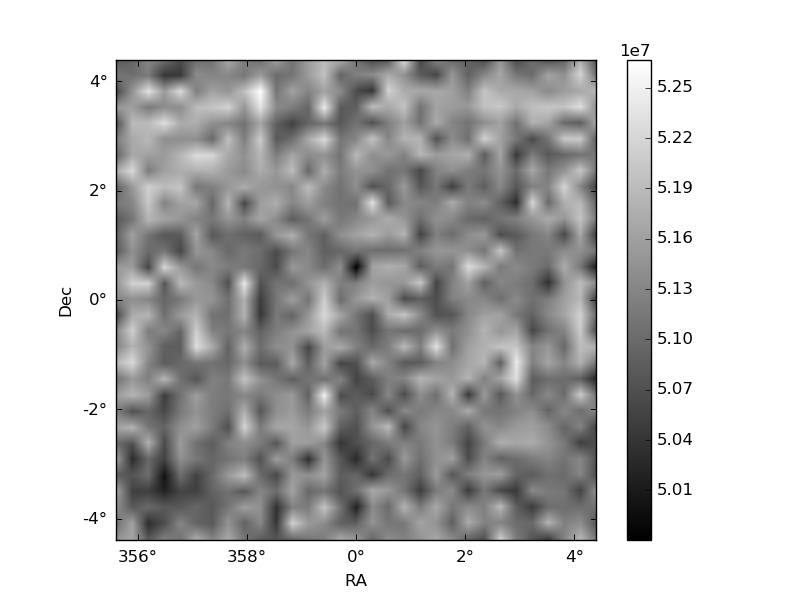
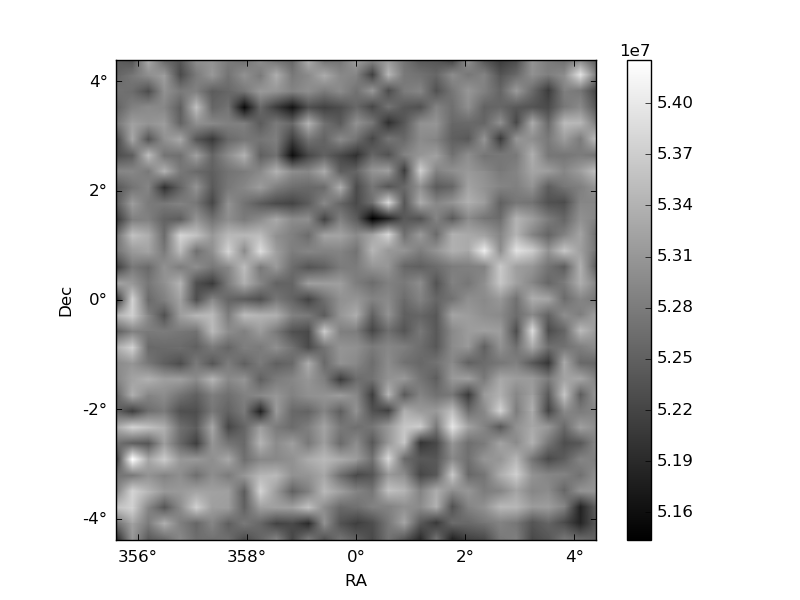
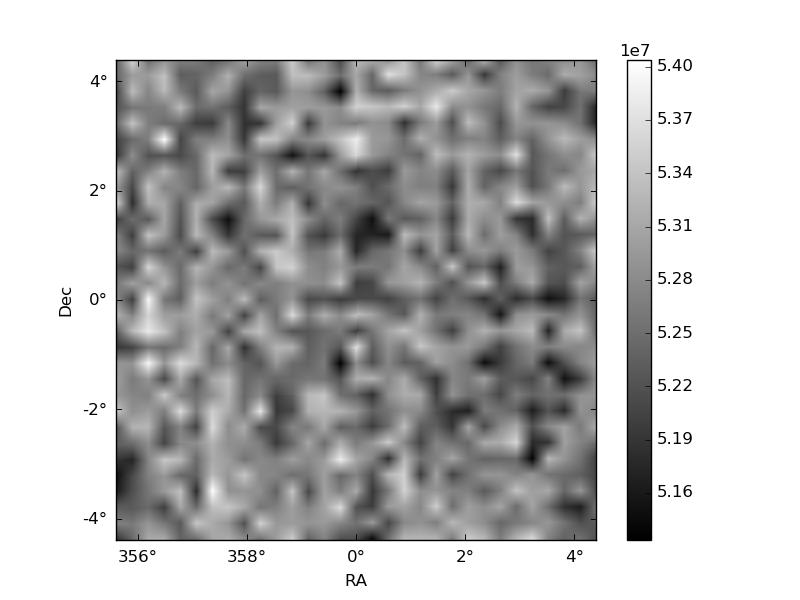
Histogram calculated using DETX and DETY for each event in the final _common_clean file
| Quadrant A | 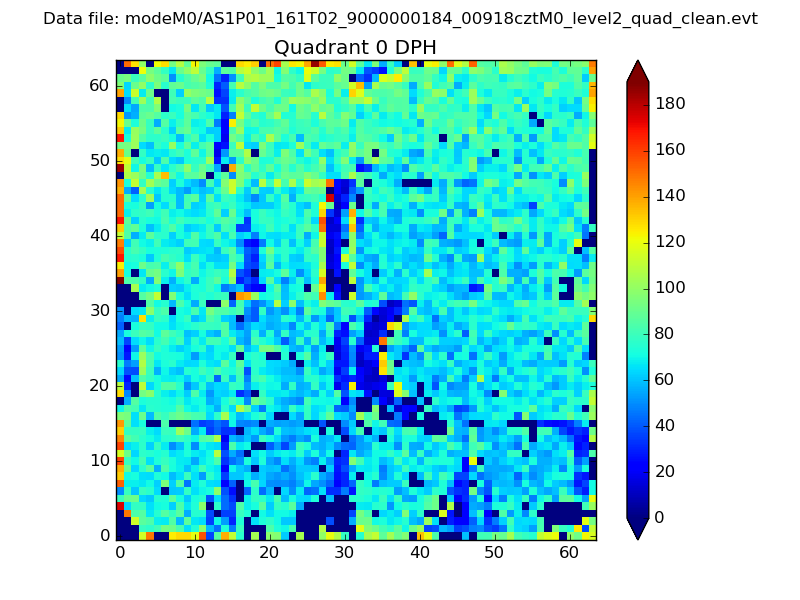 |
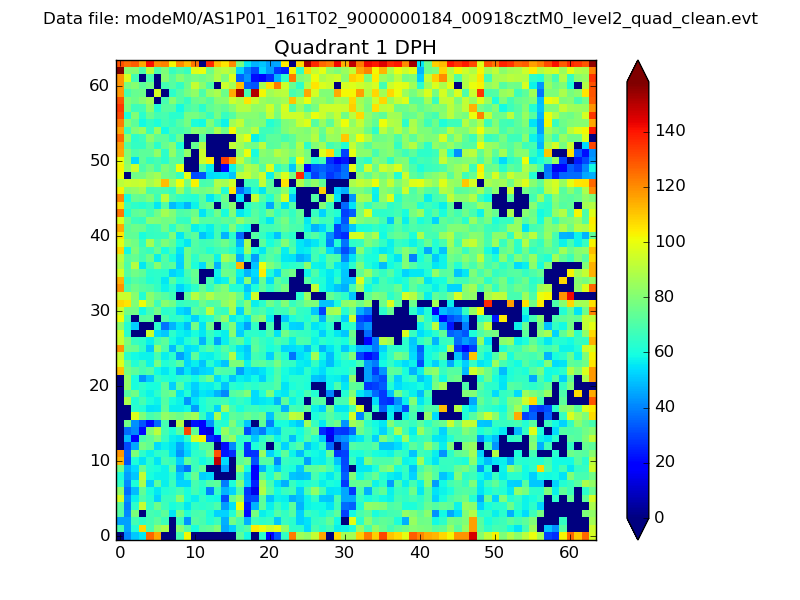 |
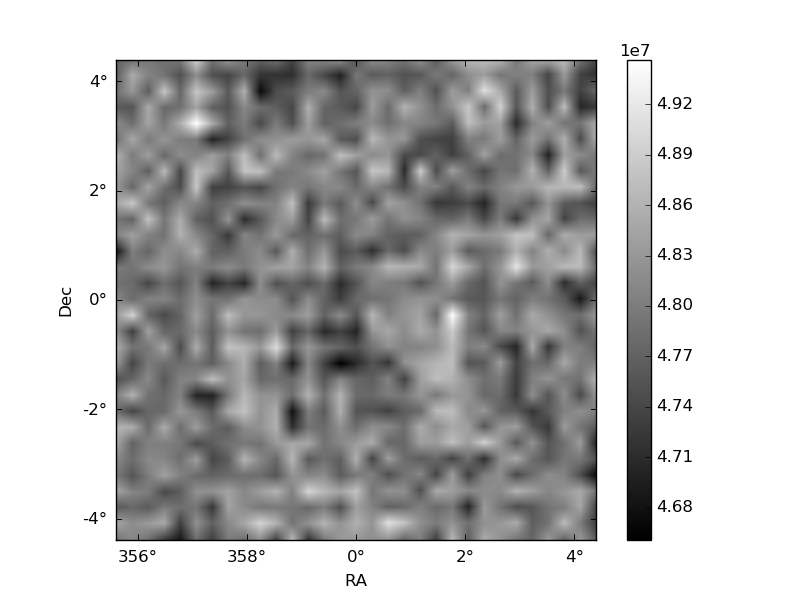
Quadrant B |
|---|---|---|---|
| Quadrant D | 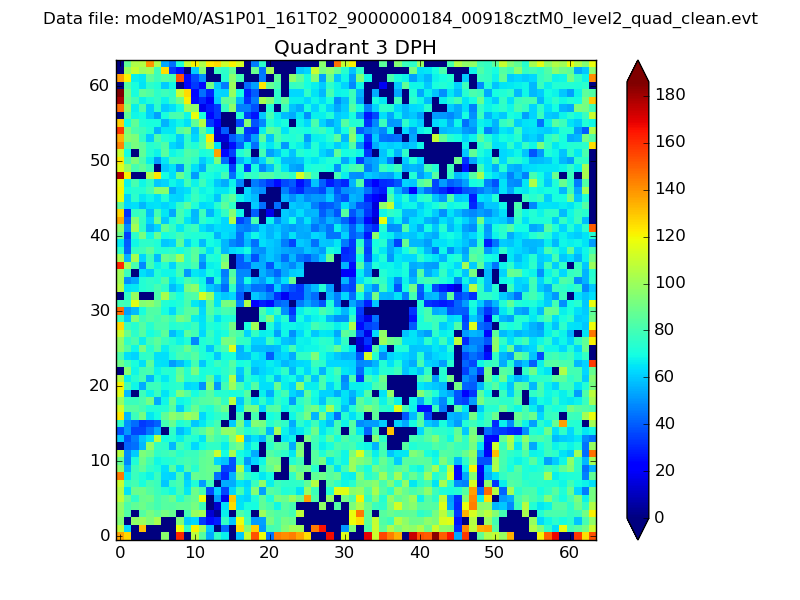 |
 |
Quadrant C |
| Plot type | Count rate plots | Images |
|---|---|---|
| Comparison with Poisson distribution Blue bars denote a histogram of data divided into 1 sec bins. Red curve is a Poisson curve with rate = median count rate of data. |
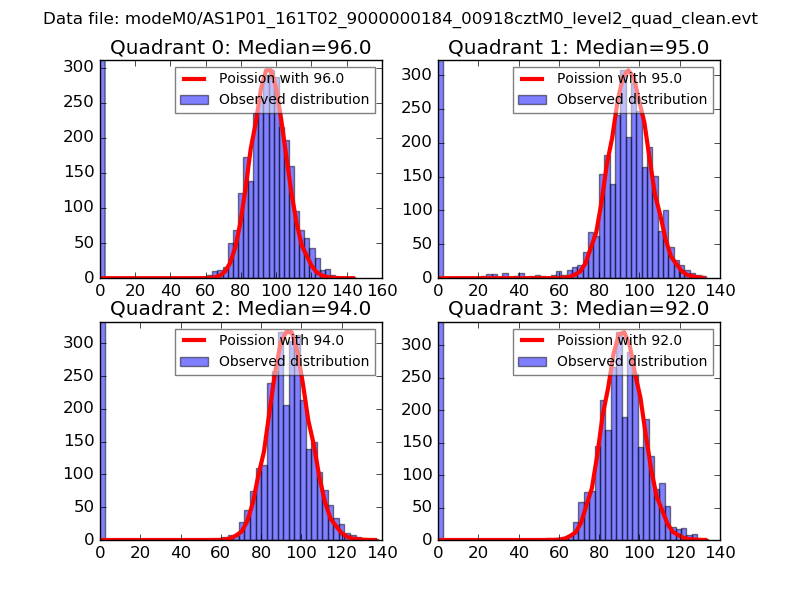 |
 |
| Quadrant-wise count rates Data is divided into 100 sec bins |
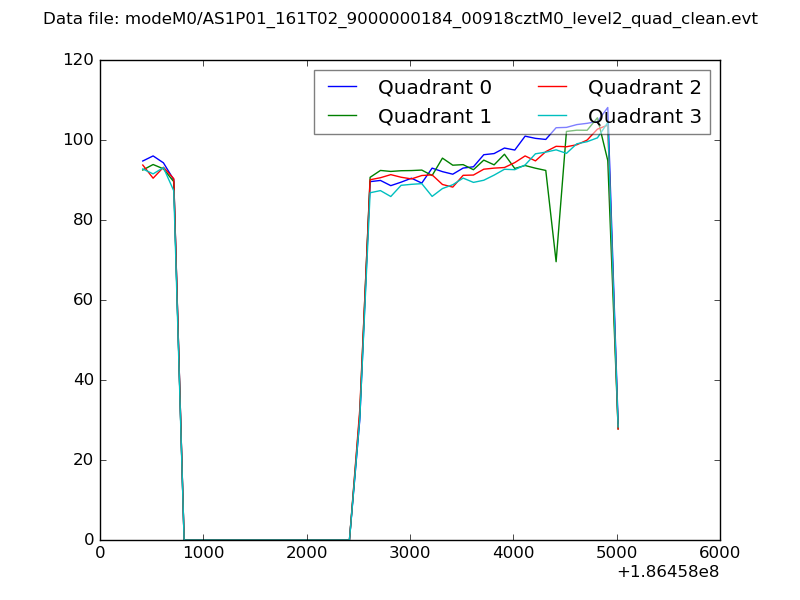 |
|
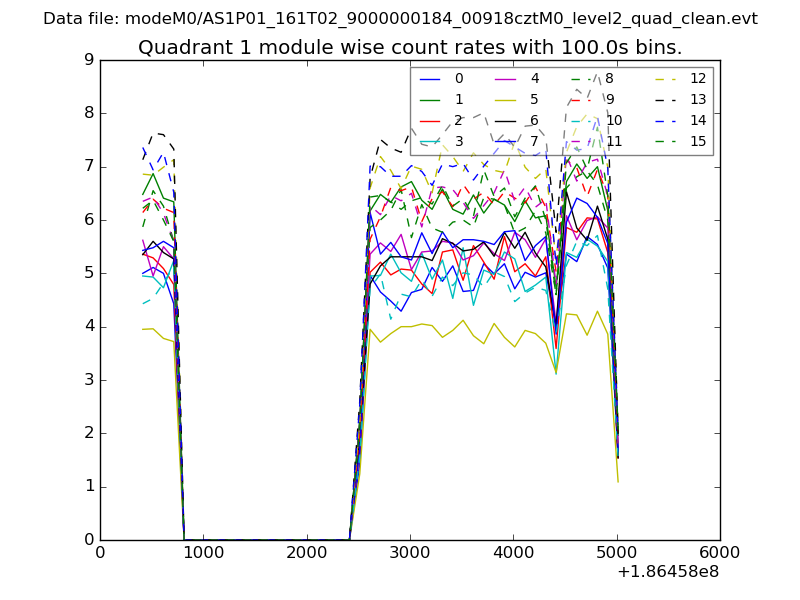
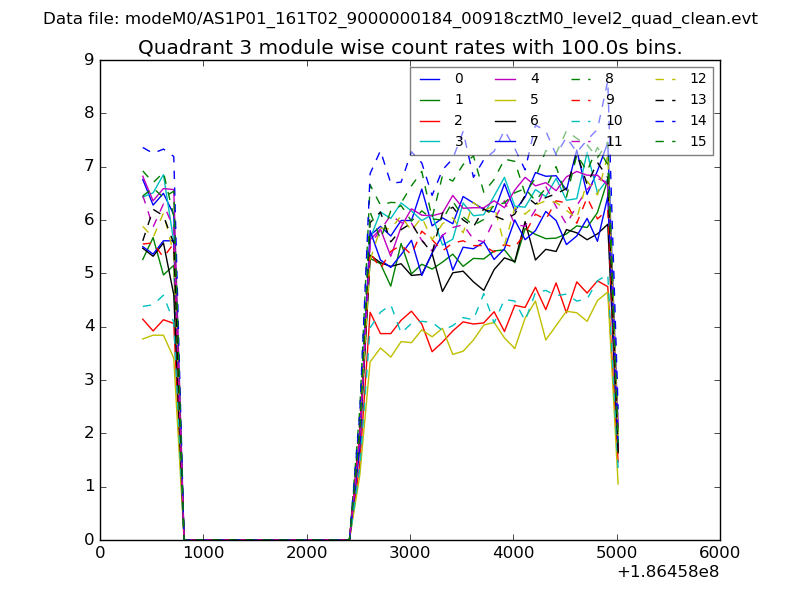
| Module-wise count rates for Quadrant A Data is divided into 100 sec bins |
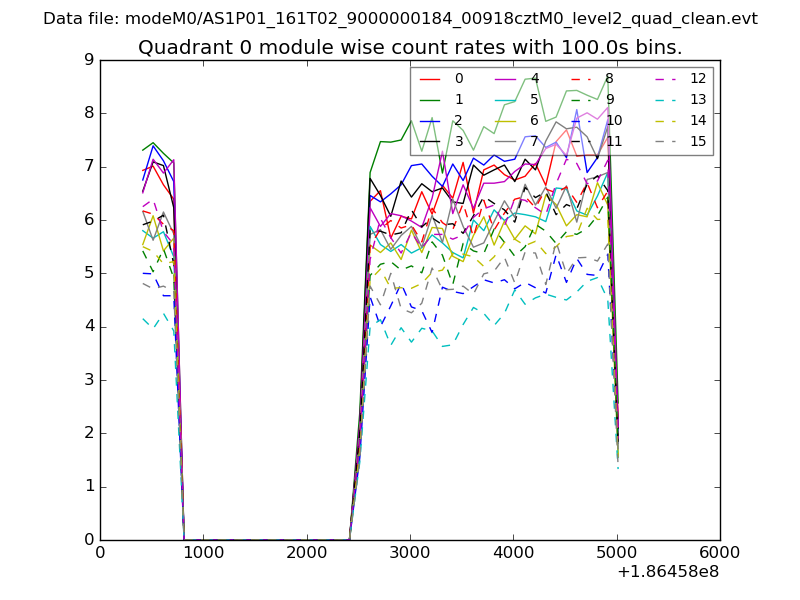 |
 |
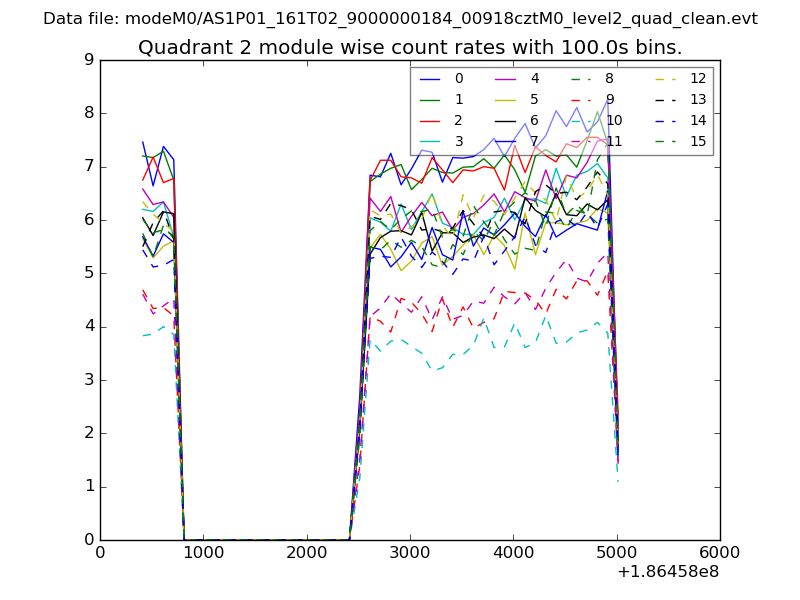
| Module-wise count rates for Quadrant B Data is divided into 100 sec bins |
 |
 |
| Module-wise count rates for Quadrant C Data is divided into 100 sec bins |
 |
 |
| Module-wise count rates for Quadrant D Data is divided into 100 sec bins |
 |
 |
| Parameter | Plot |
|---|---|
| CZT HV Monitor | 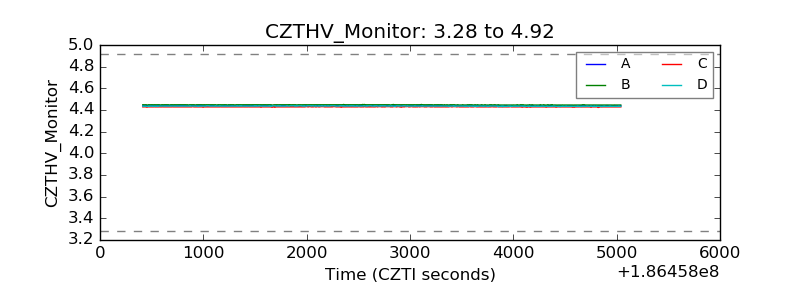 |
| D_VDD | 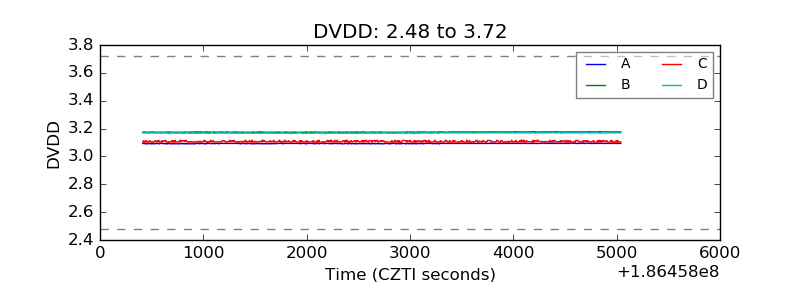 |
| Temperature 1 | 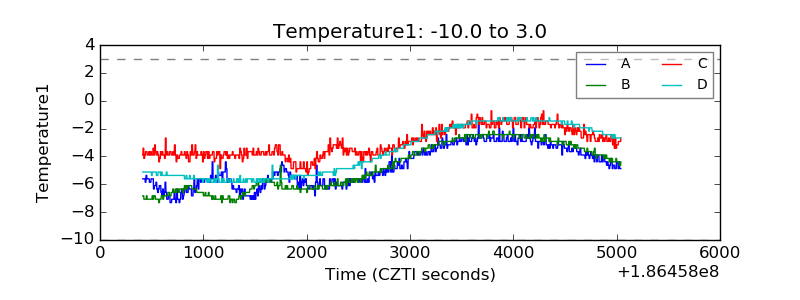 |
| Veto HV Monitor |  |
| Veto LLD | 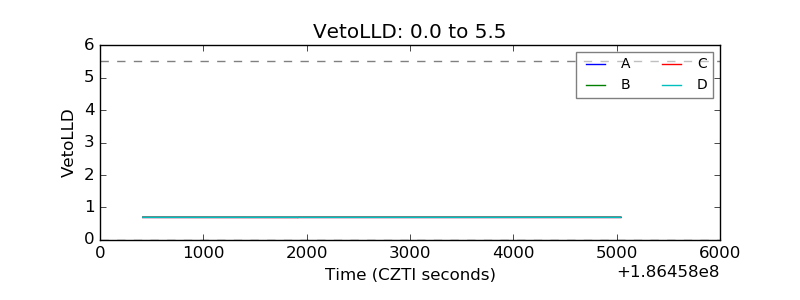 |
| Alpha Counter | 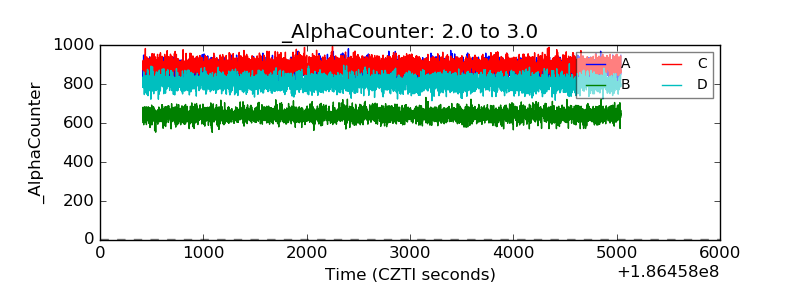 |
| _CPM_Rate | 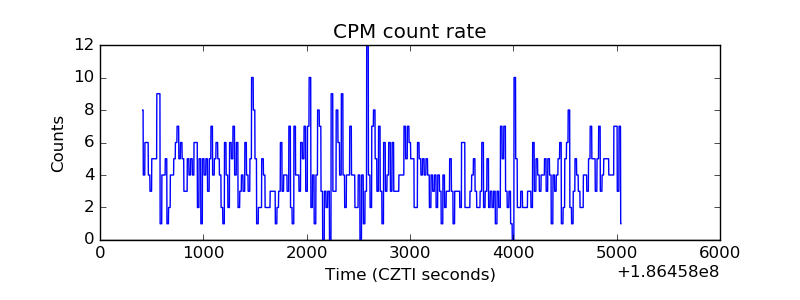 |
| CZT Counter | 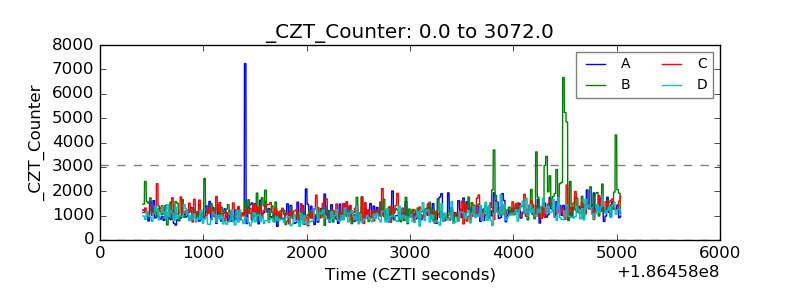 |
| +2.5 Volts monitor |  |
| +5 Volts monitor | 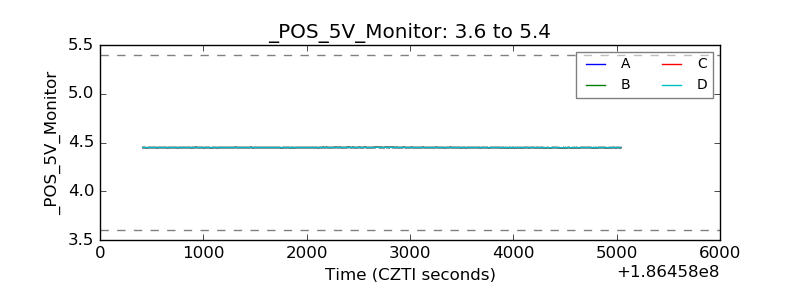 |
| _ROLL_ROT | 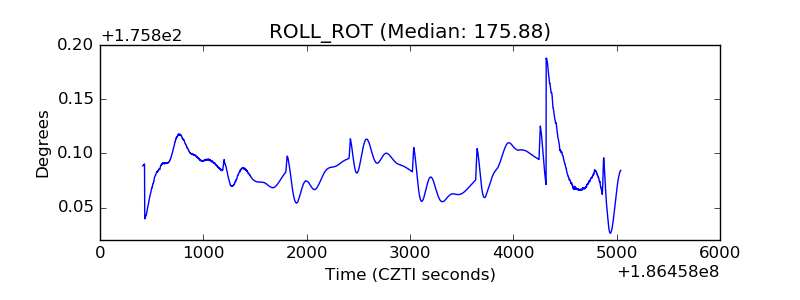 |
| _Roll_DEC | 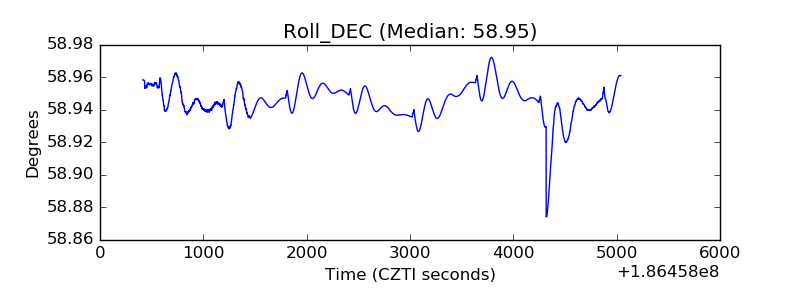 |
| _Roll_RA | 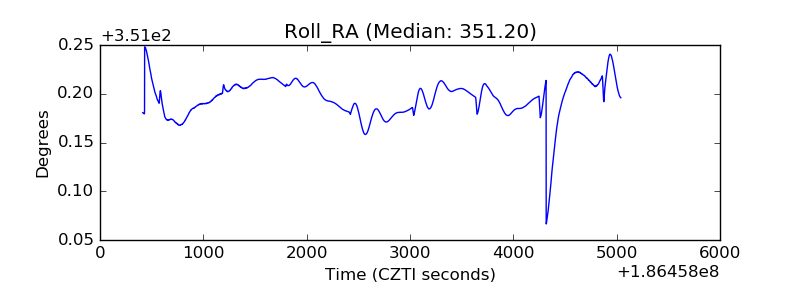 |
| Veto Counter | 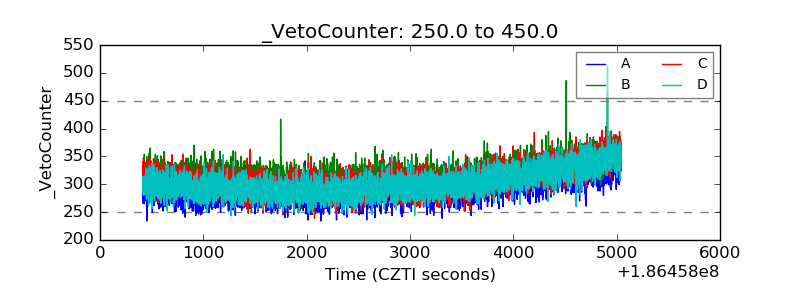 |