| Param | Original file | Final file |
|---|---|---|
| Filename | modeM0/AS1P01_165T08_9000000182cztM0_level2.fits | modeM0/AS1P01_165T08_9000000182cztM0_level2_quad_clean.evt |
| Size (bytes) | 181,212,480 | 262,189,440 |
| Size | 172.8 MB | 250.0 MB |
| Events in quadrant A | 1,055,512 | 1,741,348 |
| Events in quadrant B | 962,762 | 1,536,109 |
| Events in quadrant C | 1,025,242 | 1,615,373 |
| Events in quadrant D | 888,274 | 1,492,786 |
| Mode M0 | |||
|---|---|---|---|
| Quadrant | BADHDUFLAG | Total packets | Discarded packets |
| A | 0 | 94982 | 0 |
| B | 0 | 124389 | 0 |
| C | 0 | 98844 | 0 |
| D | 0 | 92036 | 0 |
| Mode SS | |||
|---|---|---|---|
| Quadrant | BADHDUFLAG | Total packets | Discarded packets |
| A | 0 | 458 | 0 |
| B | 0 | 458 | 0 |
| C | 0 | 458 | 0 |
| D | 0 | 458 | 0 |
| Mode M9 | |||
|---|---|---|---|
| Quadrant | BADHDUFLAG | Total packets | Discarded packets |
| A | 0 | 30 | 0 |
| B | 0 | 30 | 0 |
| C | 0 | 30 | 0 |
| D | 0 | 30 | 0 |
| Quadrant | Total seconds | Saturated seconds | Saturation percentage |
|---|---|---|---|
| A | 22599 | 78 | 0.345148% |
| B | 22599 | 2707 | 11.978406% |
| C | 22599 | 67 | 0.296473% |
| D | 22599 | 99 | 0.438072% |
Noise dominated data is calculated using 1-second bins in cleaned event files. If a bin has >2000 counts, and if more than 50% of those come from <1% of pixels, then it is considered to be noise-dominated and hence unusable.
| Quadrant | # 1 sec bins | Bins with >0 counts | Bins with >2000 counts | High rate bins dominated by noise | Noise dominated (total time) | Noise dominated (detector-on time) | Marked lightcurve |
|---|---|---|---|---|---|---|---|
| A | 25519 | 22599 | 0 | 0 | 0.00% | 0.00% |  |
| B | 25519 | 22475 | 0 | 0 | 0.00% | 0.00% |  |
| C | 25519 | 22598 | 0 | 0 | 0.00% | 0.00% |  |
| D | 25519 | 22599 | 0 | 0 | 0.00% | 0.00% |  |
Top three noisy pixels from each quadrant. If the there are fewer than three noisy pixels in the level2.evt file, extra rows are filled as -1
| Pixel properties | Quadrant properties | ||||||
|---|---|---|---|---|---|---|---|
| Quadrant | DetID | PixID | Counts | Sigma | Mean | Median | Sigma |
| A | 0 | 29 | 1018 | 11.81 | 272 | 255 | 64.6 |
| A | 7 | 110 | 961 | 10.92 | 272 | 255 | 64.6 |
| A | 0 | 30 | 770 | 7.97 | 272 | 255 | 64.6 |
| B | 2 | 9 | 813 | 11.66 | 254 | 241 | 49.0 |
| B | 5 | 128 | 654 | 8.42 | 254 | 241 | 49.0 |
| B | 14 | 254 | 649 | 8.32 | 254 | 241 | 49.0 |
| C | 12 | 241 | 715 | 6.76 | 271 | 249 | 69.0 |
| C | 2 | 191 | 697 | 6.5 | 271 | 249 | 69.0 |
| C | 9 | 242 | 659 | 5.94 | 271 | 249 | 69.0 |
| D | 11 | 82 | 634 | 6.5 | 254 | 233 | 61.7 |
| D | 1 | 3 | 632 | 6.47 | 254 | 233 | 61.7 |
| D | 6 | 44 | 632 | 6.47 | 254 | 233 | 61.7 |
Histogram calculated using DETX and DETY for each event in the final _common_clean file
| Quadrant A | 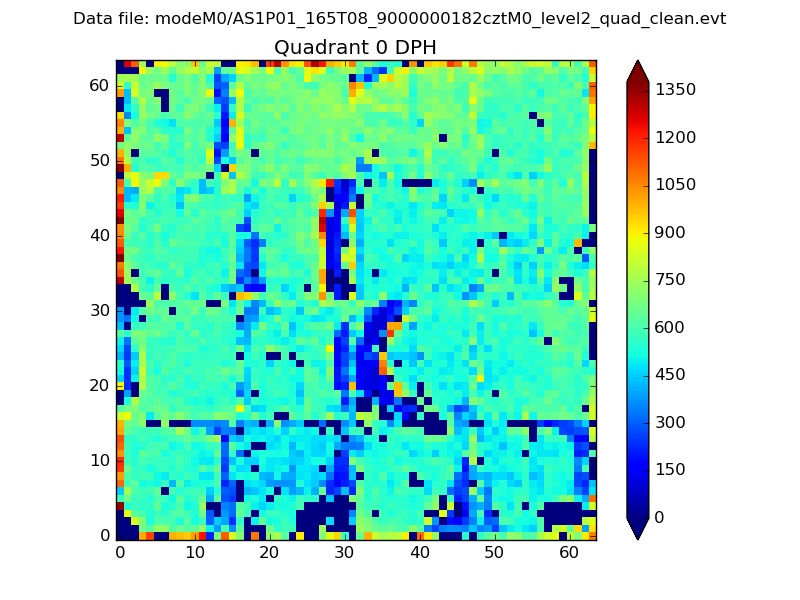 |
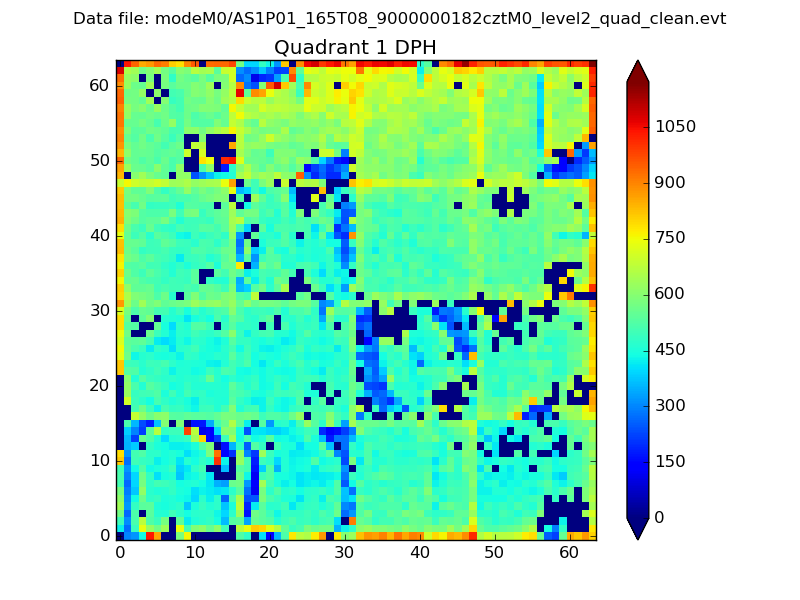 |
Quadrant B |
|---|---|---|---|
| Quadrant D | 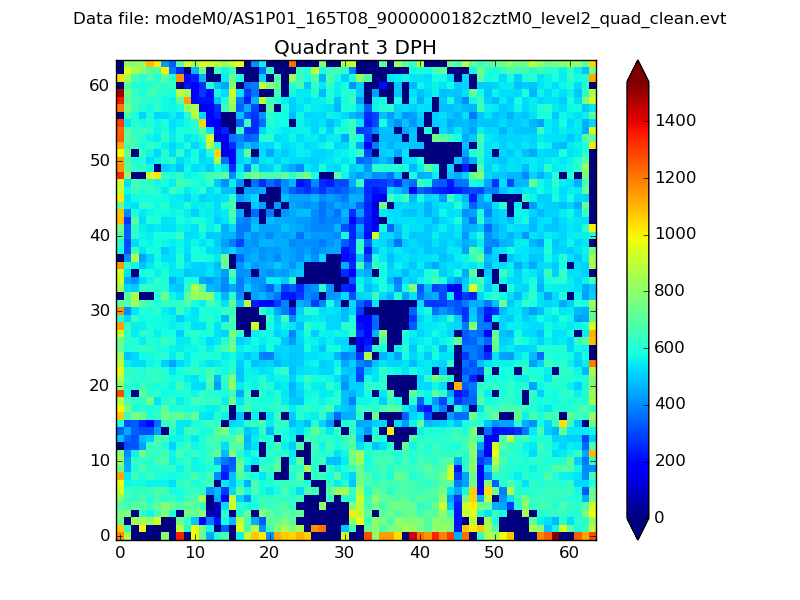 |
 |
Quadrant C |
| Plot type | Count rate plots | Images |
|---|---|---|
| Comparison with Poisson distribution Blue bars denote a histogram of data divided into 1 sec bins. Red curve is a Poisson curve with rate = median count rate of data. |
 |
 |
| Quadrant-wise count rates Data is divided into 100 sec bins |
 |
|
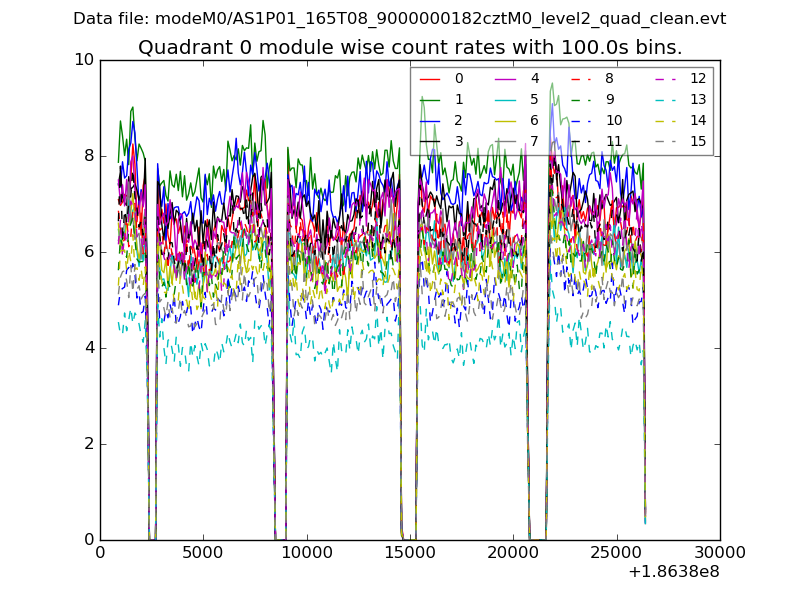
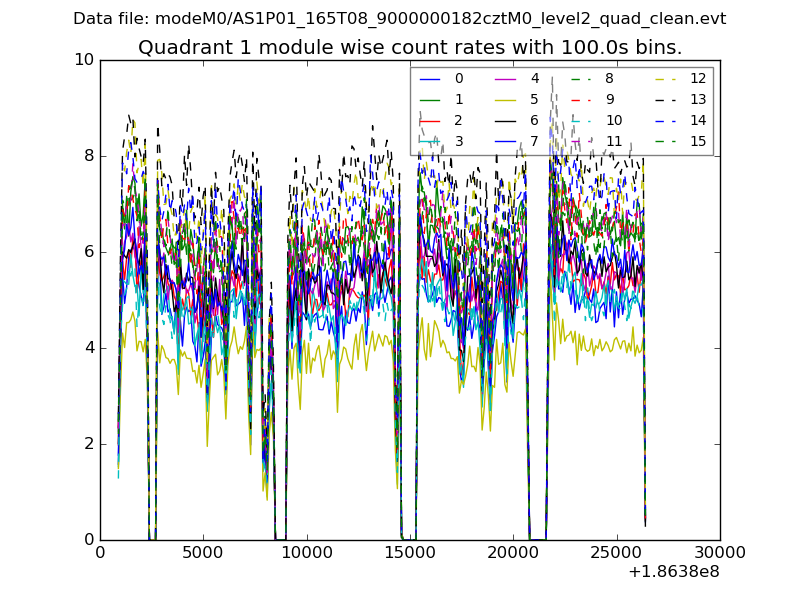
| Module-wise count rates for Quadrant A Data is divided into 100 sec bins |
 |
 |
| Module-wise count rates for Quadrant B Data is divided into 100 sec bins |
 |
 |
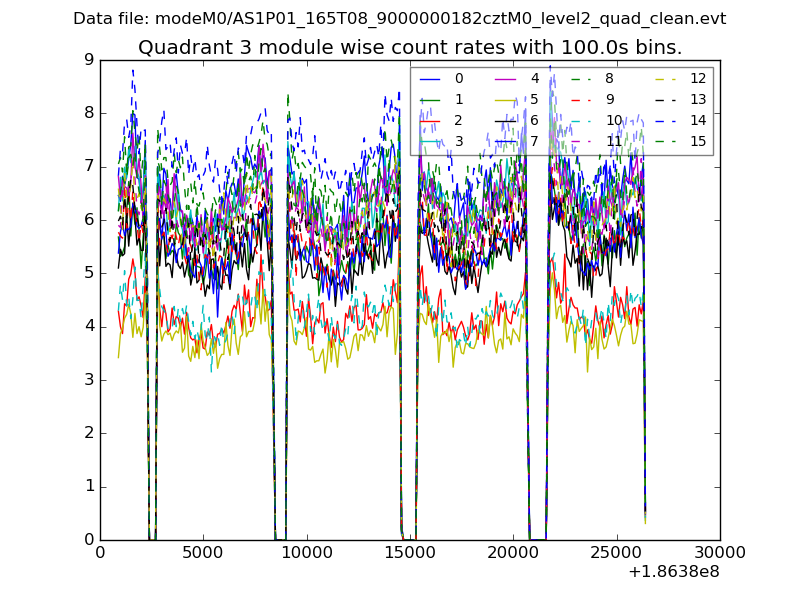
| Module-wise count rates for Quadrant C Data is divided into 100 sec bins |
 |
 |
| Module-wise count rates for Quadrant D Data is divided into 100 sec bins |
 |
 |
| Parameter | Plot |
|---|---|
| CZT HV Monitor | 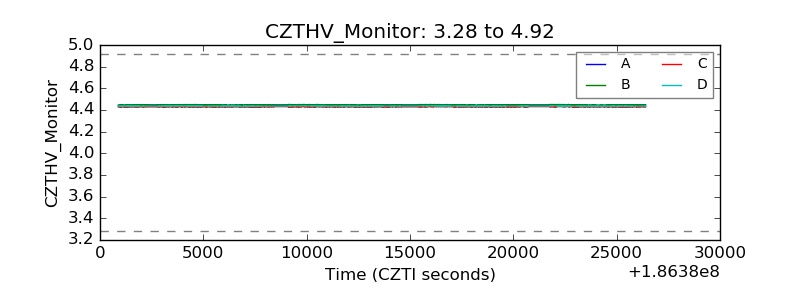 |
| D_VDD | 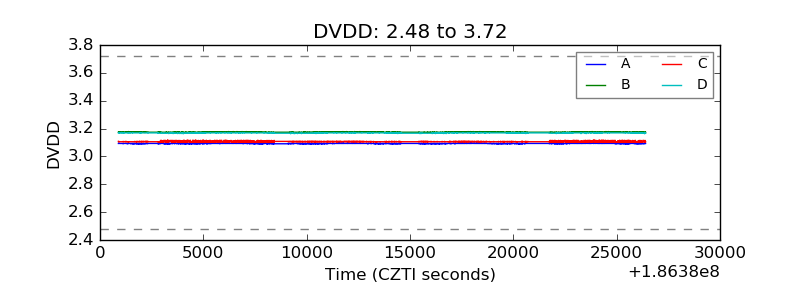 |
| Temperature 1 | 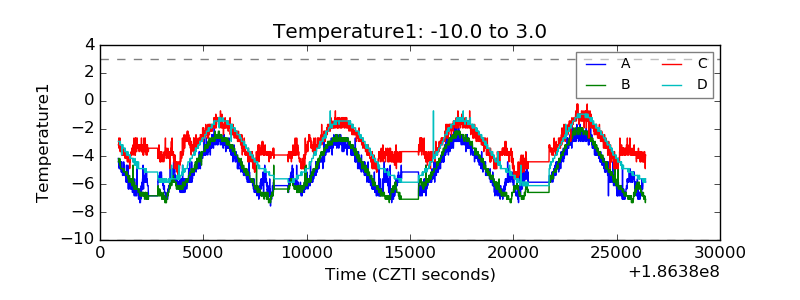 |
| Veto HV Monitor |  |
| Veto LLD | 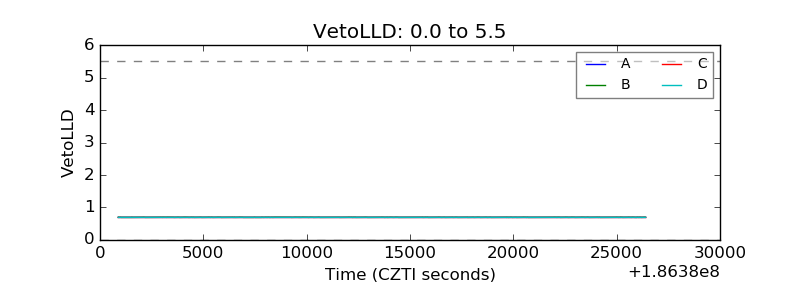 |
| Alpha Counter |  |
| _CPM_Rate |  |
| CZT Counter | 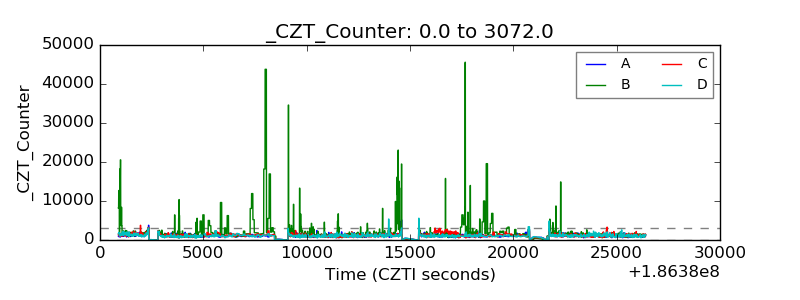 |
| +2.5 Volts monitor |  |
| +5 Volts monitor |  |
| _ROLL_ROT |  |
| _Roll_DEC |  |
| _Roll_RA |  |
| Veto Counter | 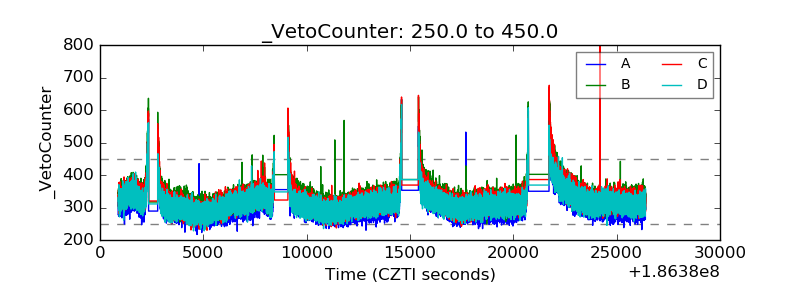 |