| Param | Original file | Final file |
|---|---|---|
| Filename | modeM0/AS1P01_165T08_9000000182_00905cztM0_level2.evt | modeM0/AS1P01_165T08_9000000182_00905cztM0_level2_quad_clean.evt |
| Size (bytes) | 1,144,958,400 | 94,219,200 |
| Size | 1.1 GB | 89.9 MB |
| Events in quadrant A | 7,726,684 | 632,779 |
| Events in quadrant B | 11,801,883 | 546,020 |
| Events in quadrant C | 7,539,433 | 615,447 |
| Events in quadrant D | 7,171,654 | 600,013 |
| Mode M0 | |||
|---|---|---|---|
| Quadrant | BADHDUFLAG | Total packets | Discarded packets |
| A | 0 | 27647 | 0 |
| B | 0 | 39910 | 0 |
| C | 0 | 27073 | 0 |
| D | 0 | 26006 | 0 |
| Mode SS | |||
|---|---|---|---|
| Quadrant | BADHDUFLAG | Total packets | Discarded packets |
| A | 0 | 132 | 0 |
| B | 0 | 132 | 0 |
| C | 0 | 132 | 0 |
| D | 0 | 132 | 0 |
| Mode M9 | |||
|---|---|---|---|
| Quadrant | BADHDUFLAG | Total packets | Discarded packets |
| A | 0 | 7 | 0 |
| B | 0 | 7 | 0 |
| C | 0 | 7 | 0 |
| D | 0 | 7 | 0 |
| Quadrant | Total seconds | Saturated seconds | Saturation percentage |
|---|---|---|---|
| A | 6581 | 5 | 0.075976% |
| B | 6580 | 1341 | 20.379939% |
| C | 6580 | 4 | 0.060790% |
| D | 6580 | 12 | 0.182371% |
Noise dominated data is calculated using 1-second bins in cleaned event files. If a bin has >2000 counts, and if more than 50% of those come from <1% of pixels, then it is considered to be noise-dominated and hence unusable.
| Quadrant | # 1 sec bins | Bins with >0 counts | Bins with >2000 counts | High rate bins dominated by noise | Noise dominated (total time) | Noise dominated (detector-on time) | Marked lightcurve |
|---|---|---|---|---|---|---|---|
| A | 7241 | 6582 | 153 | 153 | 2.11% | 2.32% | 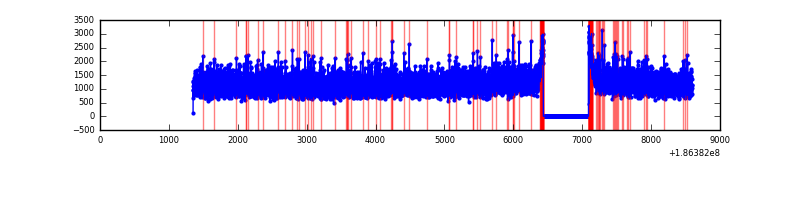 |
| B | 7240 | 6581 | 1980 | 1980 | 27.35% | 30.09% | 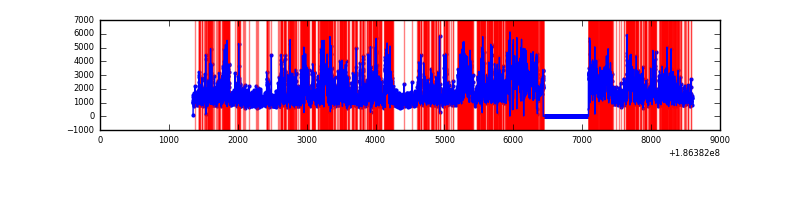 |
| C | 7240 | 6581 | 113 | 113 | 1.56% | 1.72% | 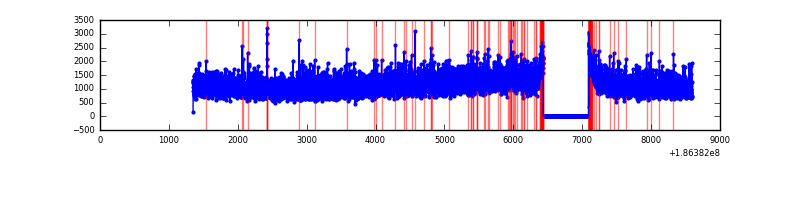 |
| D | 7240 | 6581 | 88 | 88 | 1.22% | 1.34% | 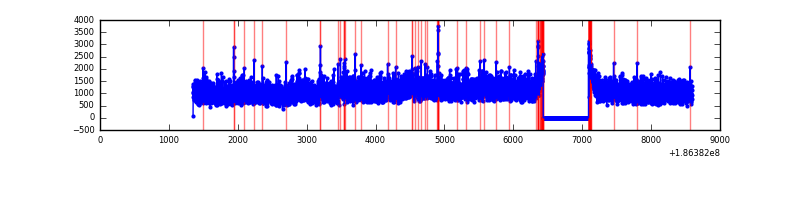 |
Top three noisy pixels from each quadrant. If the there are fewer than three noisy pixels in the level2.evt file, extra rows are filled as -1
| Pixel properties | Quadrant properties | ||||||
|---|---|---|---|---|---|---|---|
| Quadrant | DetID | PixID | Counts | Sigma | Mean | Median | Sigma |
| A | 15 | 127 | 19491 | 36.13 | 2008 | 2023 | 483.5 |
| A | 11 | 79 | 9951 | 16.4 | 2008 | 2023 | 483.5 |
| A | 3 | 111 | 6851 | 9.99 | 2008 | 2023 | 483.5 |
| B | 3 | 0 | 4480969 | 10195.16 | 1854 | 1863 | 439.3 |
| B | 5 | 191 | 142432 | 319.96 | 1854 | 1863 | 439.3 |
| B | 5 | 249 | 52907 | 116.18 | 1854 | 1863 | 439.3 |
| C | 9 | 83 | 160536 | 306.04 | 1856 | 1914 | 518.3 |
| C | 15 | 241 | 63611 | 119.04 | 1856 | 1914 | 518.3 |
| C | 3 | 111 | 27935 | 50.2 | 1856 | 1914 | 518.3 |
| D | 12 | 188 | 249115 | 438.55 | 1813 | 1876 | 563.8 |
| D | 2 | 16 | 45419 | 77.24 | 1813 | 1876 | 563.8 |
| D | 10 | 157 | 23896 | 39.06 | 1813 | 1876 | 563.8 |
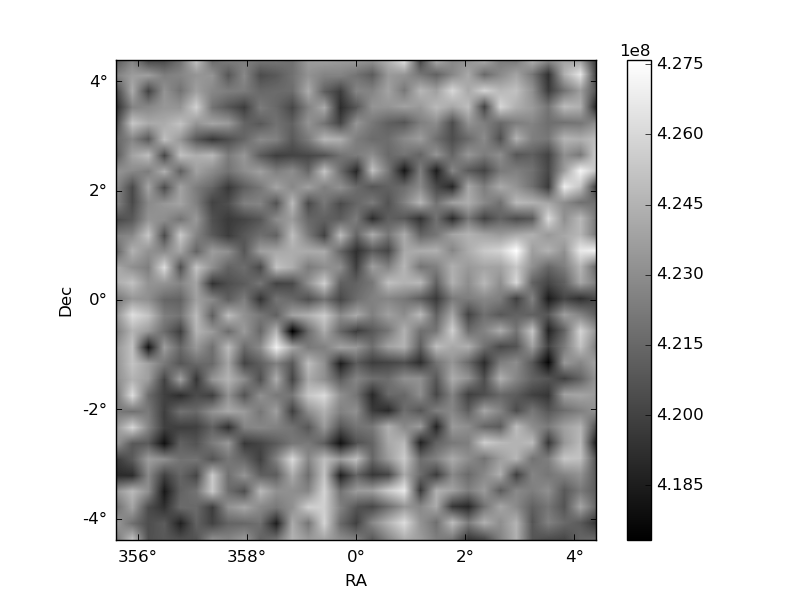
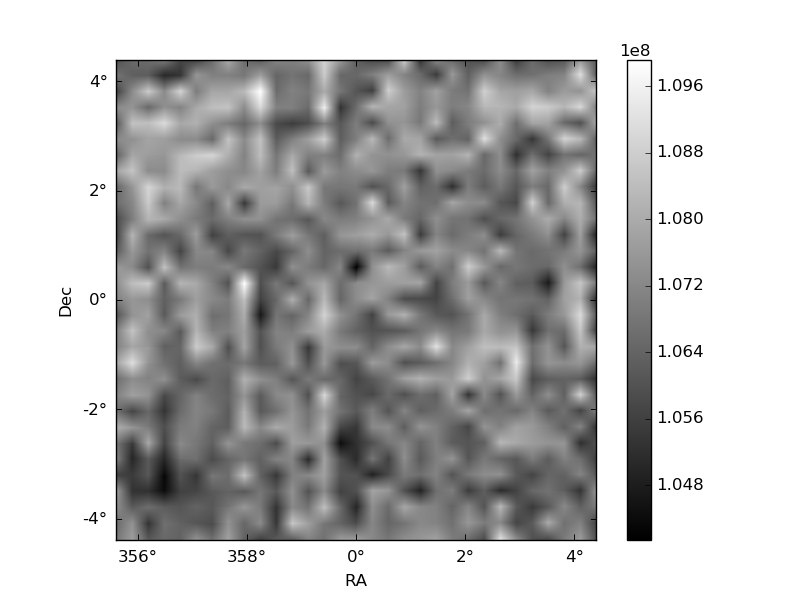
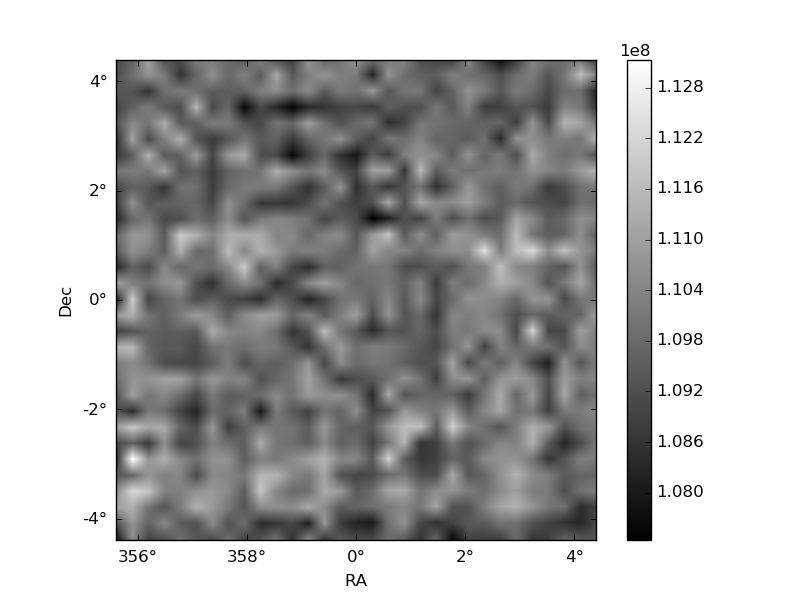
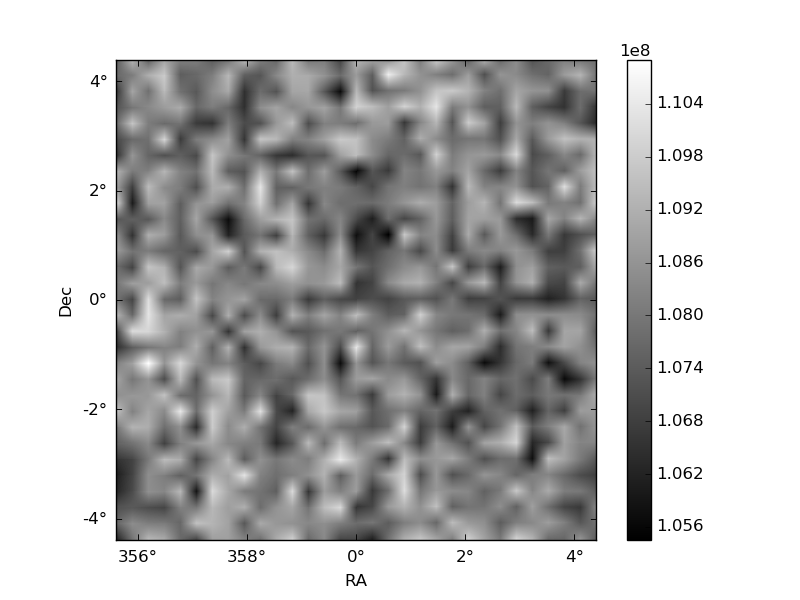
Histogram calculated using DETX and DETY for each event in the final _common_clean file
| Quadrant A | 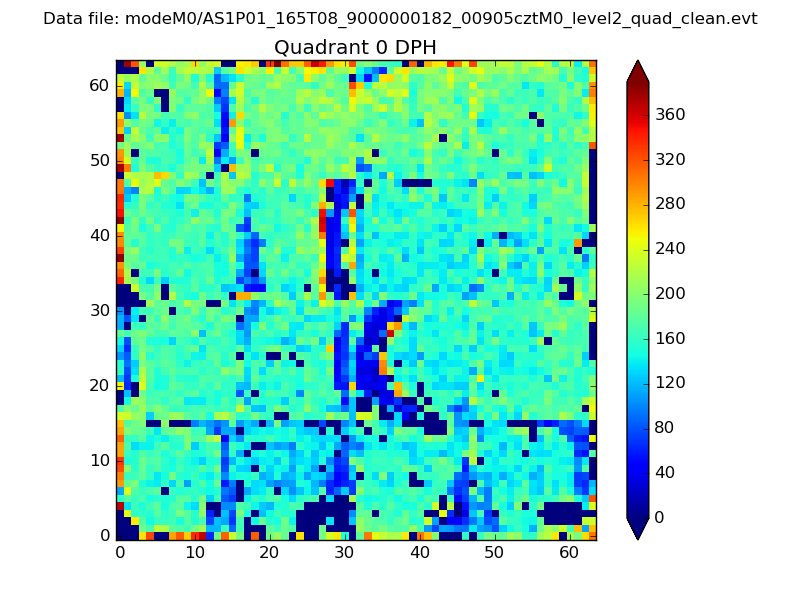 |
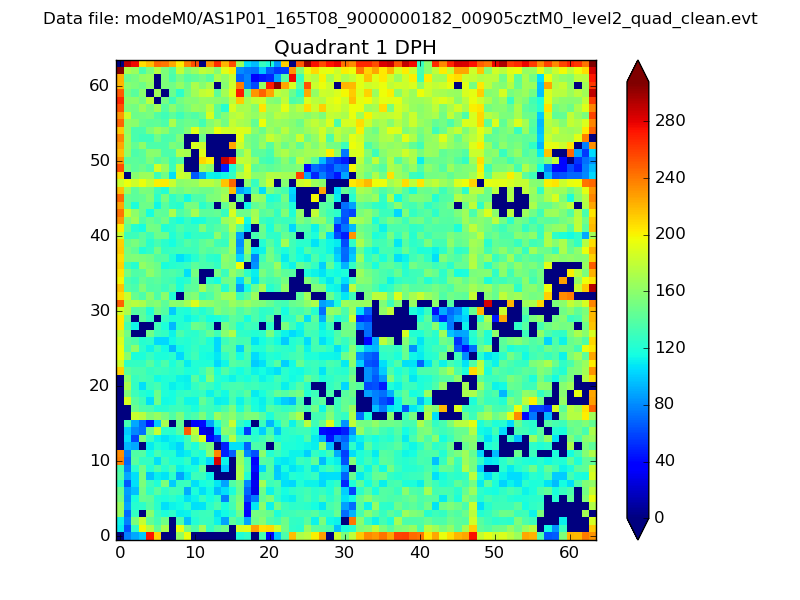 |
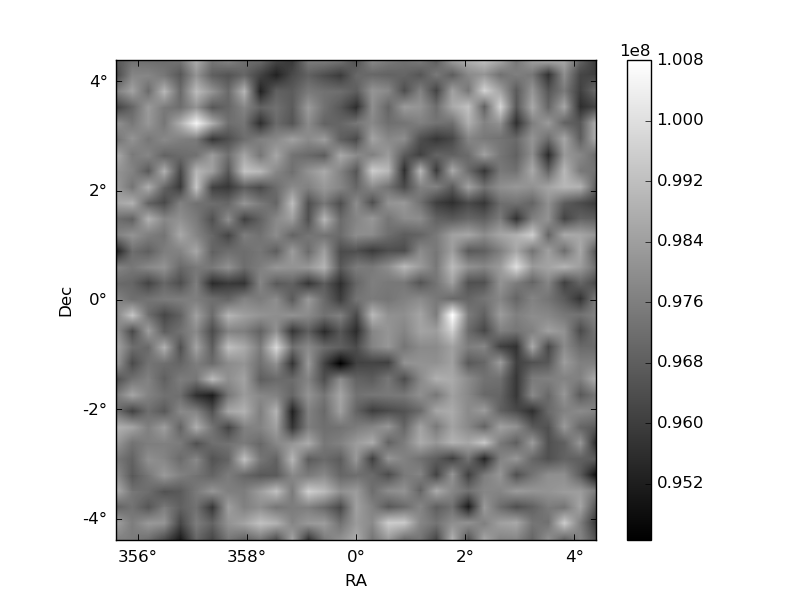
Quadrant B |
|---|---|---|---|
| Quadrant D | 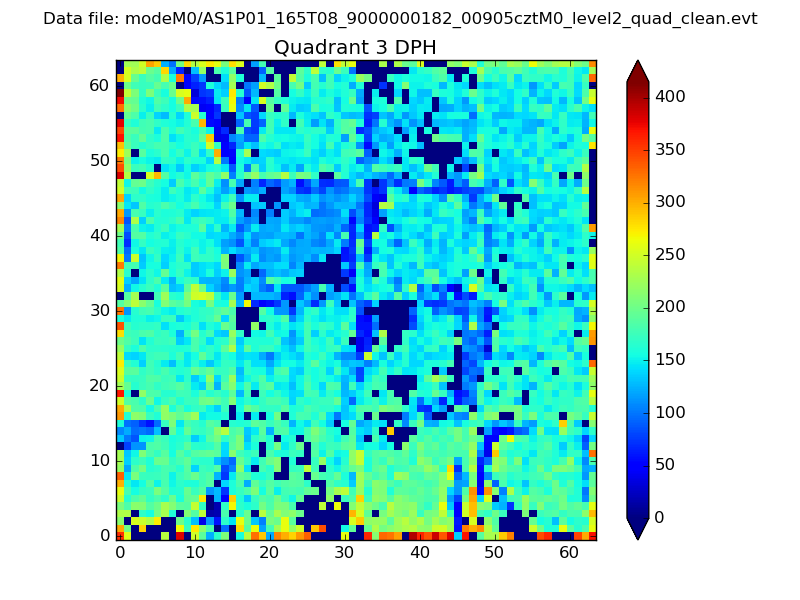 |
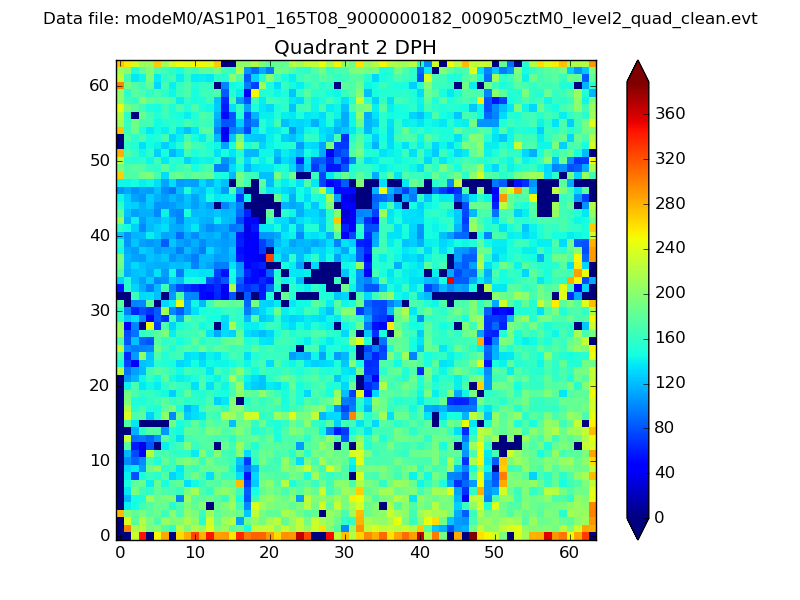 |
Quadrant C |
| Plot type | Count rate plots | Images |
|---|---|---|
| Comparison with Poisson distribution Blue bars denote a histogram of data divided into 1 sec bins. Red curve is a Poisson curve with rate = median count rate of data. |
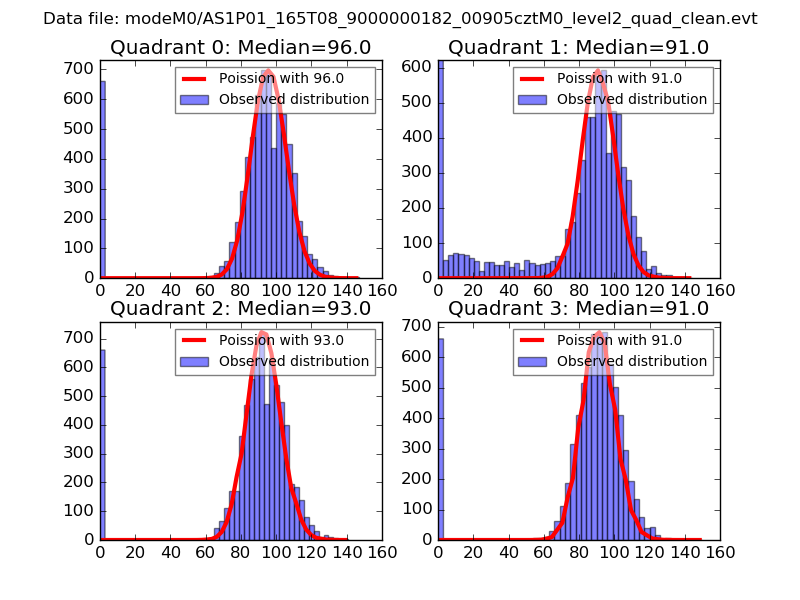 |
 |
| Quadrant-wise count rates Data is divided into 100 sec bins |
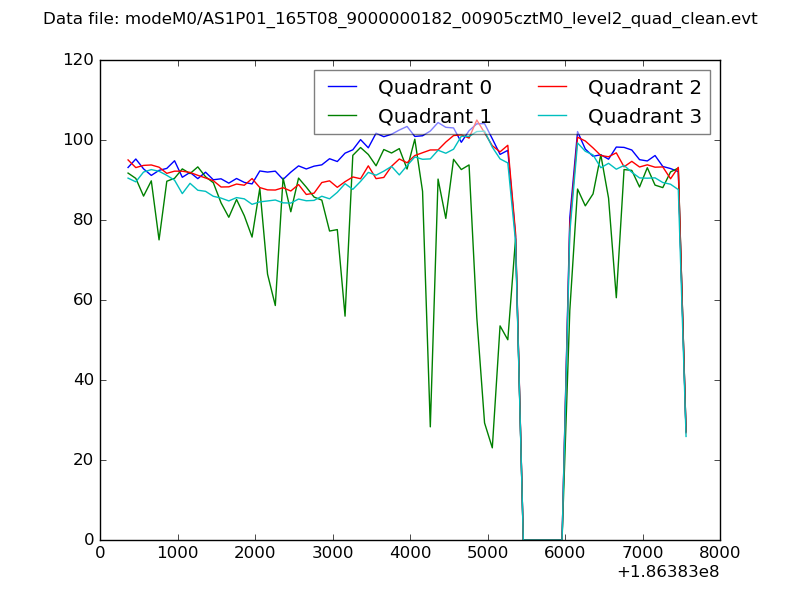 |
|
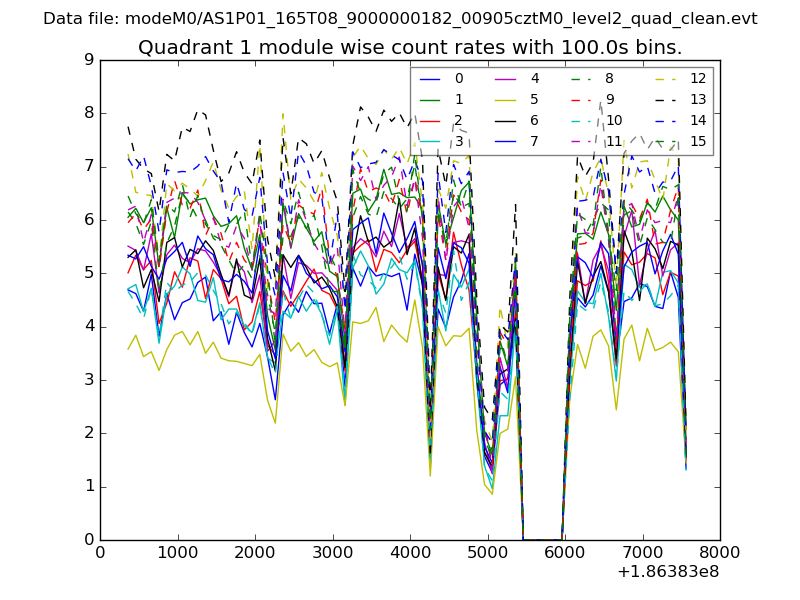
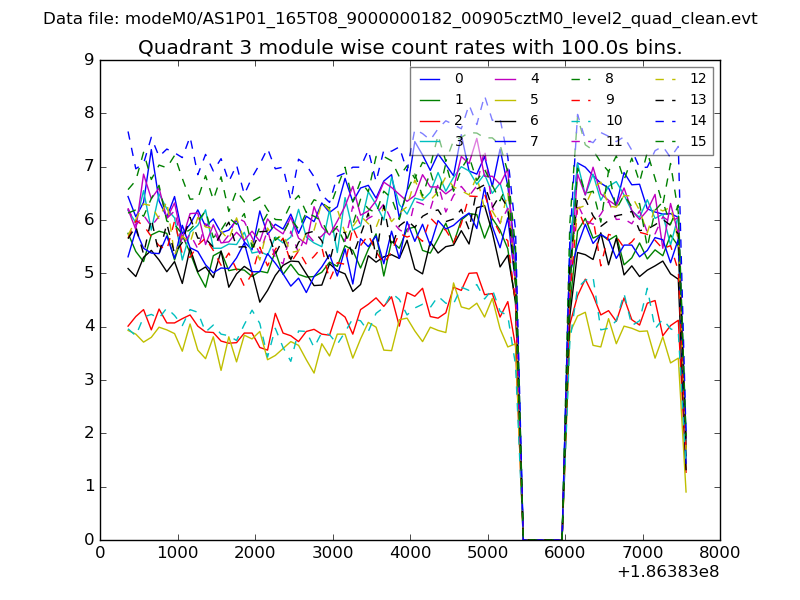
| Module-wise count rates for Quadrant A Data is divided into 100 sec bins |
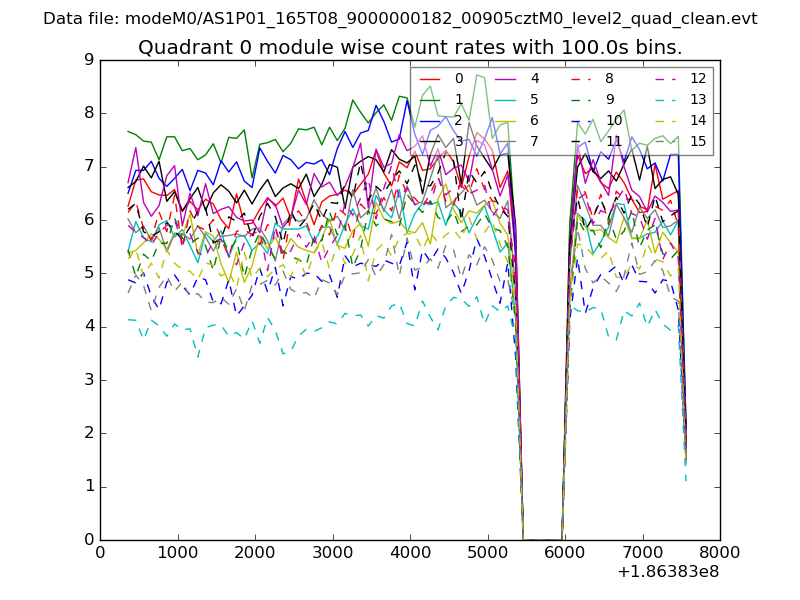 |
 |
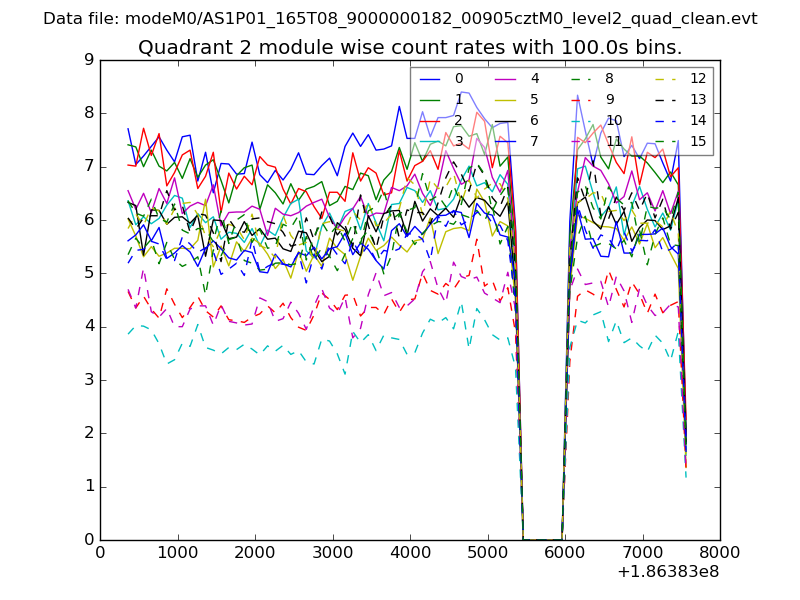
| Module-wise count rates for Quadrant B Data is divided into 100 sec bins |
 |
 |
| Module-wise count rates for Quadrant C Data is divided into 100 sec bins |
 |
 |
| Module-wise count rates for Quadrant D Data is divided into 100 sec bins |
 |
 |
| Parameter | Plot |
|---|---|
| CZT HV Monitor | 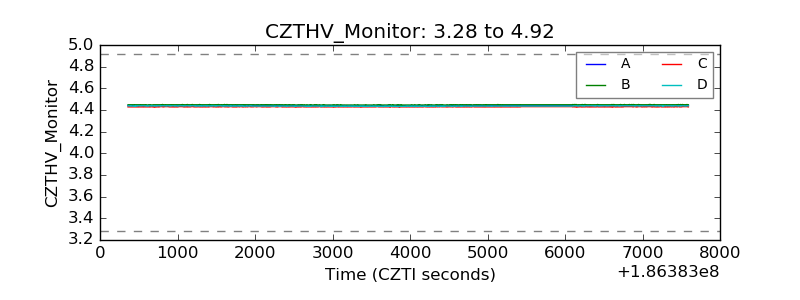 |
| D_VDD | 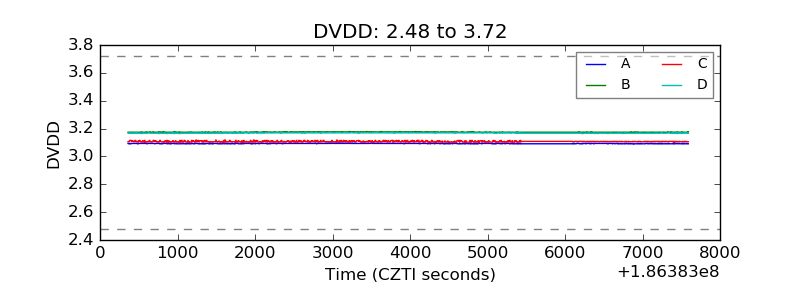 |
| Temperature 1 | 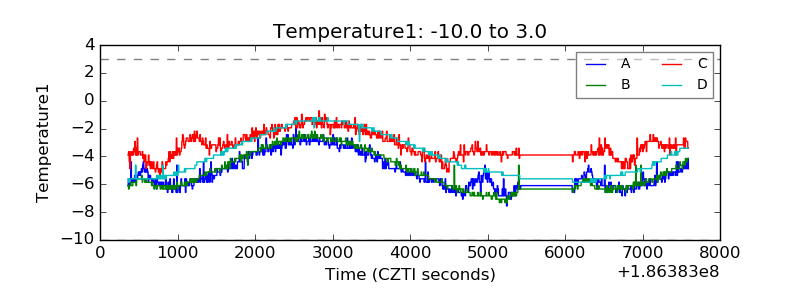 |
| Veto HV Monitor | 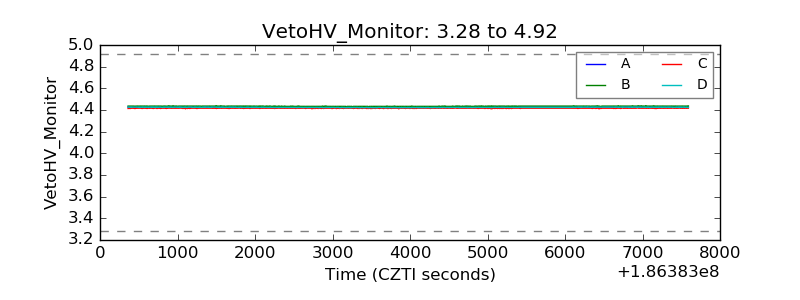 |
| Veto LLD | 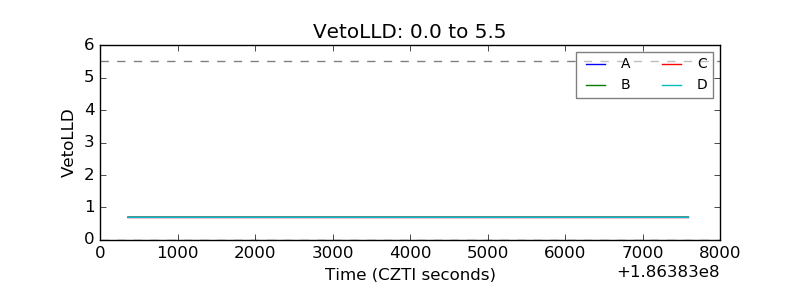 |
| Alpha Counter | 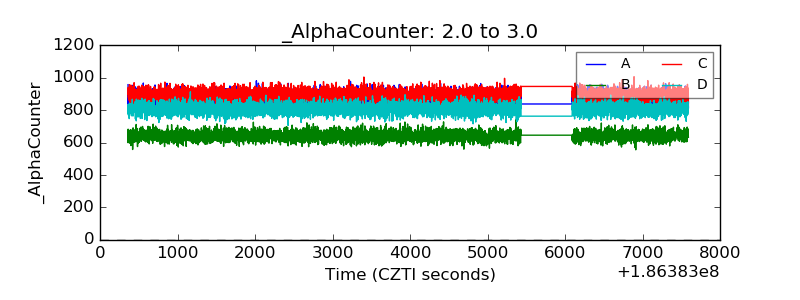 |
| _CPM_Rate | 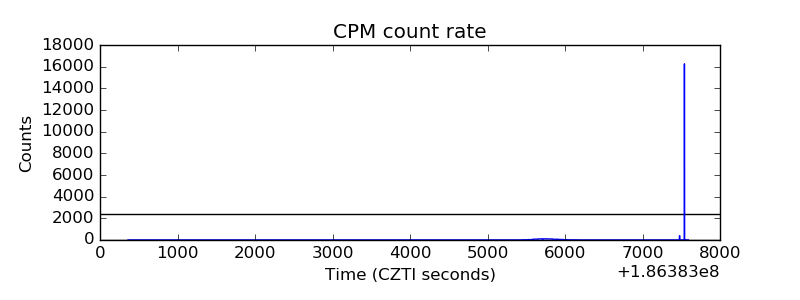 |
| CZT Counter | 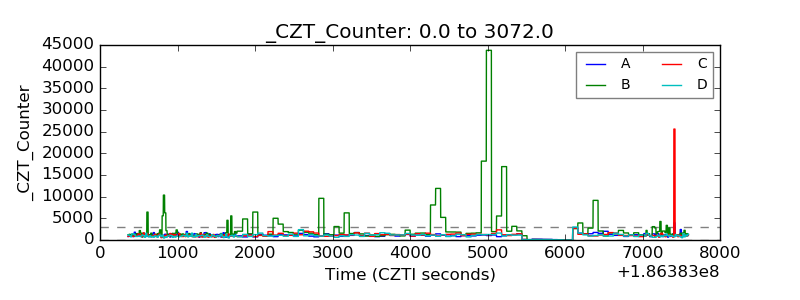 |
| +2.5 Volts monitor |  |
| +5 Volts monitor |  |
| _ROLL_ROT | 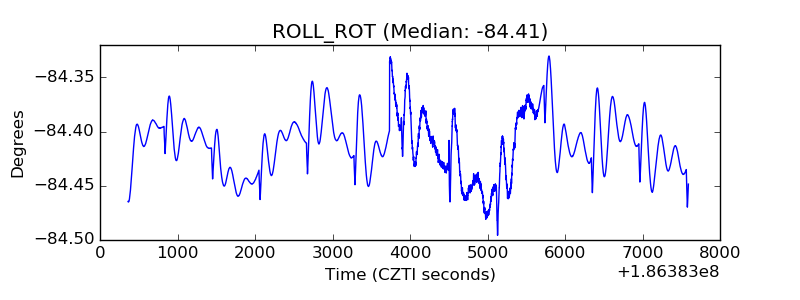 |
| _Roll_DEC | 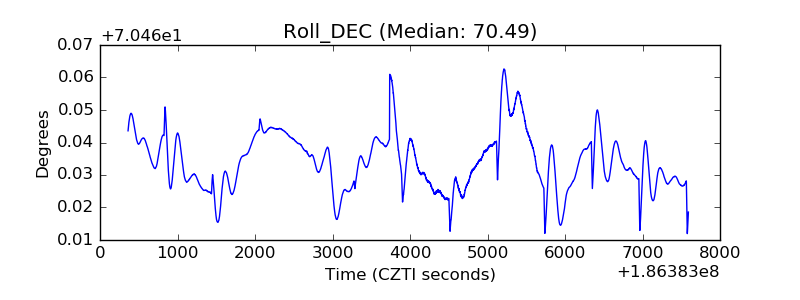 |
| _Roll_RA | 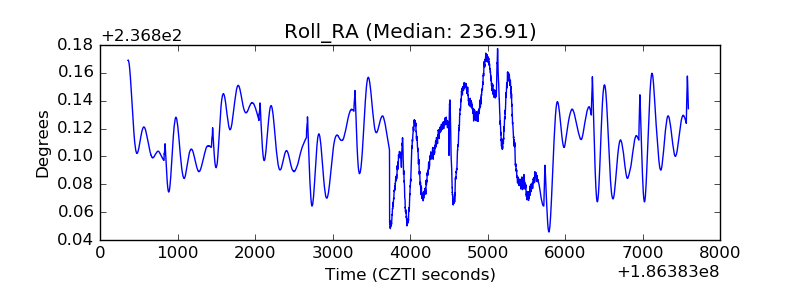 |
| Veto Counter | 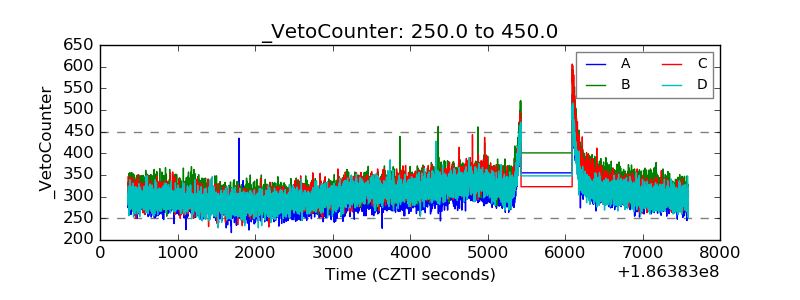 |