| Param | Original file | Final file |
|---|---|---|
| Filename | modeM0/AS1P01_165T08_9000000182_00906cztM0_level2.evt | modeM0/AS1P01_165T08_9000000182_00906cztM0_level2_quad_clean.evt |
| Size (bytes) | 1,086,609,600 | 93,905,280 |
| Size | 1.0 GB | 89.6 MB |
| Events in quadrant A | 7,556,531 | 623,903 |
| Events in quadrant B | 9,795,786 | 589,443 |
| Events in quadrant C | 8,086,605 | 598,221 |
| Events in quadrant D | 7,045,376 | 585,753 |
| Mode M0 | |||
|---|---|---|---|
| Quadrant | BADHDUFLAG | Total packets | Discarded packets |
| A | 0 | 26980 | 0 |
| B | 0 | 33686 | 0 |
| C | 0 | 28546 | 0 |
| D | 0 | 25498 | 0 |
| Mode SS | |||
|---|---|---|---|
| Quadrant | BADHDUFLAG | Total packets | Discarded packets |
| A | 0 | 130 | 0 |
| B | 0 | 130 | 0 |
| C | 0 | 130 | 0 |
| D | 0 | 130 | 0 |
| Mode M9 | |||
|---|---|---|---|
| Quadrant | BADHDUFLAG | Total packets | Discarded packets |
| A | 0 | 8 | 0 |
| B | 0 | 8 | 0 |
| C | 0 | 8 | 0 |
| D | 0 | 8 | 0 |
| Quadrant | Total seconds | Saturated seconds | Saturation percentage |
|---|---|---|---|
| A | 6396 | 29 | 0.453408% |
| B | 6397 | 541 | 8.457089% |
| C | 6397 | 24 | 0.375176% |
| D | 6397 | 38 | 0.594028% |
Noise dominated data is calculated using 1-second bins in cleaned event files. If a bin has >2000 counts, and if more than 50% of those come from <1% of pixels, then it is considered to be noise-dominated and hence unusable.
| Quadrant | # 1 sec bins | Bins with >0 counts | Bins with >2000 counts | High rate bins dominated by noise | Noise dominated (total time) | Noise dominated (detector-on time) | Marked lightcurve |
|---|---|---|---|---|---|---|---|
| A | 7211 | 6397 | 167 | 167 | 2.32% | 2.61% | 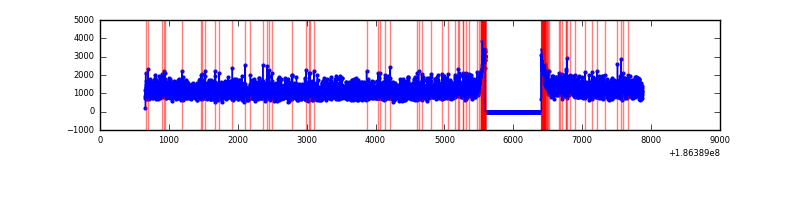 |
| B | 7212 | 6398 | 1065 | 1065 | 14.77% | 16.65% | 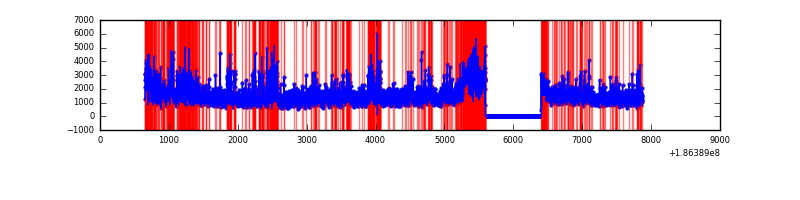 |
| C | 7212 | 6398 | 584 | 584 | 8.10% | 9.13% | 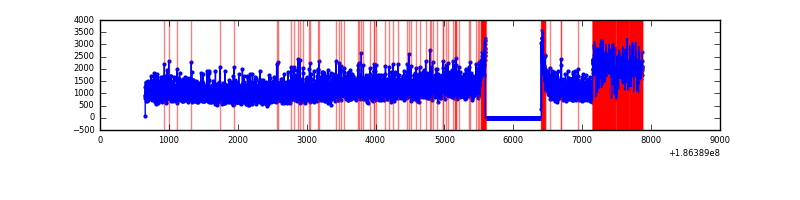 |
| D | 7212 | 6398 | 133 | 133 | 1.84% | 2.08% |  |
Top three noisy pixels from each quadrant. If the there are fewer than three noisy pixels in the level2.evt file, extra rows are filled as -1
| Pixel properties | Quadrant properties | ||||||
|---|---|---|---|---|---|---|---|
| Quadrant | DetID | PixID | Counts | Sigma | Mean | Median | Sigma |
| A | 15 | 127 | 22707 | 43.89 | 1962 | 1973 | 472.4 |
| A | 11 | 79 | 9811 | 16.59 | 1962 | 1973 | 472.4 |
| A | 3 | 111 | 6247 | 9.05 | 1962 | 1973 | 472.4 |
| B | 3 | 0 | 2087212 | 4560.4 | 1939 | 1949 | 457.3 |
| B | 5 | 249 | 96533 | 206.85 | 1939 | 1949 | 457.3 |
| B | 5 | 200 | 59995 | 126.94 | 1939 | 1949 | 457.3 |
| C | 9 | 83 | 884214 | 1740.02 | 1818 | 1878 | 507.1 |
| C | 15 | 241 | 49428 | 93.77 | 1818 | 1878 | 507.1 |
| C | 3 | 111 | 23029 | 41.71 | 1818 | 1878 | 507.1 |
| D | 12 | 188 | 219915 | 394.28 | 1776 | 1840 | 553.1 |
| D | 2 | 16 | 76087 | 134.24 | 1776 | 1840 | 553.1 |
| D | 1 | 4 | 41093 | 70.97 | 1776 | 1840 | 553.1 |
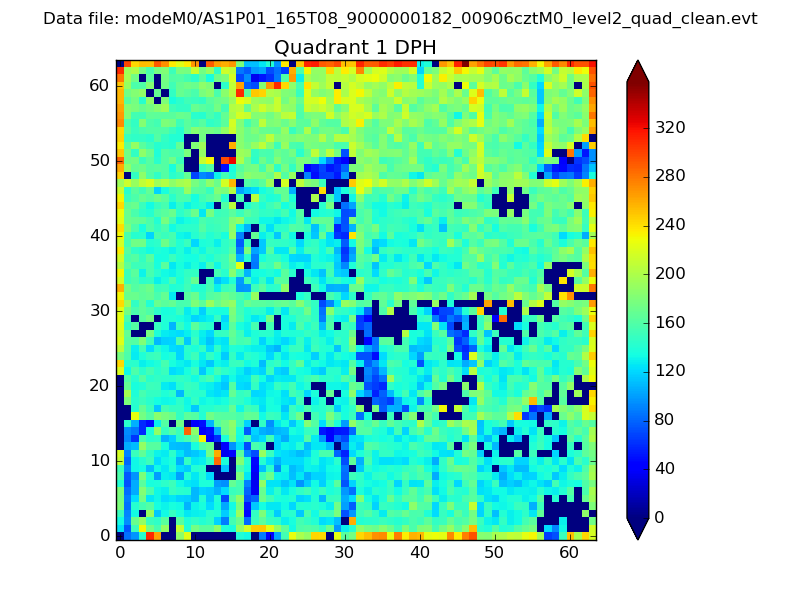
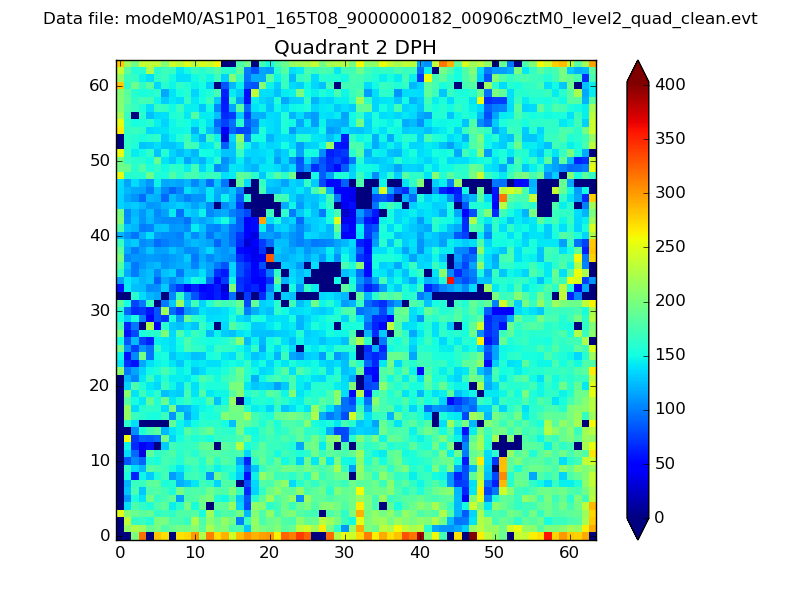
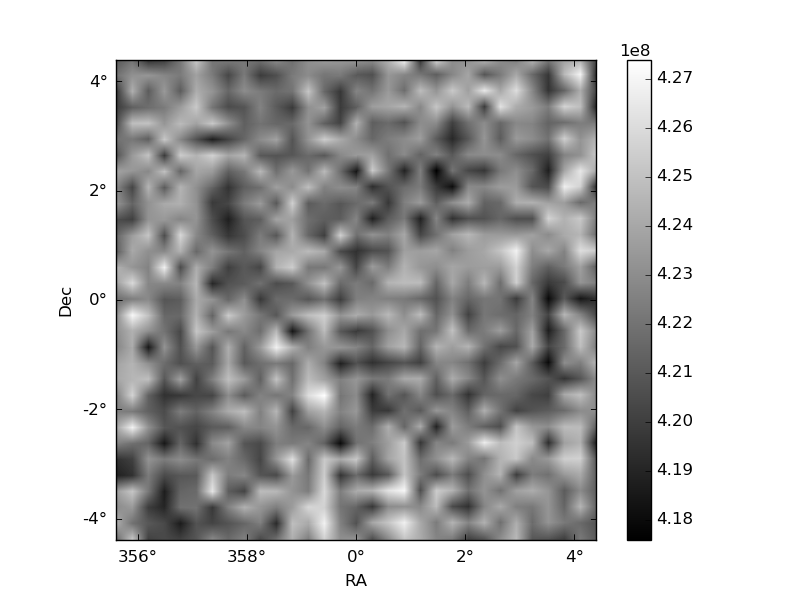
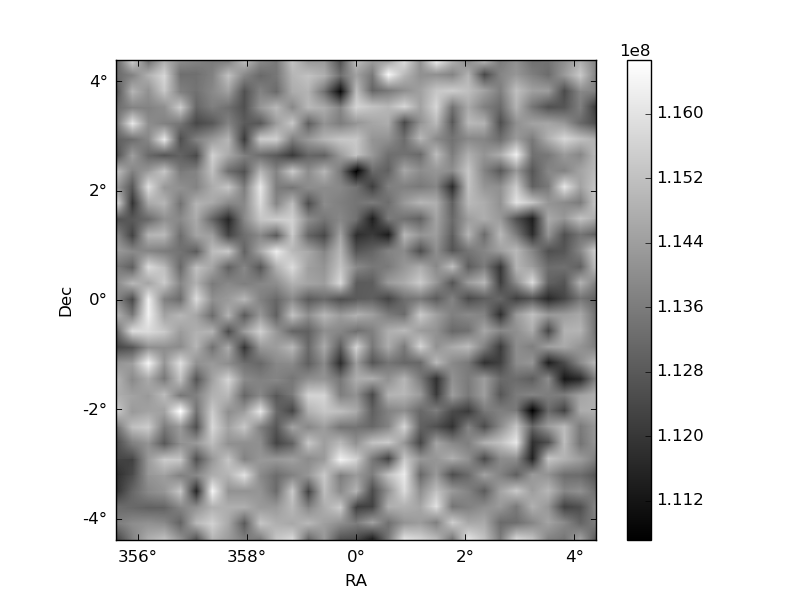
Histogram calculated using DETX and DETY for each event in the final _common_clean file
| Quadrant A | 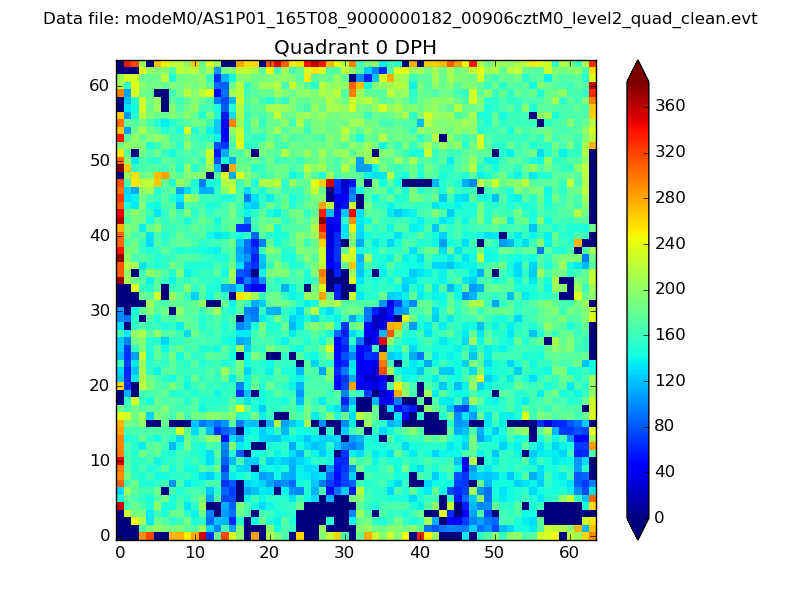 |
 |
Quadrant B |
|---|---|---|---|
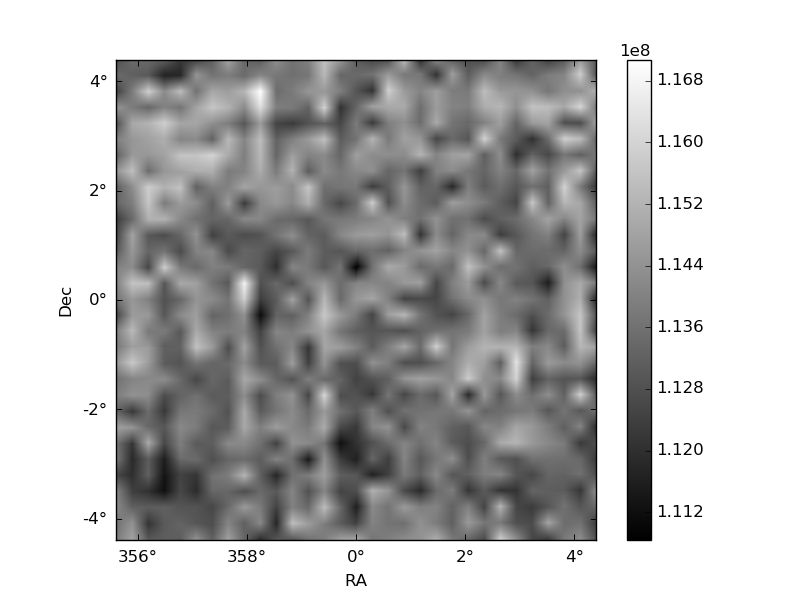
| Quadrant D | 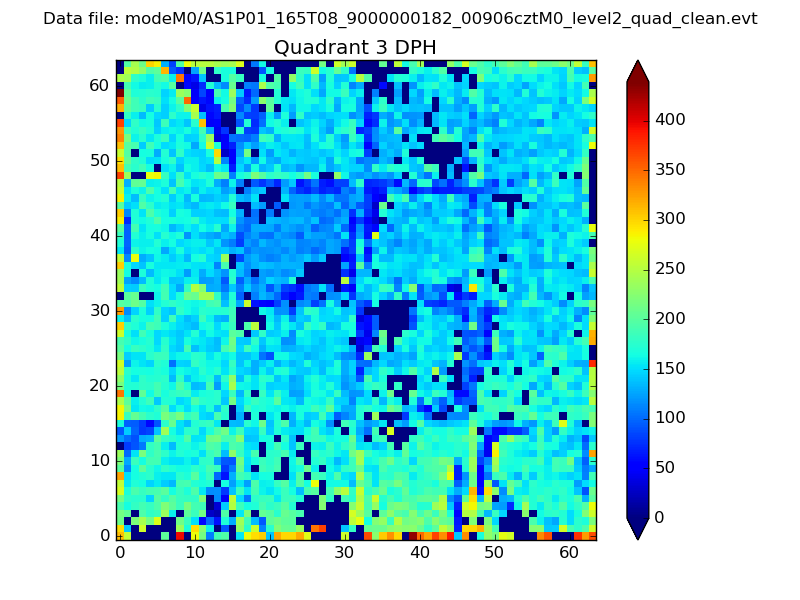 |
 |
Quadrant C |
| Plot type | Count rate plots | Images |
|---|---|---|
| Comparison with Poisson distribution Blue bars denote a histogram of data divided into 1 sec bins. Red curve is a Poisson curve with rate = median count rate of data. |
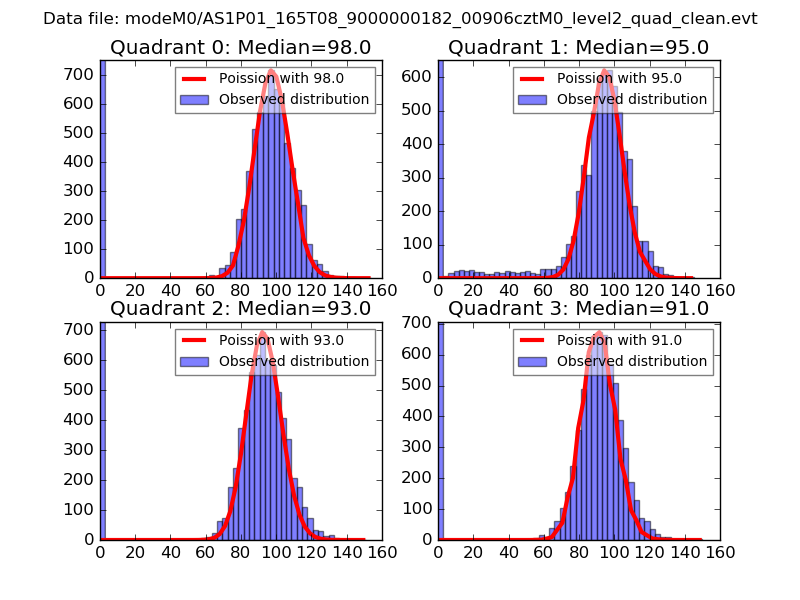 |
 |
| Quadrant-wise count rates Data is divided into 100 sec bins |
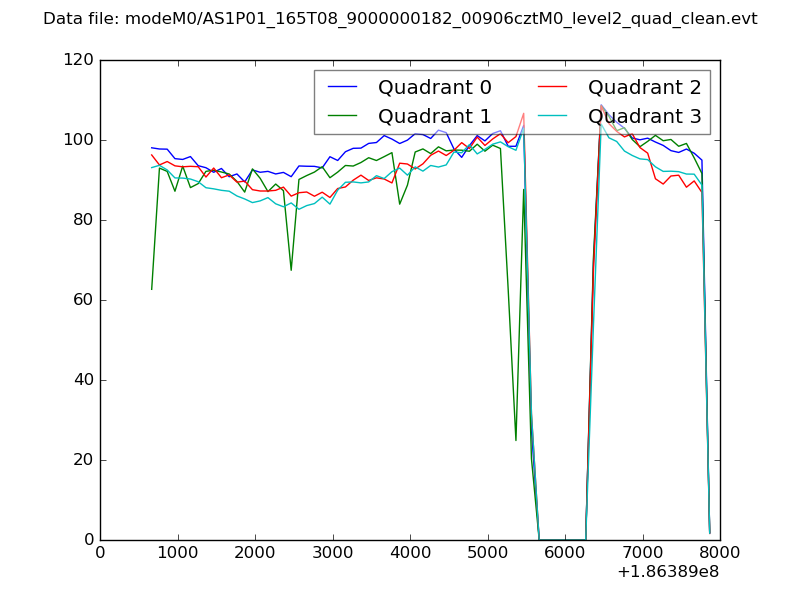 |
|
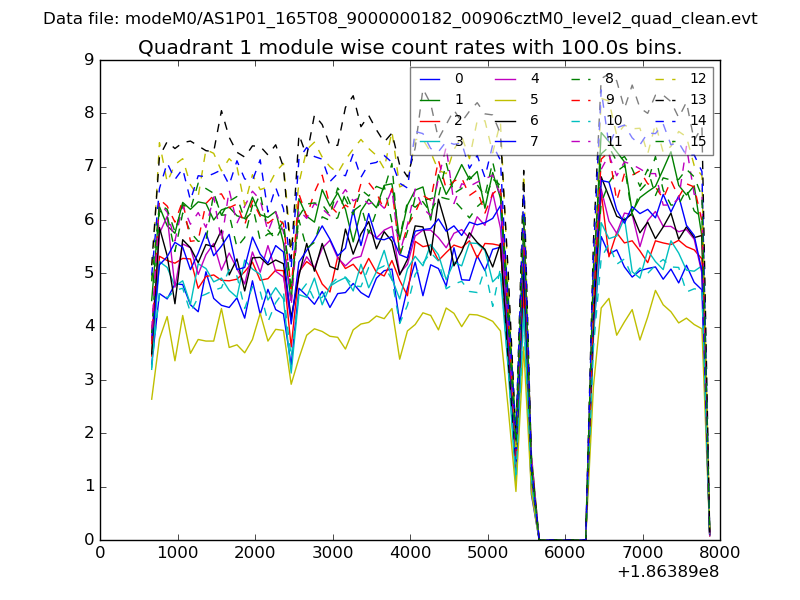
| Module-wise count rates for Quadrant A Data is divided into 100 sec bins |
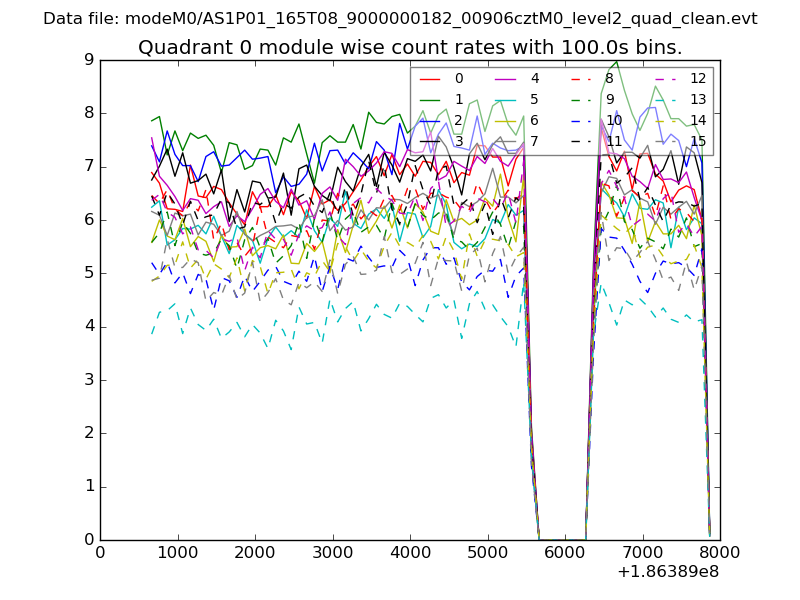 |
 |
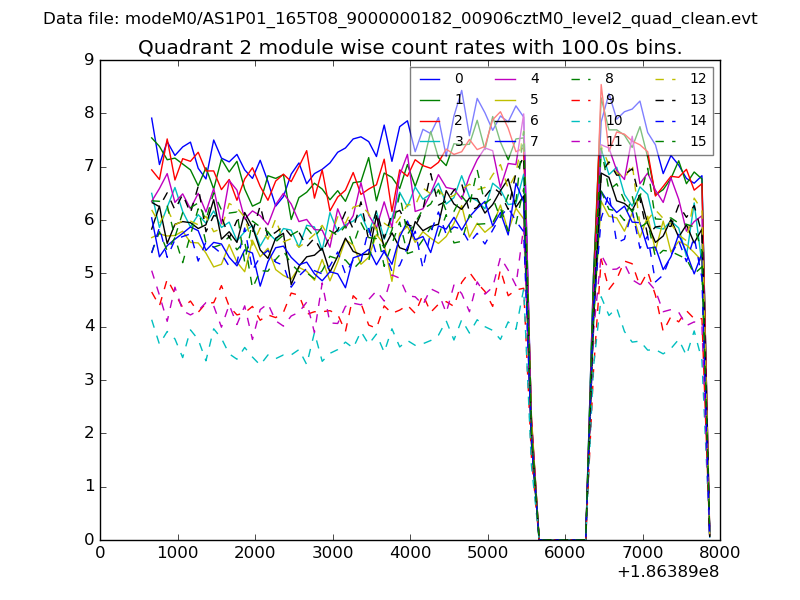
| Module-wise count rates for Quadrant B Data is divided into 100 sec bins |
 |
 |
| Module-wise count rates for Quadrant C Data is divided into 100 sec bins |
 |
 |
| Module-wise count rates for Quadrant D Data is divided into 100 sec bins |
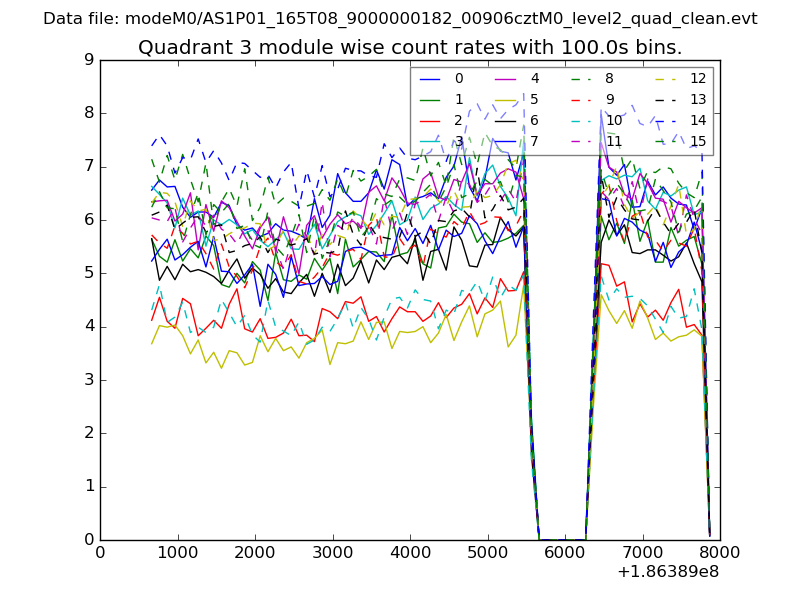 |
 |
| Parameter | Plot |
|---|---|
| CZT HV Monitor | 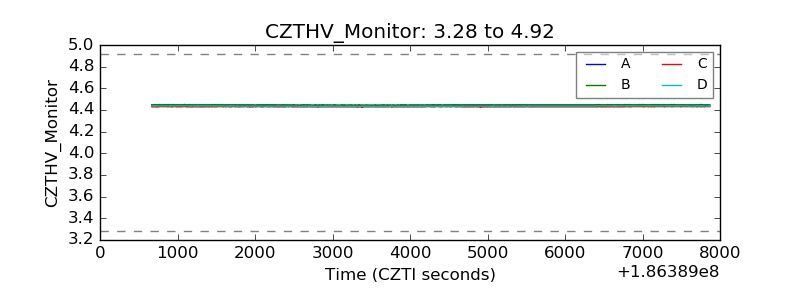 |
| D_VDD | 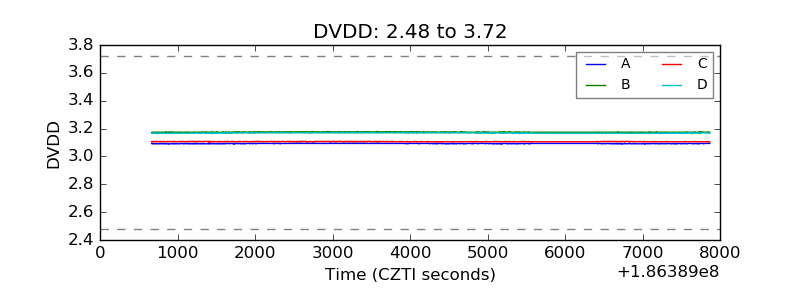 |
| Temperature 1 | 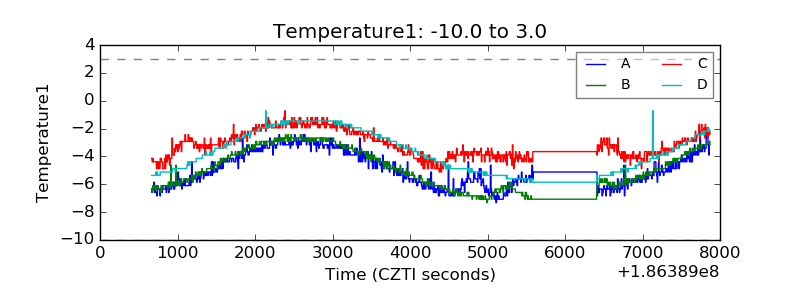 |
| Veto HV Monitor | 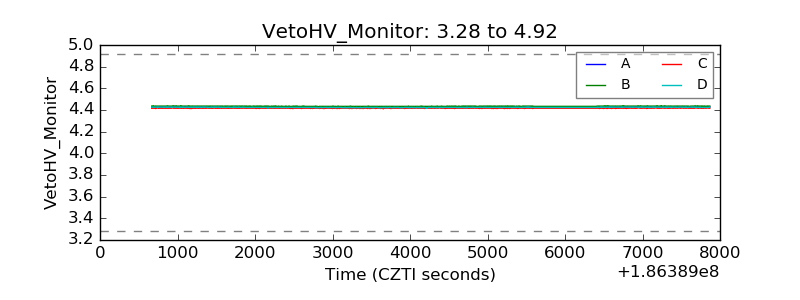 |
| Veto LLD | 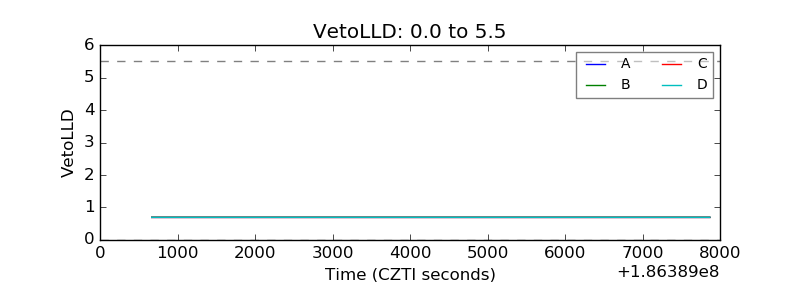 |
| Alpha Counter | 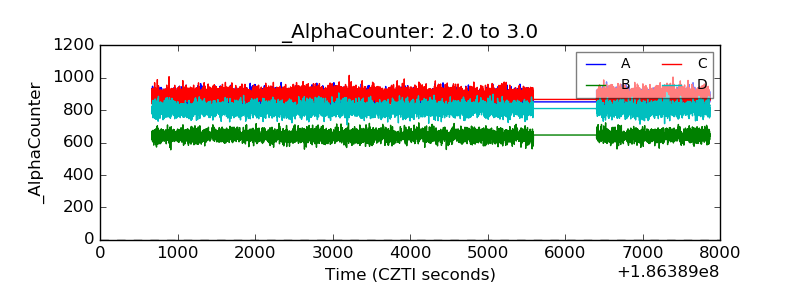 |
| _CPM_Rate | 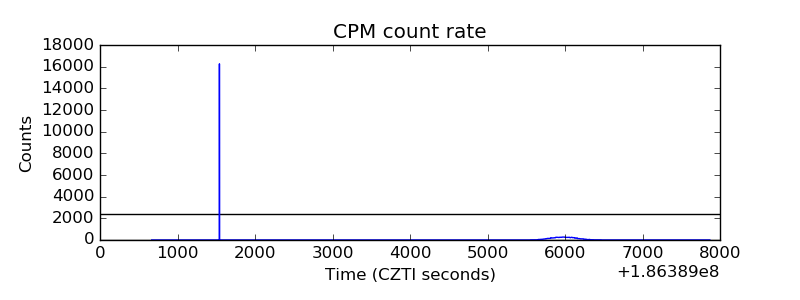 |
| CZT Counter | 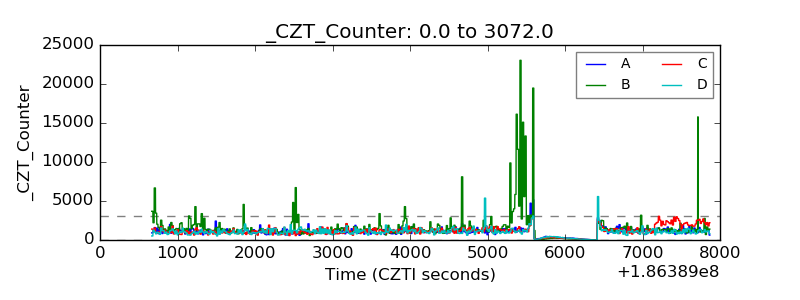 |
| +2.5 Volts monitor | 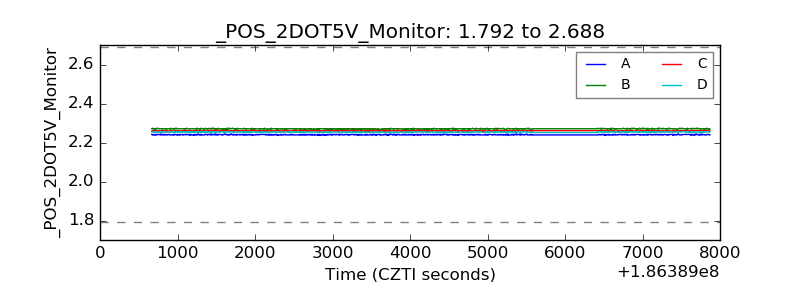 |
| +5 Volts monitor | 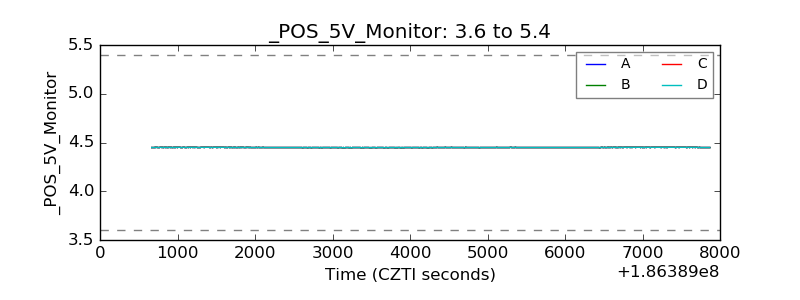 |
| _ROLL_ROT | 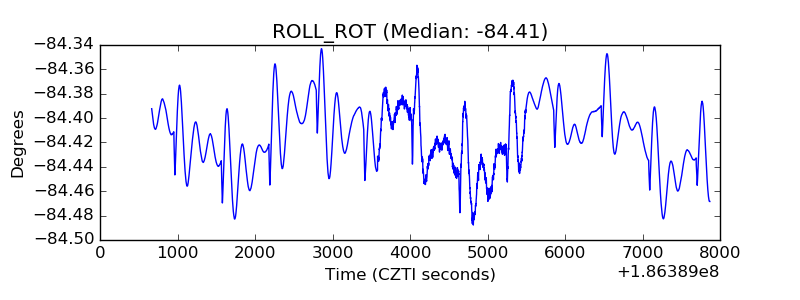 |
| _Roll_DEC | 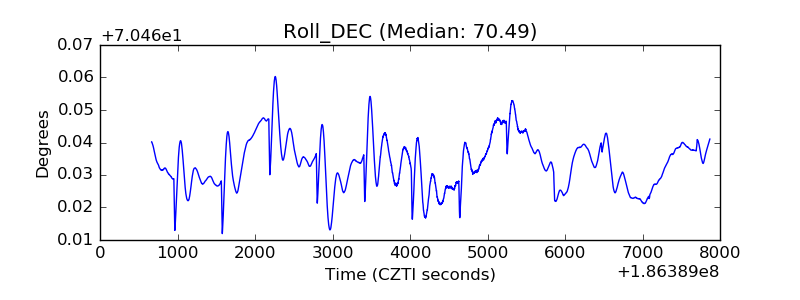 |
| _Roll_RA | 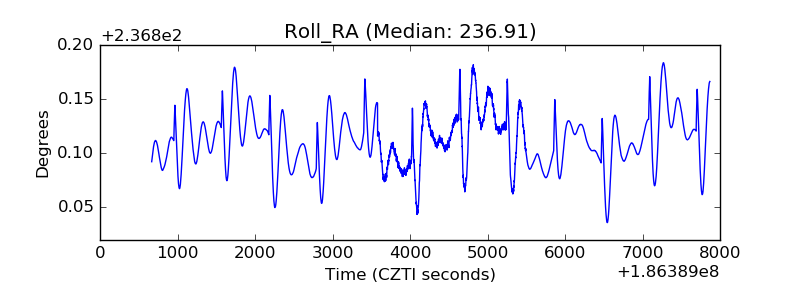 |
| Veto Counter | 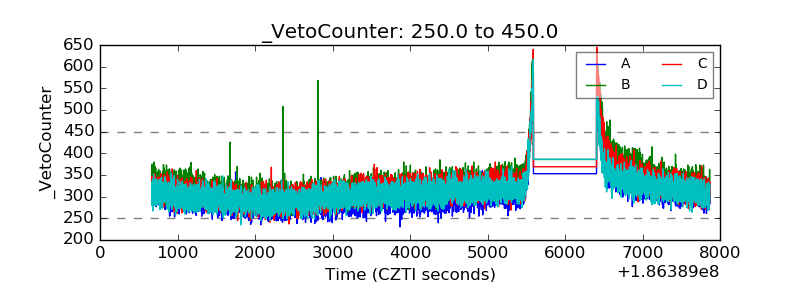 |