| Param | Original file | Final file |
|---|---|---|
| Filename | modeM0/AS1P01_163T03_9000000186_00920cztM0_level2.evt | modeM0/AS1P01_163T03_9000000186_00920cztM0_level2_quad_clean.evt |
| Size (bytes) | 1,576,235,520 | 130,875,840 |
| Size | 1.5 GB | 124.8 MB |
| Events in quadrant A | 11,517,590 | 832,856 |
| Events in quadrant B | 12,684,687 | 835,059 |
| Events in quadrant C | 11,962,482 | 823,422 |
| Events in quadrant D | 10,944,354 | 813,792 |
| Mode SS | |||
|---|---|---|---|
| Quadrant | BADHDUFLAG | Total packets | Discarded packets |
| A | 0 | 194 | 0 |
| B | 0 | 194 | 0 |
| C | 0 | 194 | 0 |
| D | 0 | 194 | 0 |
| Mode M0 | |||
|---|---|---|---|
| Quadrant | BADHDUFLAG | Total packets | Discarded packets |
| A | 0 | 40927 | 0 |
| B | 0 | 44398 | 0 |
| C | 0 | 42297 | 0 |
| D | 0 | 39243 | 0 |
| Mode M9 | |||
|---|---|---|---|
| Quadrant | BADHDUFLAG | Total packets | Discarded packets |
| A | 0 | 13 | 0 |
| B | 0 | 13 | 0 |
| C | 0 | 13 | 0 |
| D | 0 | 13 | 0 |
| Quadrant | Total seconds | Saturated seconds | Saturation percentage |
|---|---|---|---|
| A | 9496 | 71 | 0.747683% |
| B | 9494 | 121 | 1.274489% |
| C | 9494 | 90 | 0.947967% |
| D | 9495 | 103 | 1.084781% |
Noise dominated data is calculated using 1-second bins in cleaned event files. If a bin has >2000 counts, and if more than 50% of those come from <1% of pixels, then it is considered to be noise-dominated and hence unusable.
| Quadrant | # 1 sec bins | Bins with >0 counts | Bins with >2000 counts | High rate bins dominated by noise | Noise dominated (total time) | Noise dominated (detector-on time) | Marked lightcurve |
|---|---|---|---|---|---|---|---|
| A | 10771 | 9498 | 325 | 325 | 3.02% | 3.42% | 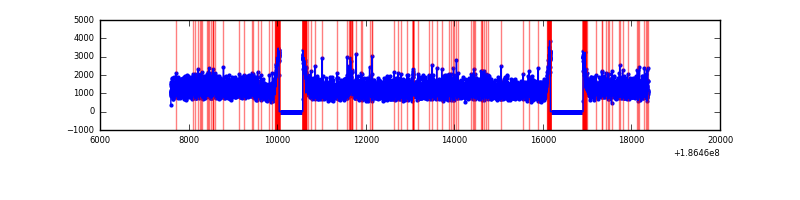 |
| B | 10771 | 9497 | 576 | 576 | 5.35% | 6.07% | 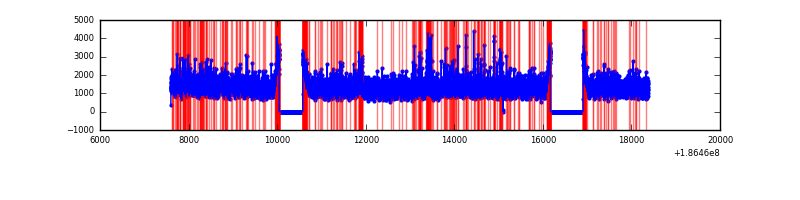 |
| C | 10771 | 9497 | 378 | 378 | 3.51% | 3.98% |  |
| D | 10771 | 9498 | 345 | 345 | 3.20% | 3.63% | 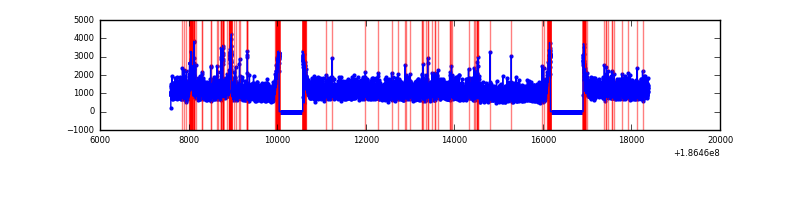 |
Top three noisy pixels from each quadrant. If the there are fewer than three noisy pixels in the level2.evt file, extra rows are filled as -1
| Pixel properties | Quadrant properties | ||||||
|---|---|---|---|---|---|---|---|
| Quadrant | DetID | PixID | Counts | Sigma | Mean | Median | Sigma |
| A | 15 | 127 | 43228 | 55.52 | 2981 | 3000 | 724.6 |
| A | 15 | 233 | 23962 | 28.93 | 2981 | 3000 | 724.6 |
| A | 15 | 69 | 13261 | 14.16 | 2981 | 3000 | 724.6 |
| B | 3 | 0 | 248441 | 329.83 | 3116 | 3129 | 743.8 |
| B | 7 | 221 | 210956 | 279.43 | 3116 | 3129 | 743.8 |
| B | 5 | 191 | 135792 | 178.37 | 3116 | 3129 | 743.8 |
| C | 15 | 241 | 846254 | 1067.37 | 2819 | 2918 | 790.1 |
| C | 9 | 52 | 37792 | 44.14 | 2819 | 2918 | 790.1 |
| C | 3 | 111 | 37246 | 43.45 | 2819 | 2918 | 790.1 |
| D | 10 | 85 | 277480 | 320.99 | 2742 | 2832 | 855.6 |
| D | 12 | 188 | 155074 | 177.93 | 2742 | 2832 | 855.6 |
| D | 1 | 4 | 116625 | 132.99 | 2742 | 2832 | 855.6 |
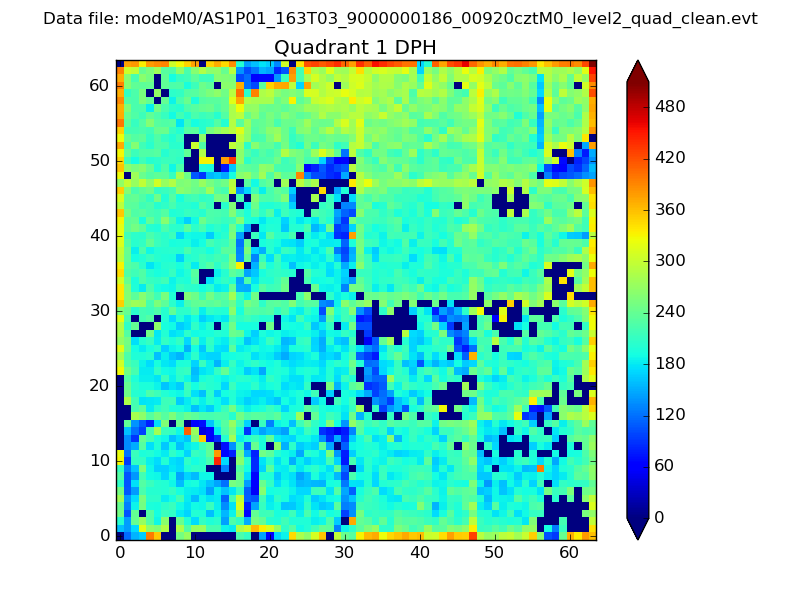
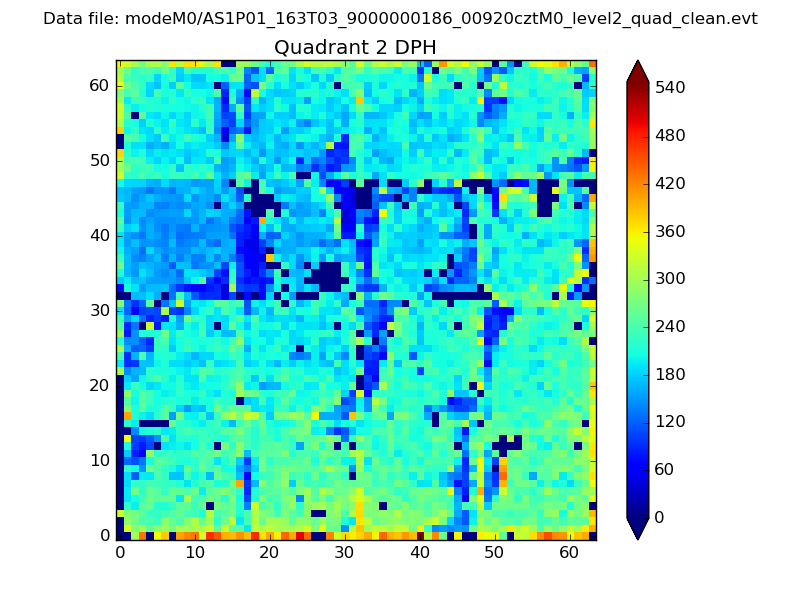
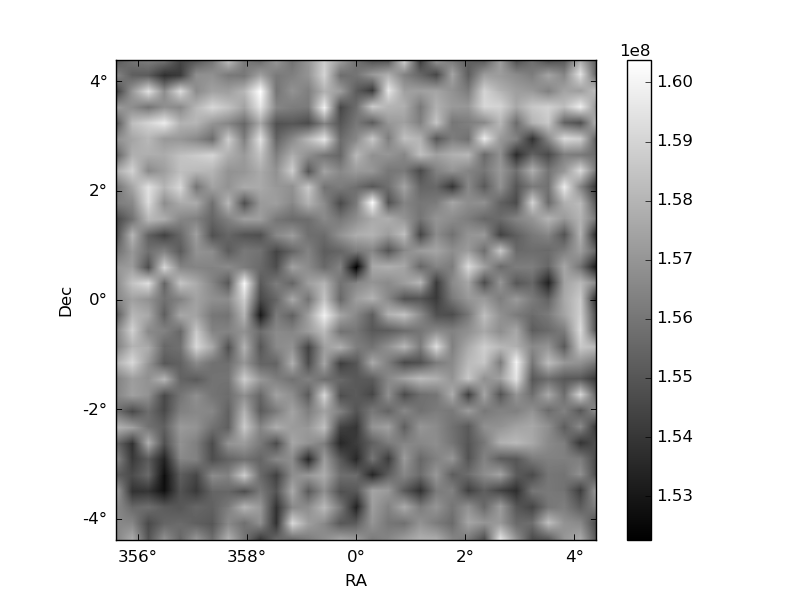
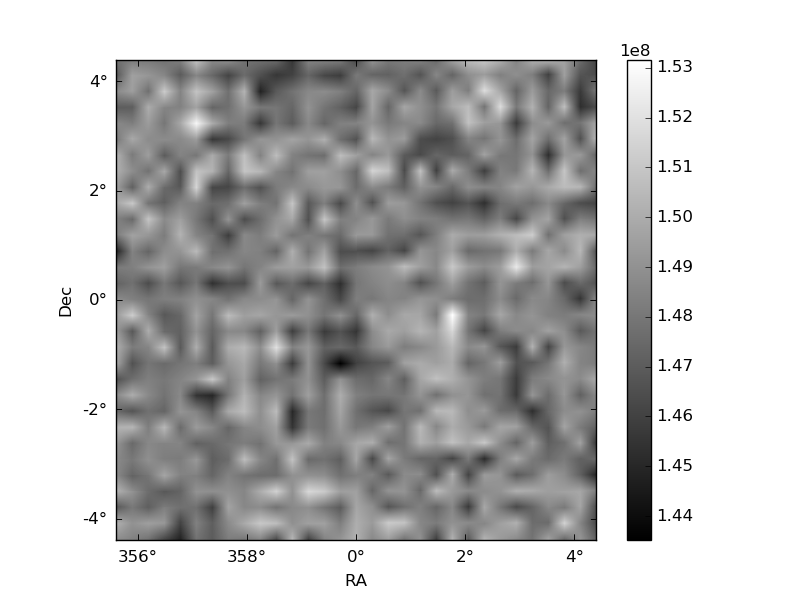
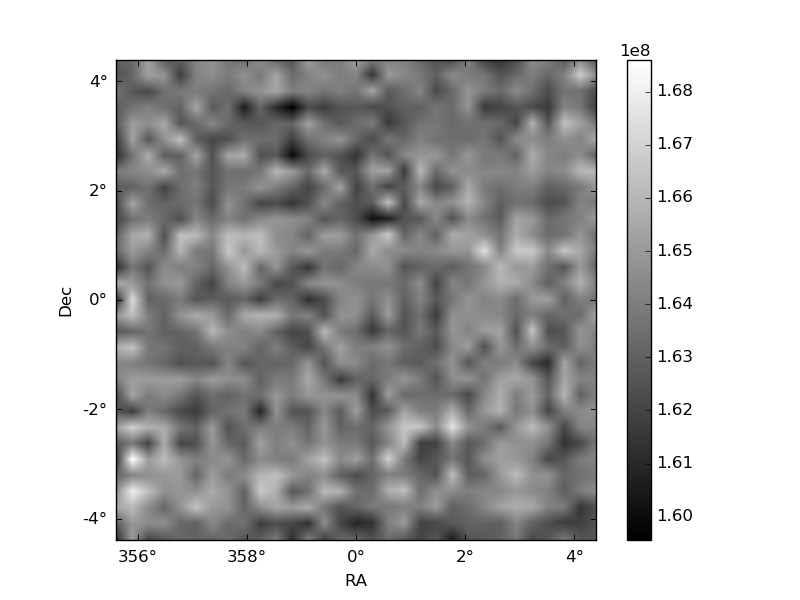
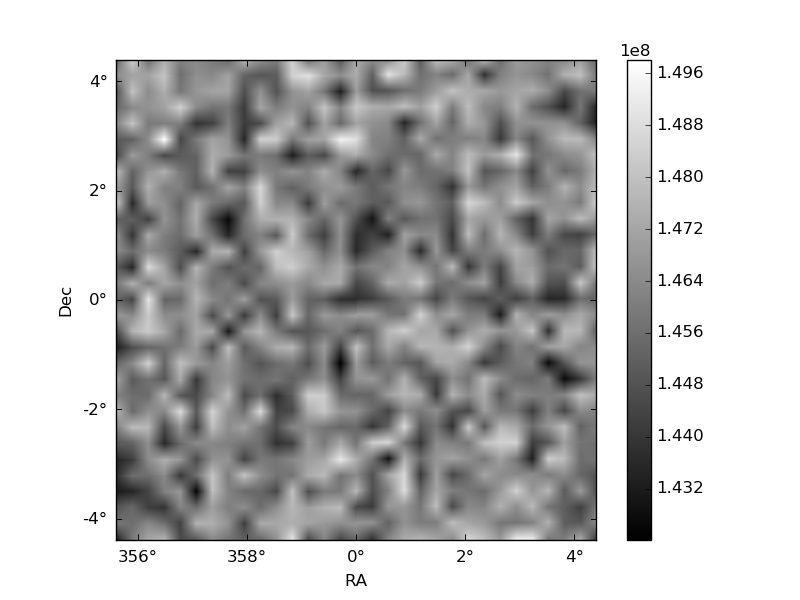
Histogram calculated using DETX and DETY for each event in the final _common_clean file
| Quadrant A | 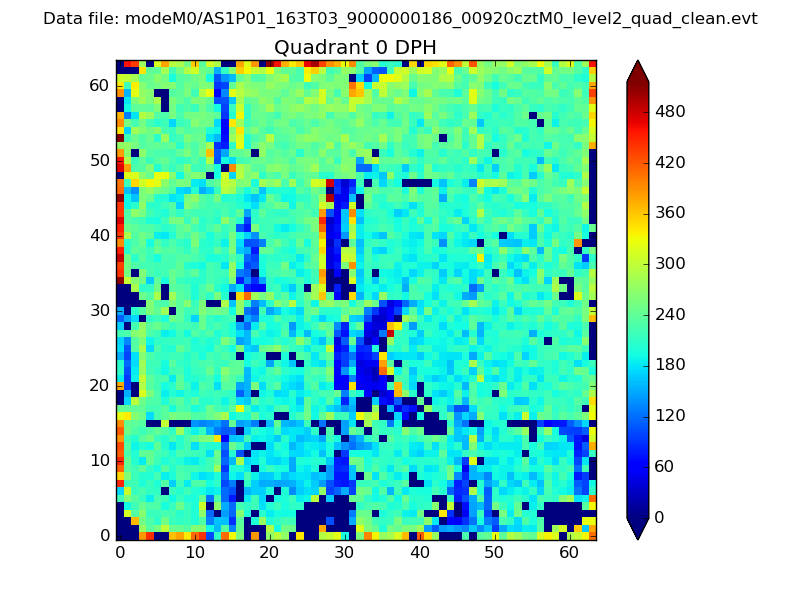 |
 |
Quadrant B |
|---|---|---|---|
| Quadrant D |  |
 |
Quadrant C |
| Plot type | Count rate plots | Images |
|---|---|---|
| Comparison with Poisson distribution Blue bars denote a histogram of data divided into 1 sec bins. Red curve is a Poisson curve with rate = median count rate of data. |
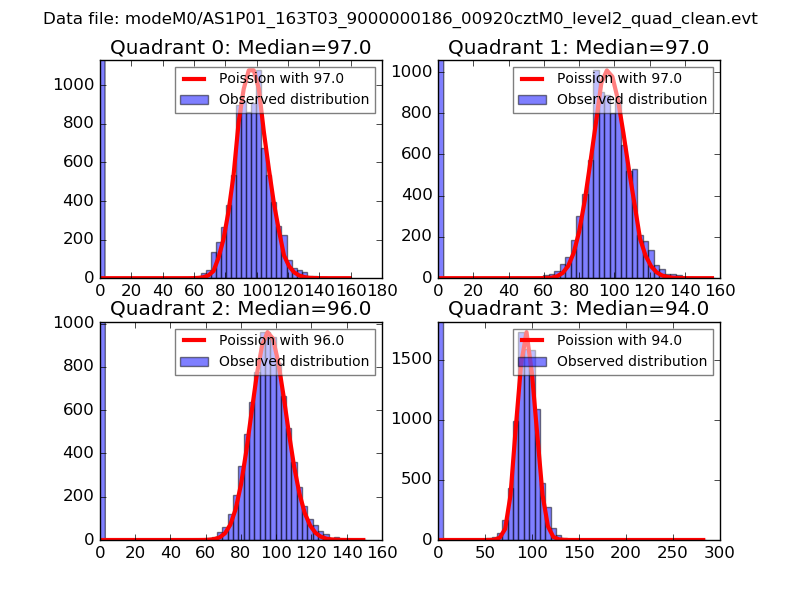 |
 |
| Quadrant-wise count rates Data is divided into 100 sec bins |
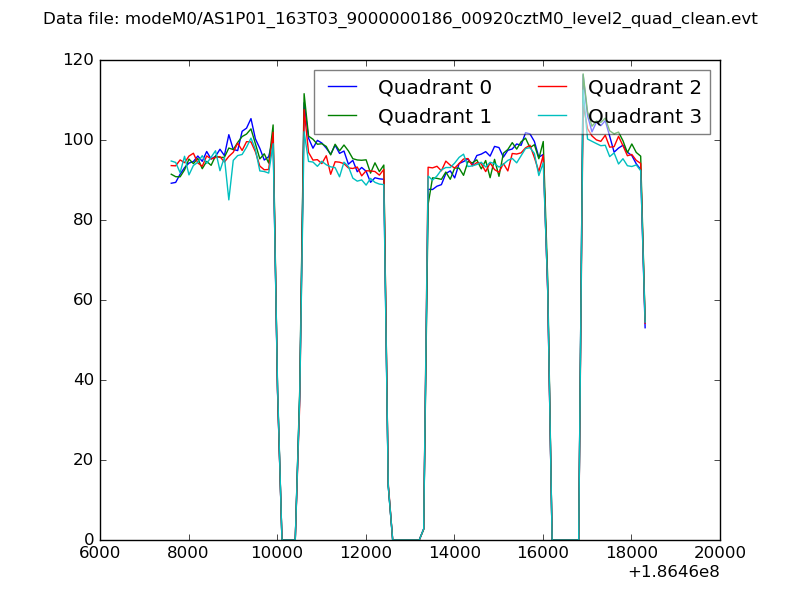 |
|
| Module-wise count rates for Quadrant A Data is divided into 100 sec bins |
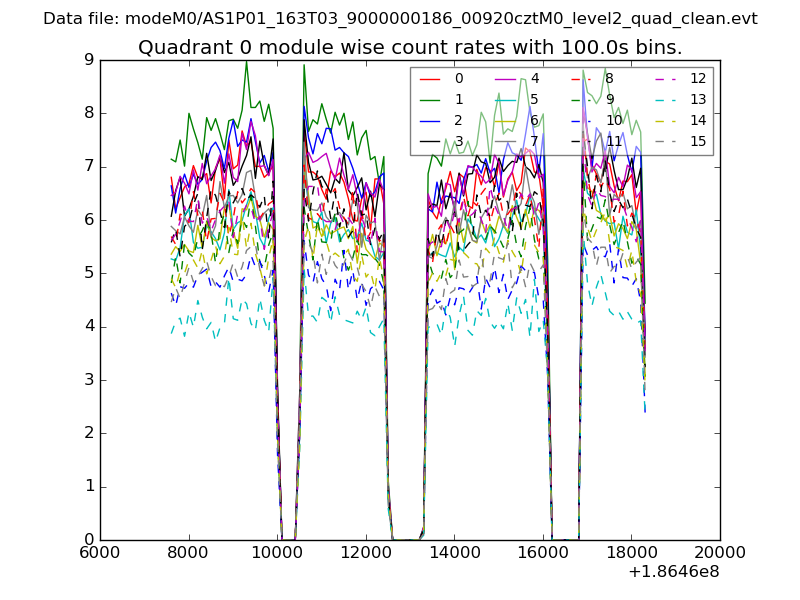 |
 |
| Module-wise count rates for Quadrant B Data is divided into 100 sec bins |
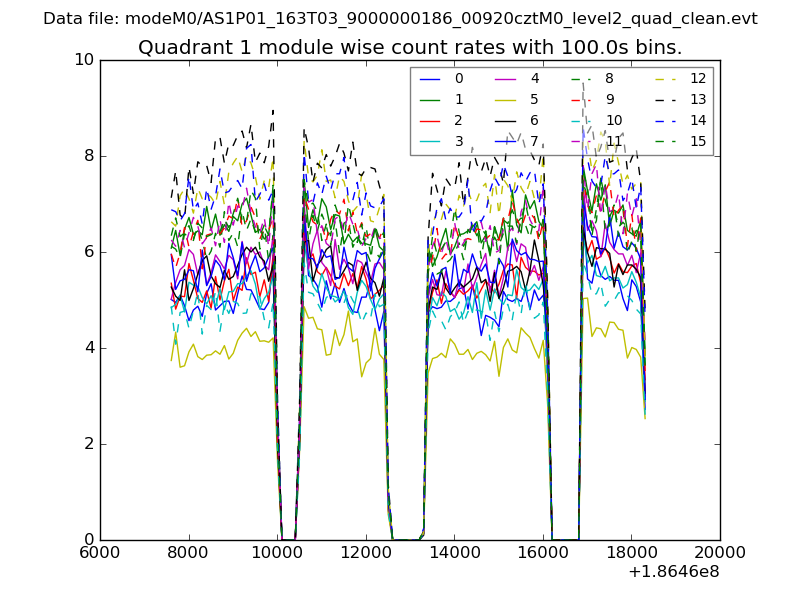 |
 |
| Module-wise count rates for Quadrant C Data is divided into 100 sec bins |
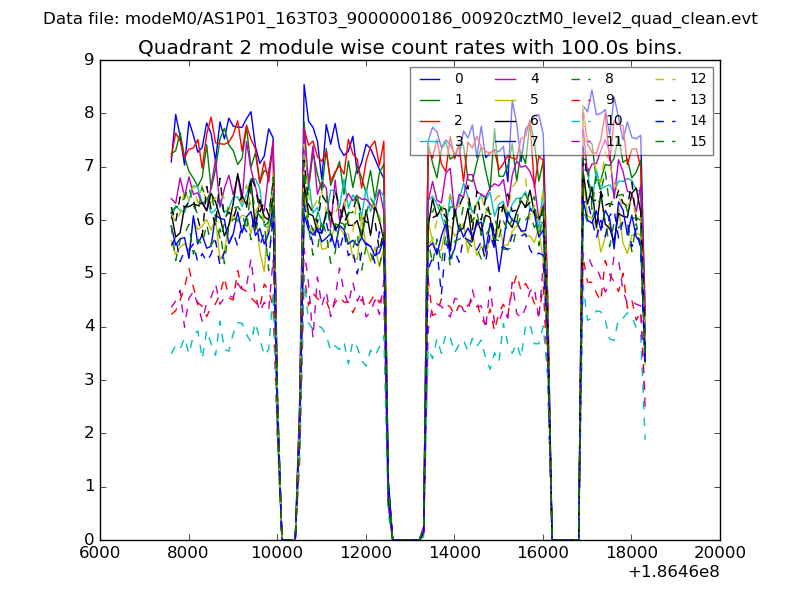 |
 |
| Module-wise count rates for Quadrant D Data is divided into 100 sec bins |
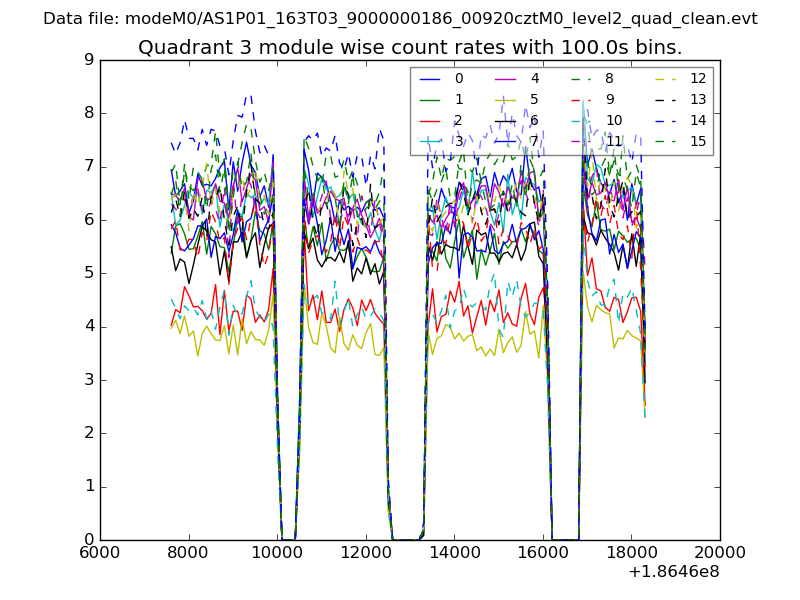 |
 |
| Parameter | Plot |
|---|---|
| CZT HV Monitor | 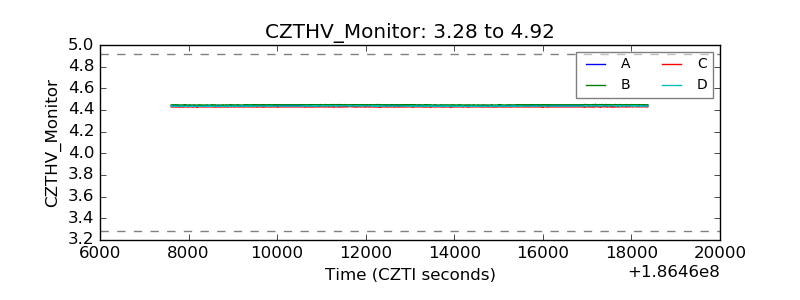 |
| D_VDD | 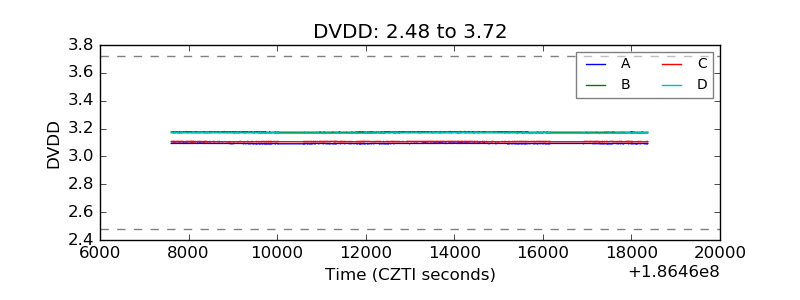 |
| Temperature 1 | 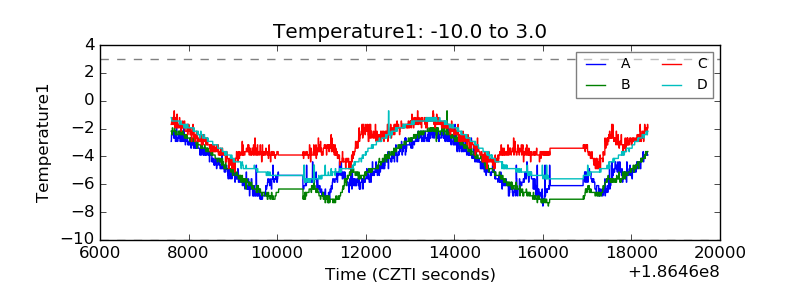 |
| Veto HV Monitor | 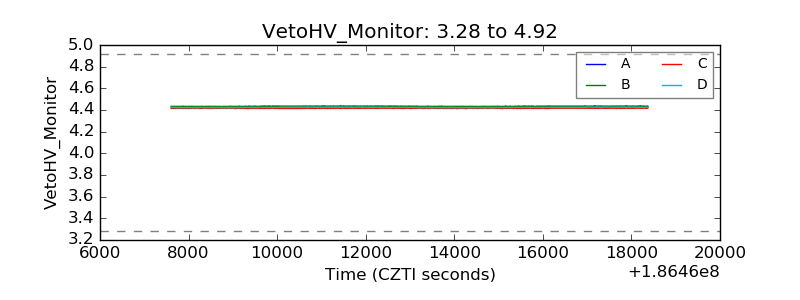 |
| Veto LLD | 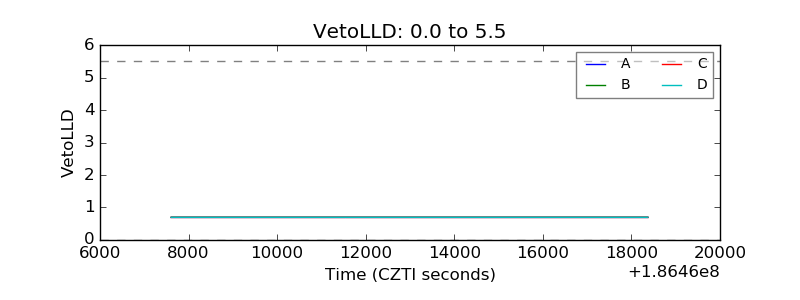 |
| Alpha Counter | 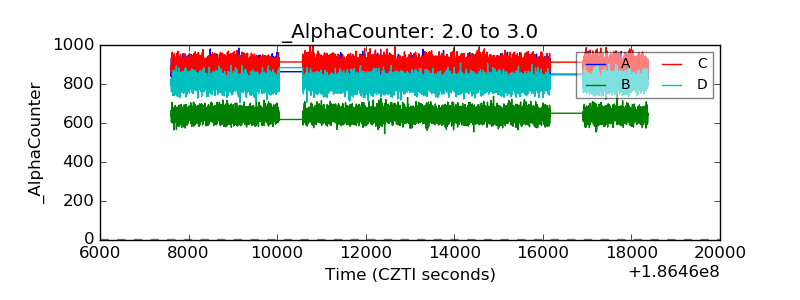 |
| _CPM_Rate | 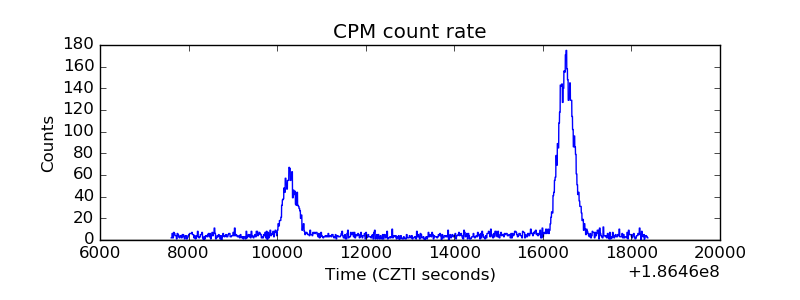 |
| CZT Counter |  |
| +2.5 Volts monitor |  |
| +5 Volts monitor |  |
| _ROLL_ROT | 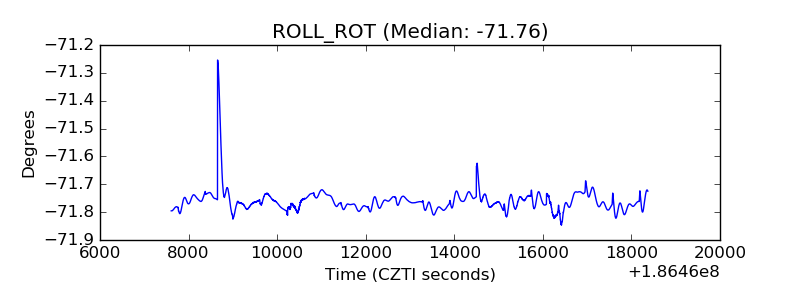 |
| _Roll_DEC | 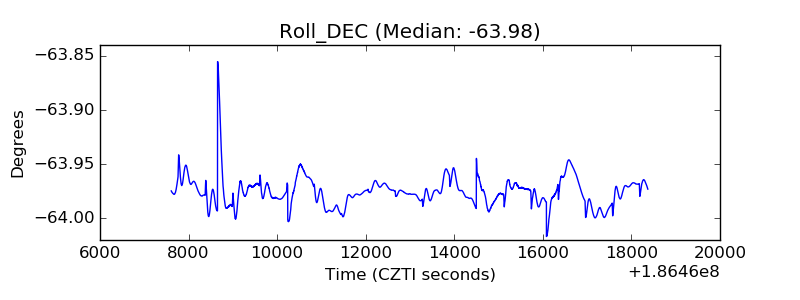 |
| _Roll_RA | 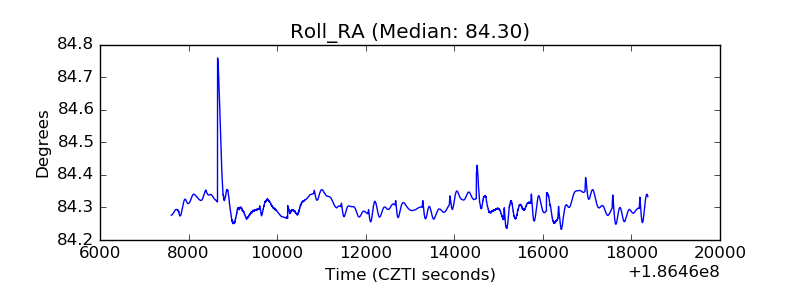 |
| Veto Counter | 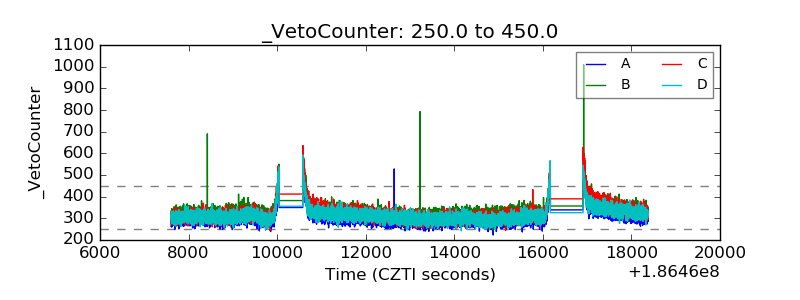 |