| Param | Original file | Final file |
|---|---|---|
| Filename | modeM0/AS1P01_163T03_9000000186_00924cztM0_level2.evt | modeM0/AS1P01_163T03_9000000186_00924cztM0_level2_quad_clean.evt |
| Size (bytes) | 1,101,746,880 | 81,734,400 |
| Size | 1.0 GB | 77.9 MB |
| Events in quadrant A | 8,257,543 | 507,629 |
| Events in quadrant B | 8,819,864 | 508,155 |
| Events in quadrant C | 8,075,689 | 499,468 |
| Events in quadrant D | 7,769,425 | 492,286 |
| Mode SS | |||
|---|---|---|---|
| Quadrant | BADHDUFLAG | Total packets | Discarded packets |
| A | 0 | 136 | 0 |
| B | 0 | 136 | 0 |
| C | 0 | 136 | 0 |
| D | 0 | 136 | 0 |
| Mode M0 | |||
|---|---|---|---|
| Quadrant | BADHDUFLAG | Total packets | Discarded packets |
| A | 0 | 29314 | 0 |
| B | 0 | 30944 | 0 |
| C | 0 | 28753 | 0 |
| D | 0 | 27867 | 0 |
| Mode M9 | |||
|---|---|---|---|
| Quadrant | BADHDUFLAG | Total packets | Discarded packets |
| A | 0 | 12 | 0 |
| B | 0 | 12 | 0 |
| C | 0 | 12 | 0 |
| D | 0 | 12 | 0 |
| Quadrant | Total seconds | Saturated seconds | Saturation percentage |
|---|---|---|---|
| A | 6707 | 63 | 0.939317% |
| B | 6707 | 87 | 1.297152% |
| C | 6707 | 62 | 0.924407% |
| D | 6708 | 51 | 0.760286% |
Noise dominated data is calculated using 1-second bins in cleaned event files. If a bin has >2000 counts, and if more than 50% of those come from <1% of pixels, then it is considered to be noise-dominated and hence unusable.
| Quadrant | # 1 sec bins | Bins with >0 counts | Bins with >2000 counts | High rate bins dominated by noise | Noise dominated (total time) | Noise dominated (detector-on time) | Marked lightcurve |
|---|---|---|---|---|---|---|---|
| A | 7852 | 6708 | 246 | 246 | 3.13% | 3.67% | 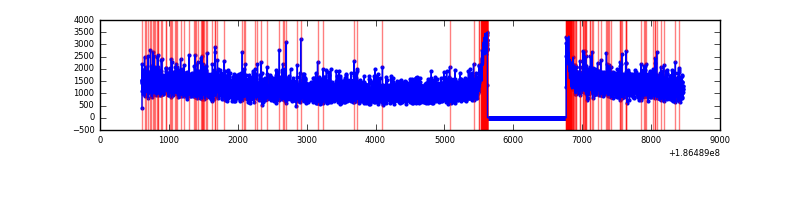 |
| B | 7852 | 6708 | 356 | 356 | 4.53% | 5.31% | 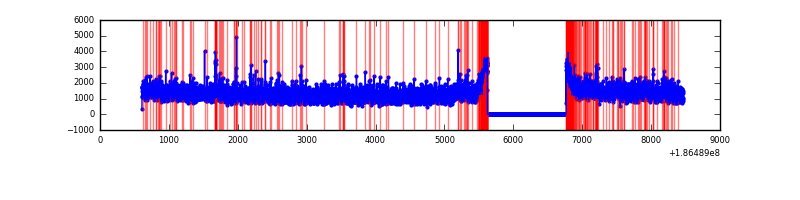 |
| C | 7852 | 6708 | 214 | 214 | 2.73% | 3.19% | 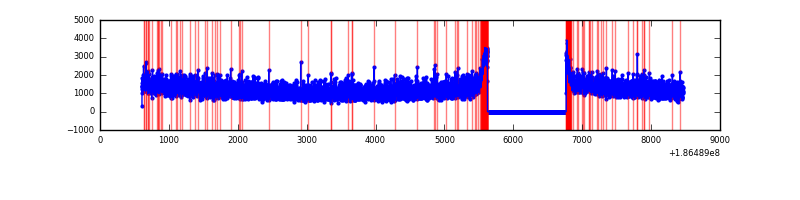 |
| D | 7853 | 6709 | 205 | 205 | 2.61% | 3.06% | 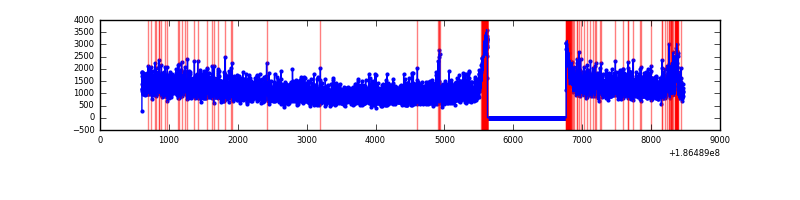 |
Top three noisy pixels from each quadrant. If the there are fewer than three noisy pixels in the level2.evt file, extra rows are filled as -1
| Pixel properties | Quadrant properties | ||||||
|---|---|---|---|---|---|---|---|
| Quadrant | DetID | PixID | Counts | Sigma | Mean | Median | Sigma |
| A | 8 | 192 | 23715 | 41.99 | 2143 | 2156 | 513.4 |
| A | 15 | 127 | 12437 | 20.02 | 2143 | 2156 | 513.4 |
| A | 11 | 79 | 7090 | 9.61 | 2143 | 2156 | 513.4 |
| B | 7 | 221 | 100593 | 189.9 | 2217 | 2228 | 518.0 |
| B | 0 | 182 | 92161 | 173.62 | 2217 | 2228 | 518.0 |
| B | 5 | 249 | 52709 | 97.46 | 2217 | 2228 | 518.0 |
| C | 15 | 241 | 223656 | 401.11 | 1987 | 2054 | 552.5 |
| C | 3 | 111 | 28026 | 47.01 | 1987 | 2054 | 552.5 |
| C | 12 | 254 | 22939 | 37.8 | 1987 | 2054 | 552.5 |
| D | 1 | 4 | 168021 | 273.44 | 1971 | 2041 | 607.0 |
| D | 12 | 188 | 115897 | 187.57 | 1971 | 2041 | 607.0 |
| D | 13 | 171 | 43540 | 68.37 | 1971 | 2041 | 607.0 |
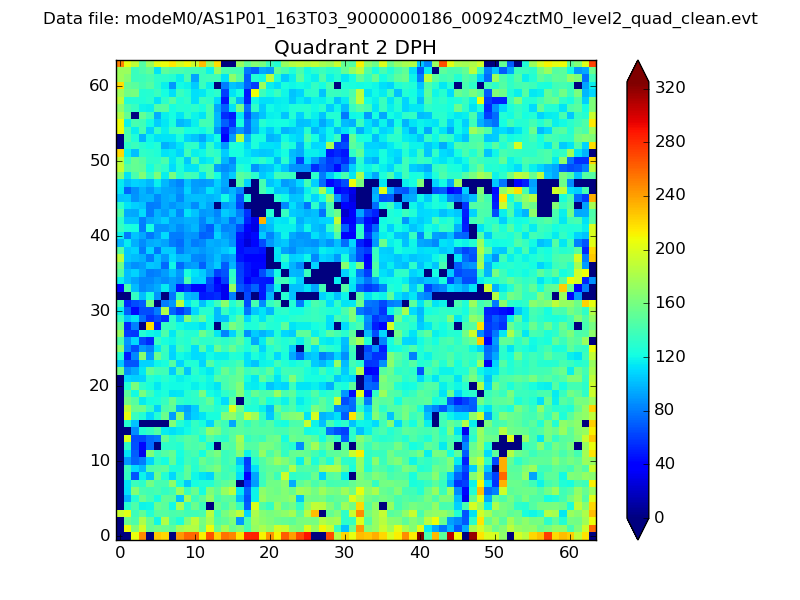
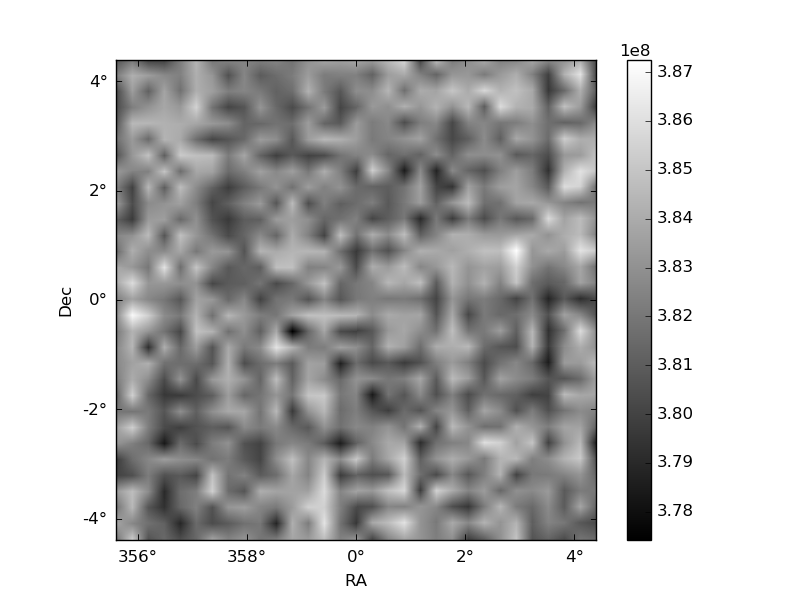
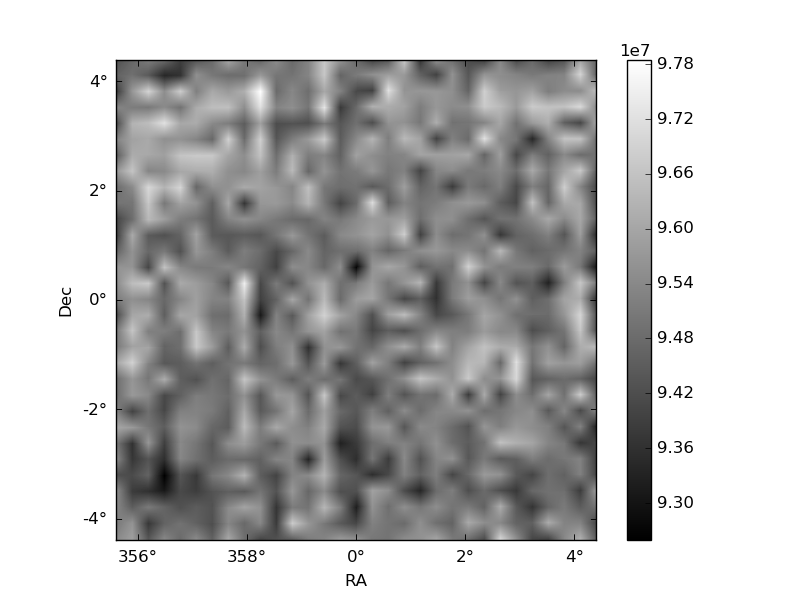
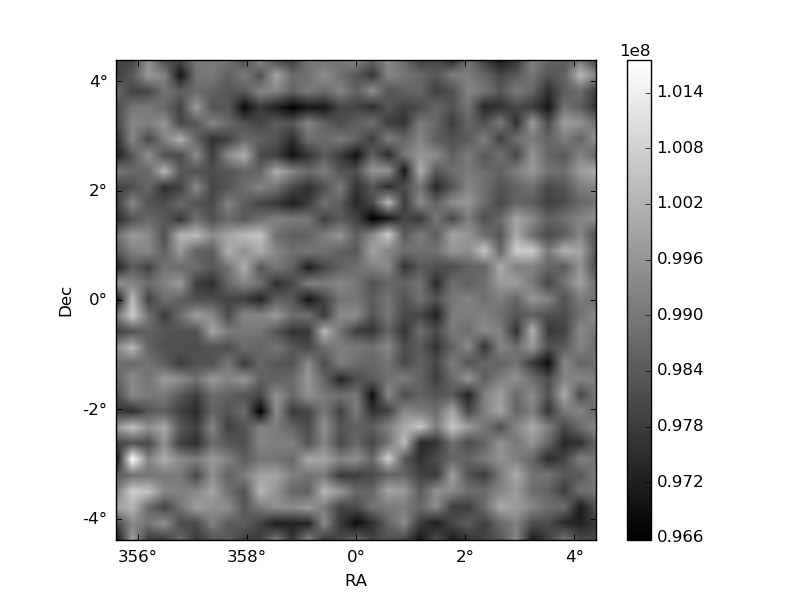
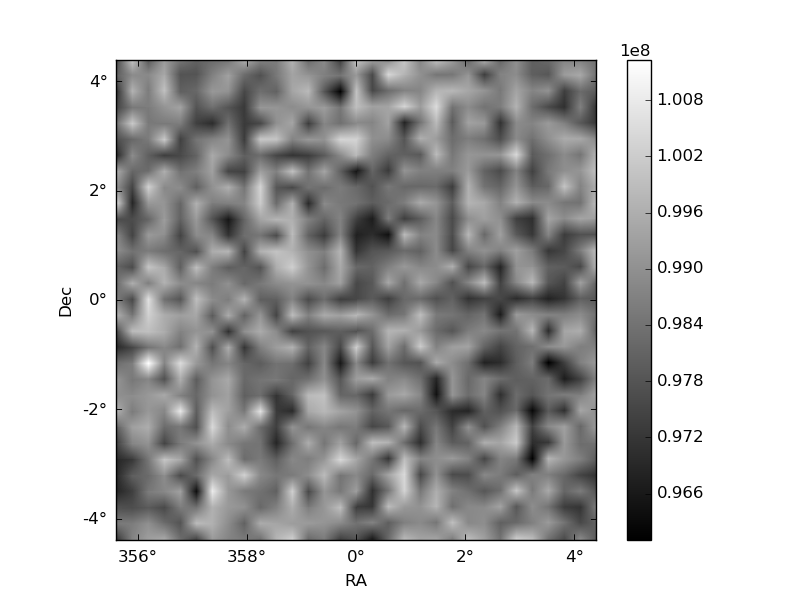
Histogram calculated using DETX and DETY for each event in the final _common_clean file
| Quadrant A | 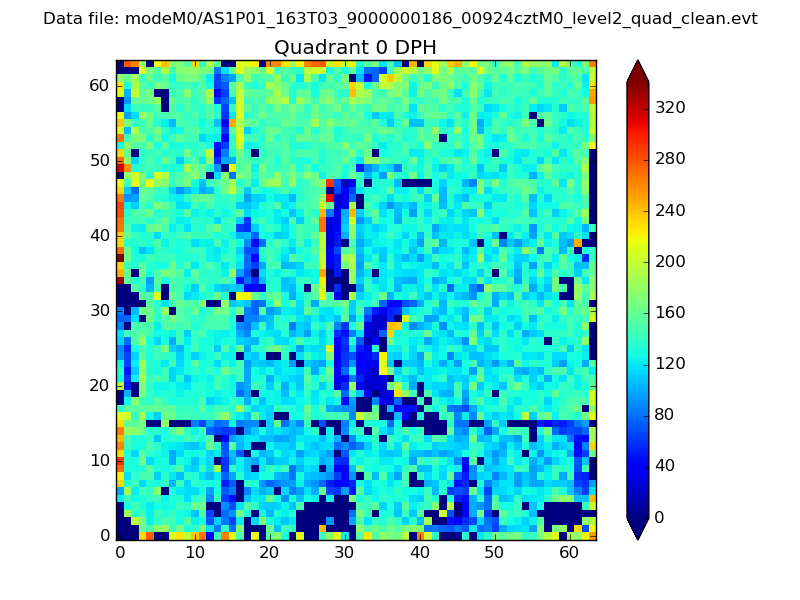 |
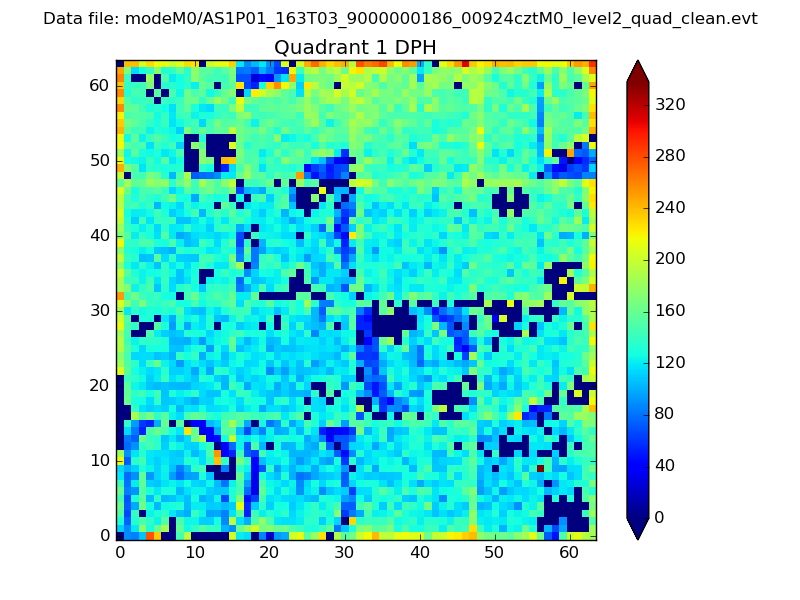 |
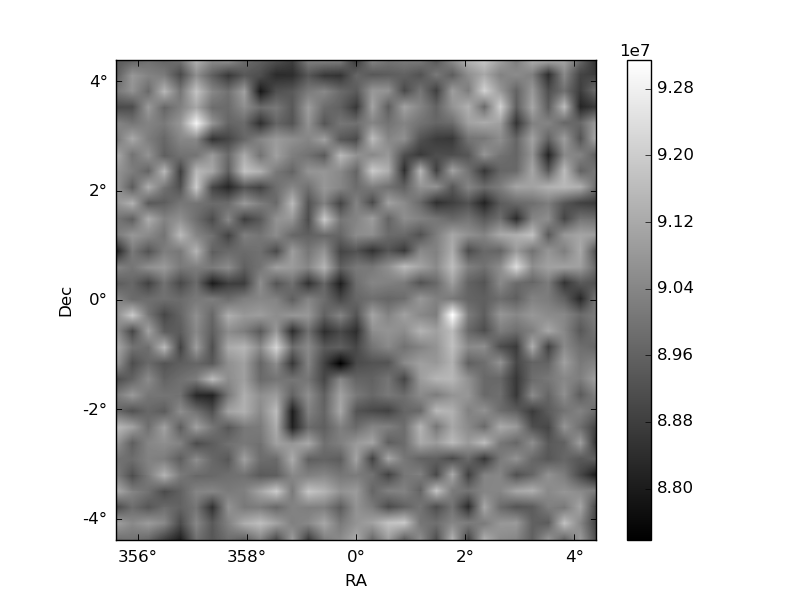
Quadrant B |
|---|---|---|---|
| Quadrant D | 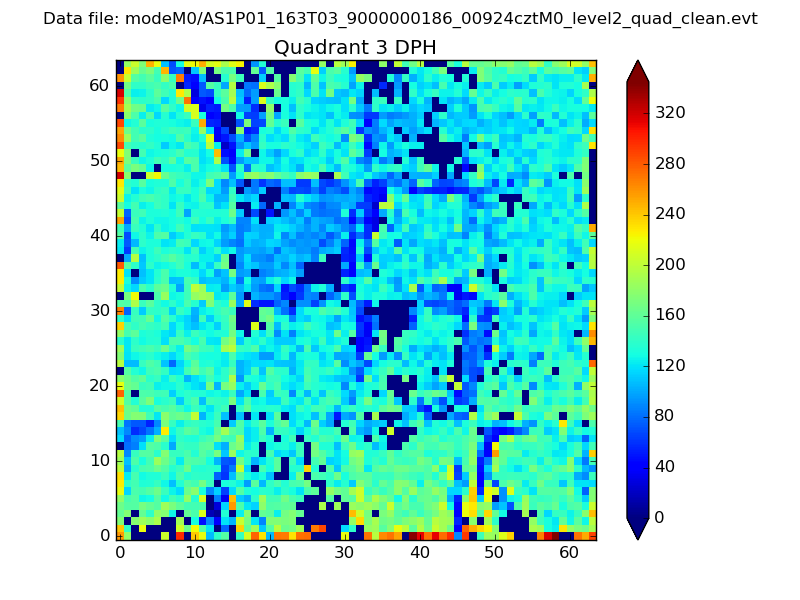 |
 |
Quadrant C |
| Plot type | Count rate plots | Images |
|---|---|---|
| Comparison with Poisson distribution Blue bars denote a histogram of data divided into 1 sec bins. Red curve is a Poisson curve with rate = median count rate of data. |
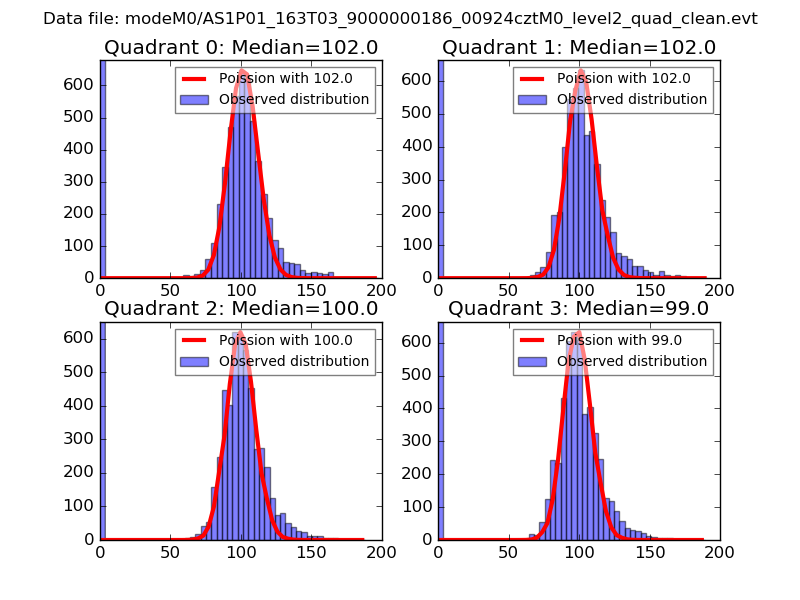 |
 |
| Quadrant-wise count rates Data is divided into 100 sec bins |
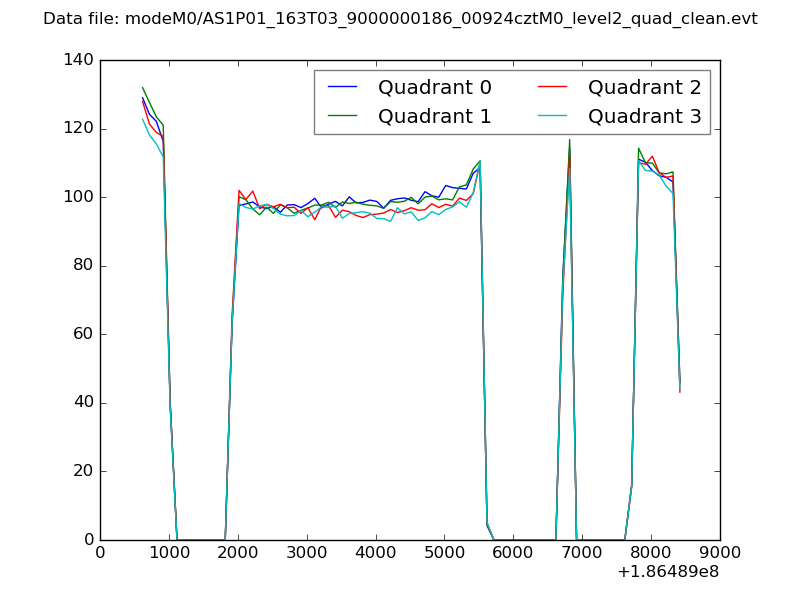 |
|
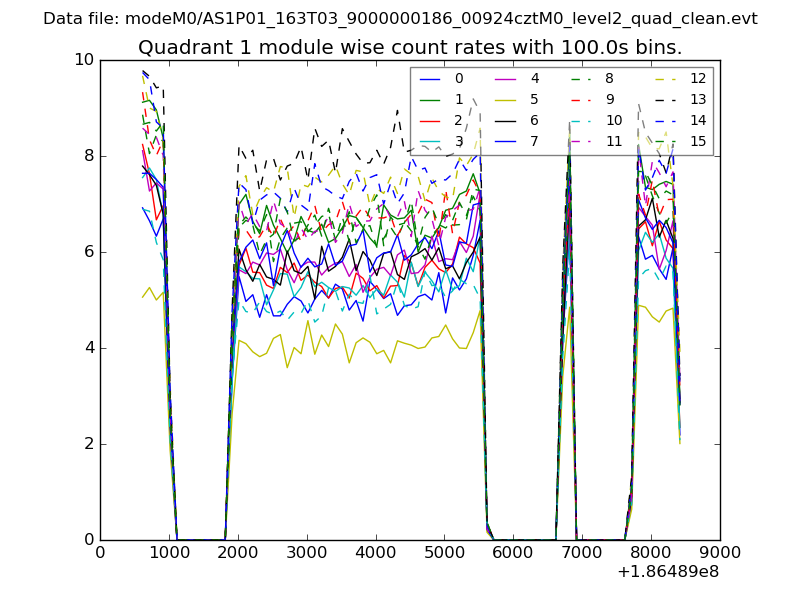
| Module-wise count rates for Quadrant A Data is divided into 100 sec bins |
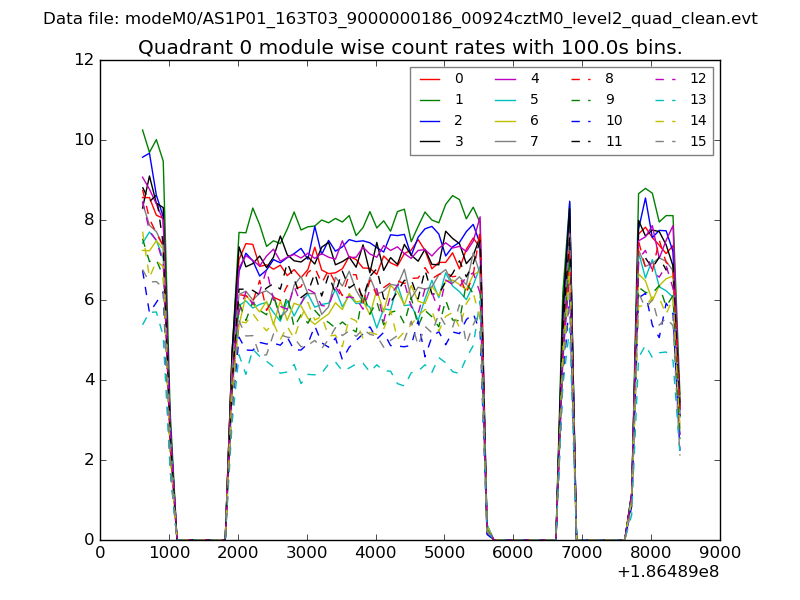 |
 |
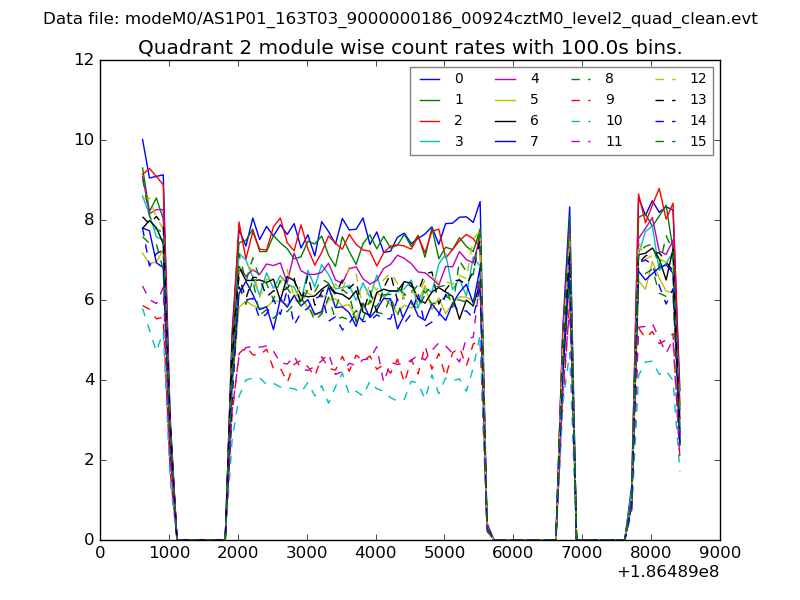
| Module-wise count rates for Quadrant B Data is divided into 100 sec bins |
 |
 |
| Module-wise count rates for Quadrant C Data is divided into 100 sec bins |
 |
 |
| Module-wise count rates for Quadrant D Data is divided into 100 sec bins |
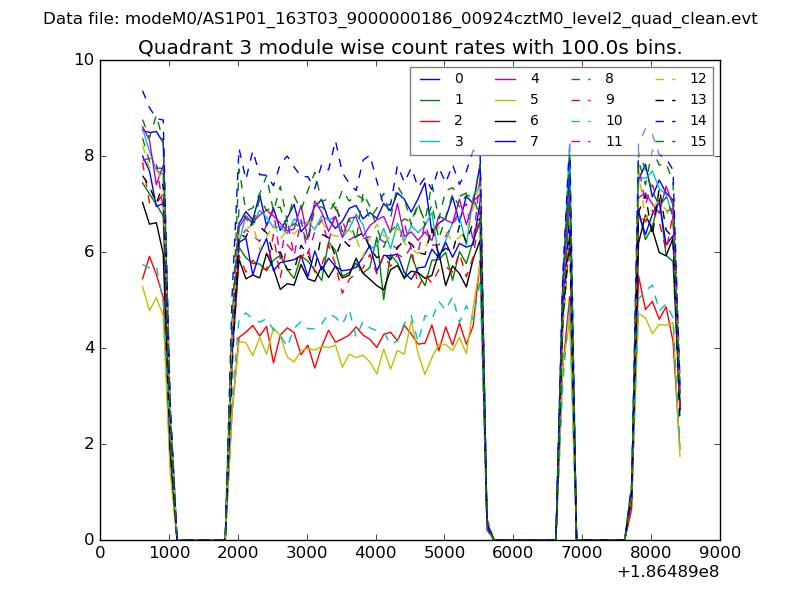 |
 |
| Parameter | Plot |
|---|---|
| CZT HV Monitor | 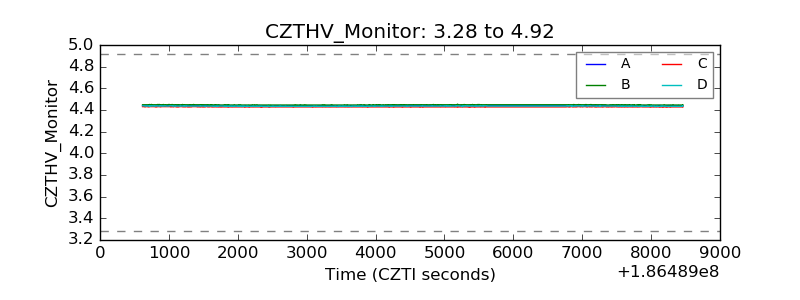 |
| D_VDD | 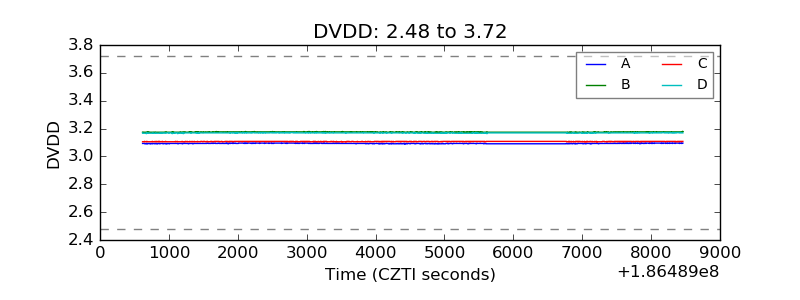 |
| Temperature 1 | 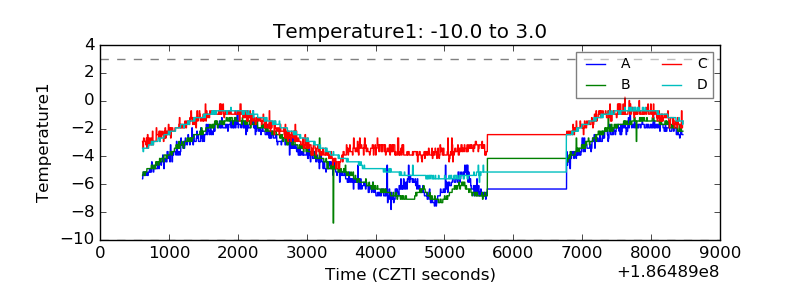 |
| Veto HV Monitor | 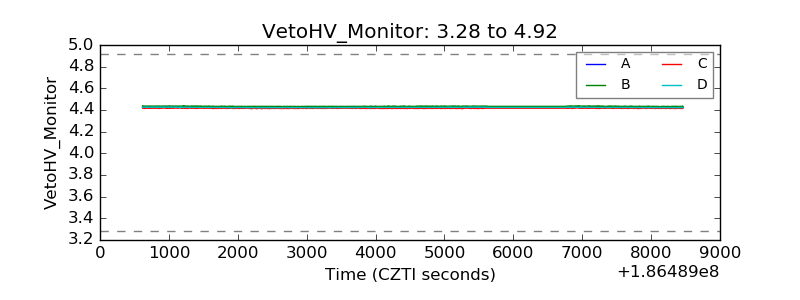 |
| Veto LLD | 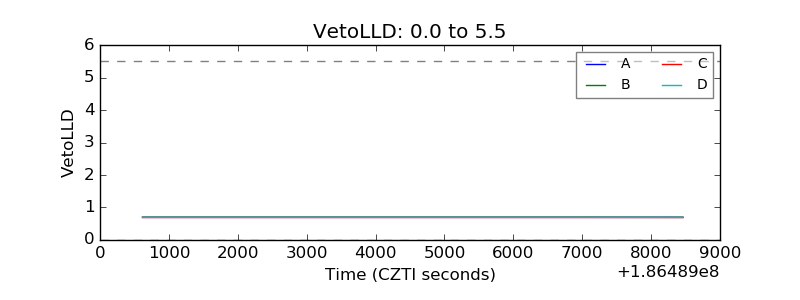 |
| Alpha Counter |  |
| _CPM_Rate |  |
| CZT Counter | 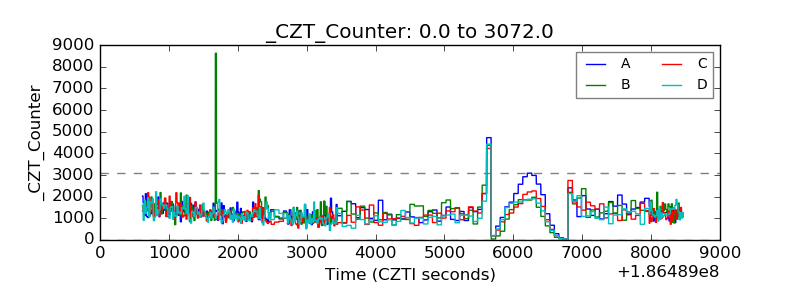 |
| +2.5 Volts monitor |  |
| +5 Volts monitor |  |
| _ROLL_ROT | 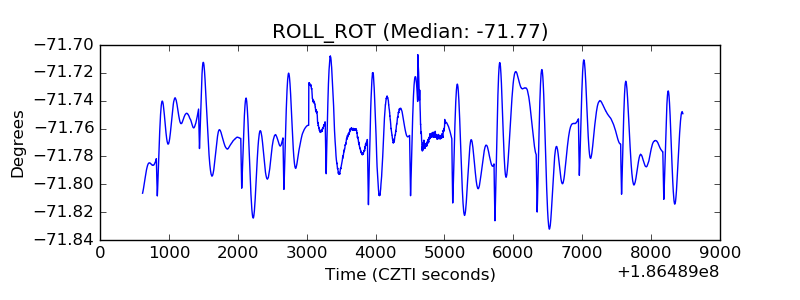 |
| _Roll_DEC | 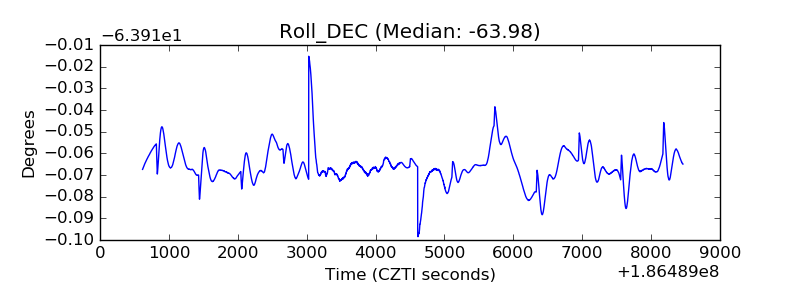 |
| _Roll_RA | 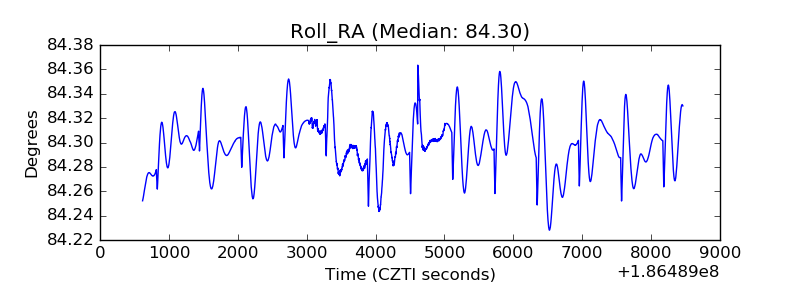 |
| Veto Counter | 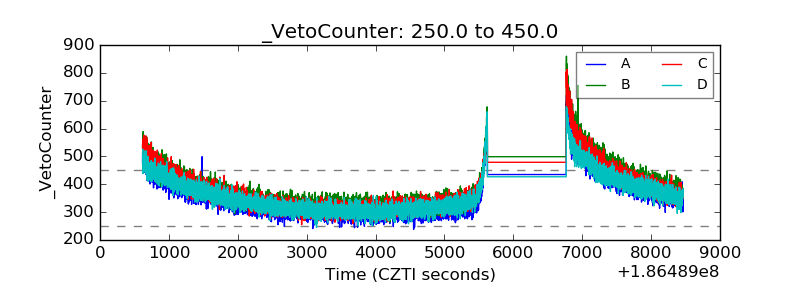 |