| Param | Original file | Final file |
|---|---|---|
| Filename | modeM0/AS1P01_163T03_9000000186_00925cztM0_level2.evt | modeM0/AS1P01_163T03_9000000186_00925cztM0_level2_quad_clean.evt |
| Size (bytes) | 993,072,960 | 83,194,560 |
| Size | 947.1 MB | 79.3 MB |
| Events in quadrant A | 7,418,500 | 530,630 |
| Events in quadrant B | 8,040,848 | 531,501 |
| Events in quadrant C | 7,196,254 | 519,455 |
| Events in quadrant D | 7,014,867 | 511,297 |
| Mode SS | |||
|---|---|---|---|
| Quadrant | BADHDUFLAG | Total packets | Discarded packets |
| A | 0 | 124 | 0 |
| B | 0 | 124 | 0 |
| C | 0 | 124 | 0 |
| D | 0 | 124 | 0 |
| Mode M0 | |||
|---|---|---|---|
| Quadrant | BADHDUFLAG | Total packets | Discarded packets |
| A | 0 | 26359 | 0 |
| B | 0 | 28195 | 0 |
| C | 0 | 25709 | 0 |
| D | 0 | 25162 | 0 |
| Mode M9 | |||
|---|---|---|---|
| Quadrant | BADHDUFLAG | Total packets | Discarded packets |
| A | 0 | 13 | 0 |
| B | 0 | 13 | 0 |
| C | 0 | 13 | 0 |
| D | 0 | 13 | 0 |
| Quadrant | Total seconds | Saturated seconds | Saturation percentage |
|---|---|---|---|
| A | 6113 | 52 | 0.850646% |
| B | 6113 | 87 | 1.423196% |
| C | 6113 | 44 | 0.719778% |
| D | 6112 | 41 | 0.670812% |
Noise dominated data is calculated using 1-second bins in cleaned event files. If a bin has >2000 counts, and if more than 50% of those come from <1% of pixels, then it is considered to be noise-dominated and hence unusable.
| Quadrant | # 1 sec bins | Bins with >0 counts | Bins with >2000 counts | High rate bins dominated by noise | Noise dominated (total time) | Noise dominated (detector-on time) | Marked lightcurve |
|---|---|---|---|---|---|---|---|
| A | 7358 | 6115 | 220 | 220 | 2.99% | 3.60% | 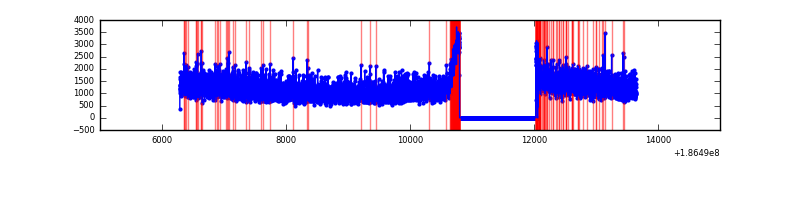 |
| B | 7358 | 6115 | 340 | 340 | 4.62% | 5.56% | 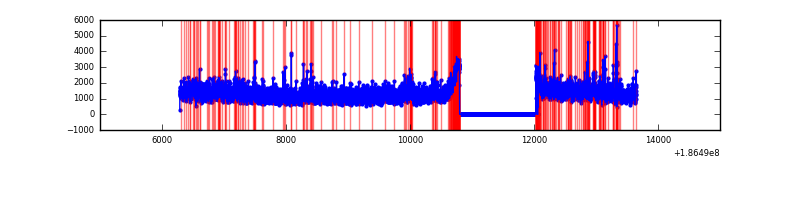 |
| C | 7358 | 6115 | 191 | 191 | 2.60% | 3.12% | 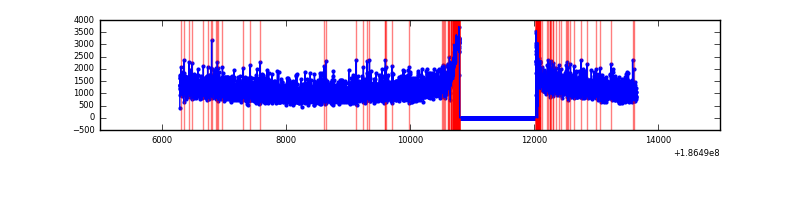 |
| D | 7357 | 6114 | 203 | 203 | 2.76% | 3.32% | 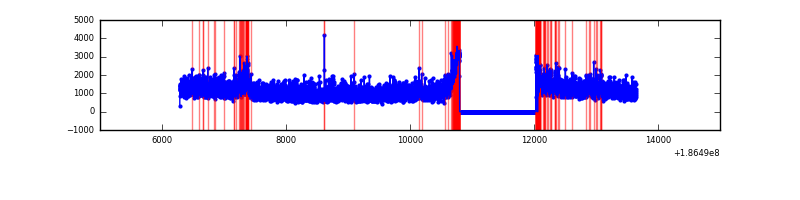 |
Top three noisy pixels from each quadrant. If the there are fewer than three noisy pixels in the level2.evt file, extra rows are filled as -1
| Pixel properties | Quadrant properties | ||||||
|---|---|---|---|---|---|---|---|
| Quadrant | DetID | PixID | Counts | Sigma | Mean | Median | Sigma |
| A | 12 | 189 | 14579 | 27.54 | 1927 | 1944 | 458.8 |
| A | 11 | 79 | 8017 | 13.24 | 1927 | 1944 | 458.8 |
| A | 3 | 111 | 5986 | 8.81 | 1927 | 1944 | 458.8 |
| B | 7 | 221 | 94616 | 199.74 | 1988 | 2001 | 463.7 |
| B | 5 | 249 | 84941 | 178.88 | 1988 | 2001 | 463.7 |
| B | 5 | 191 | 59190 | 123.34 | 1988 | 2001 | 463.7 |
| C | 15 | 241 | 199217 | 404.35 | 1770 | 1828 | 488.2 |
| C | 3 | 111 | 26240 | 50.01 | 1770 | 1828 | 488.2 |
| C | 3 | 79 | 20448 | 38.14 | 1770 | 1828 | 488.2 |
| D | 12 | 188 | 195109 | 362.99 | 1742 | 1804 | 532.5 |
| D | 1 | 4 | 167691 | 311.5 | 1742 | 1804 | 532.5 |
| D | 13 | 171 | 43097 | 77.54 | 1742 | 1804 | 532.5 |
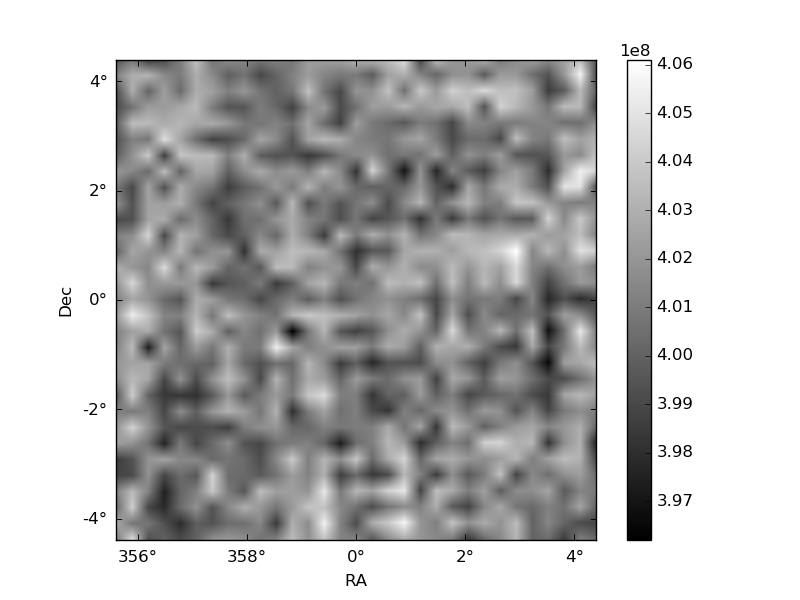
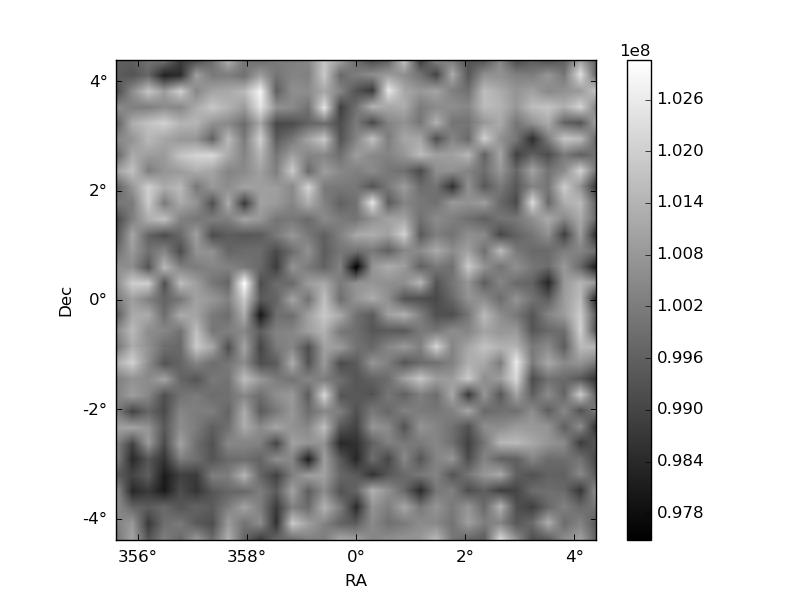
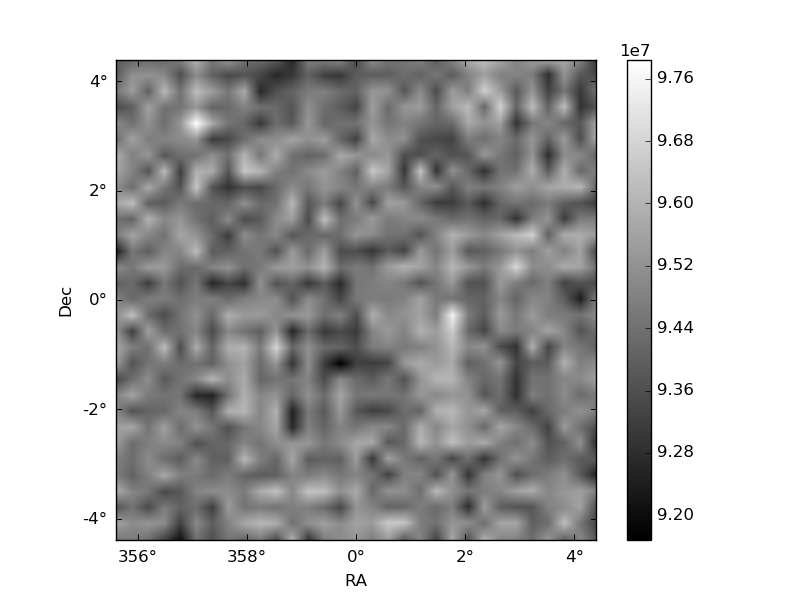
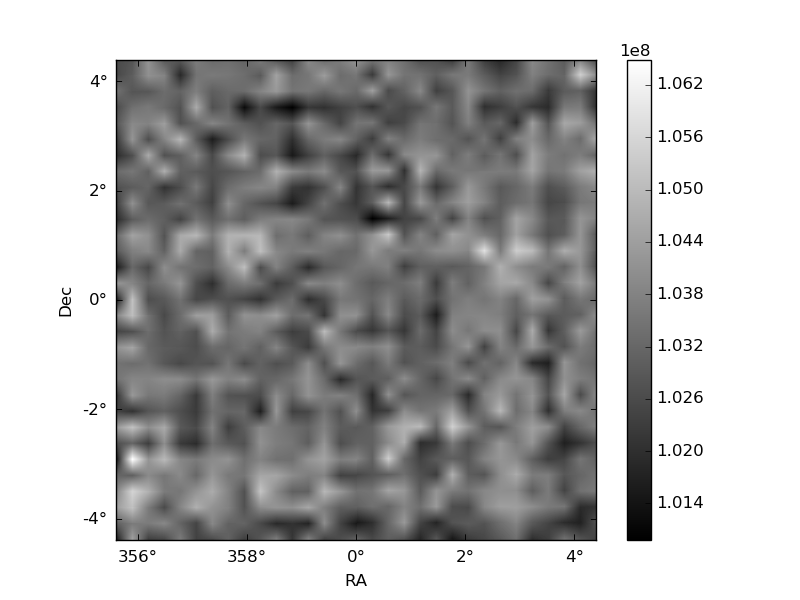
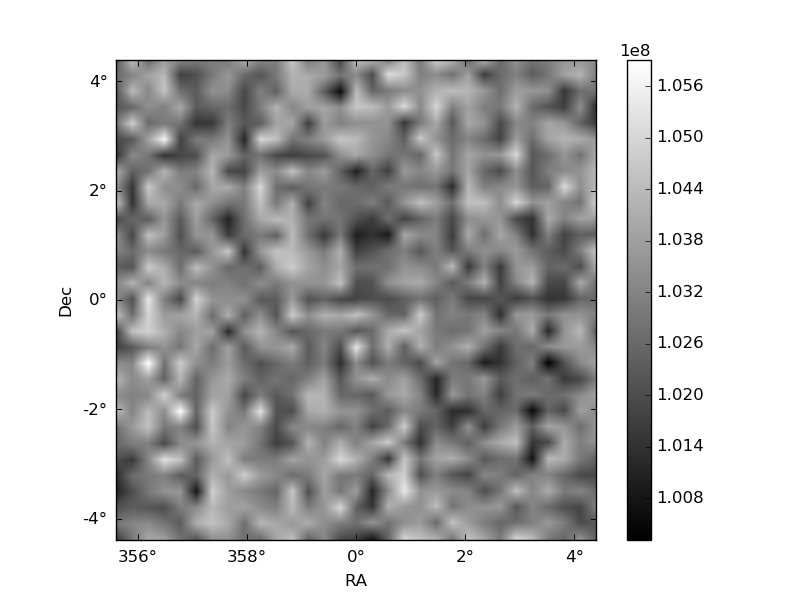
Histogram calculated using DETX and DETY for each event in the final _common_clean file
| Quadrant A | 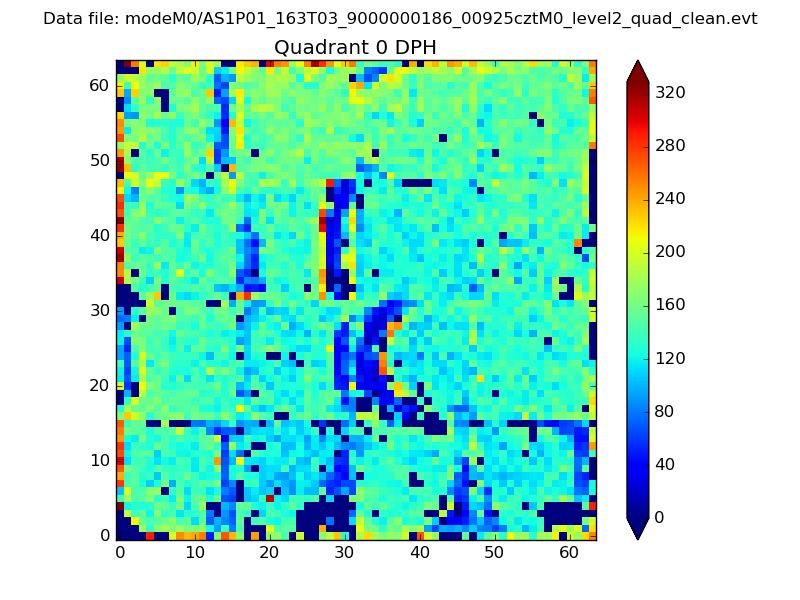 |
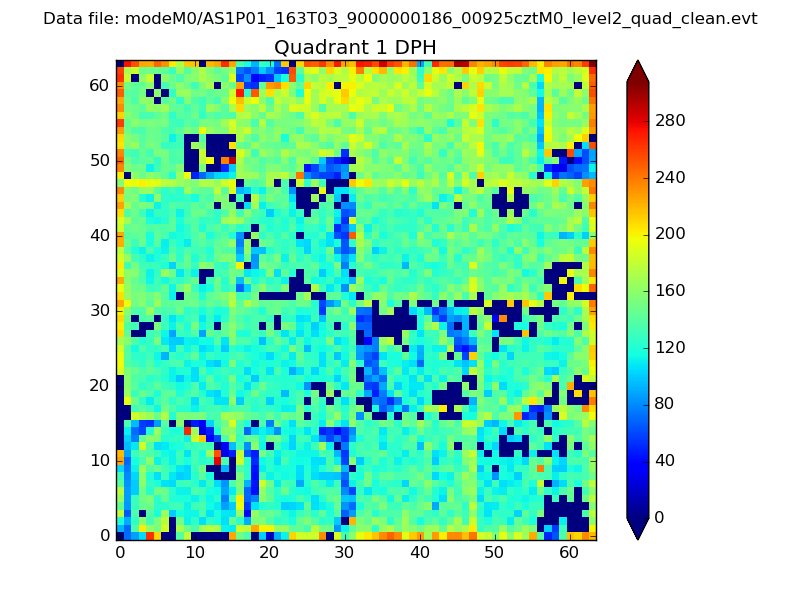 |
Quadrant B |
|---|---|---|---|
| Quadrant D | 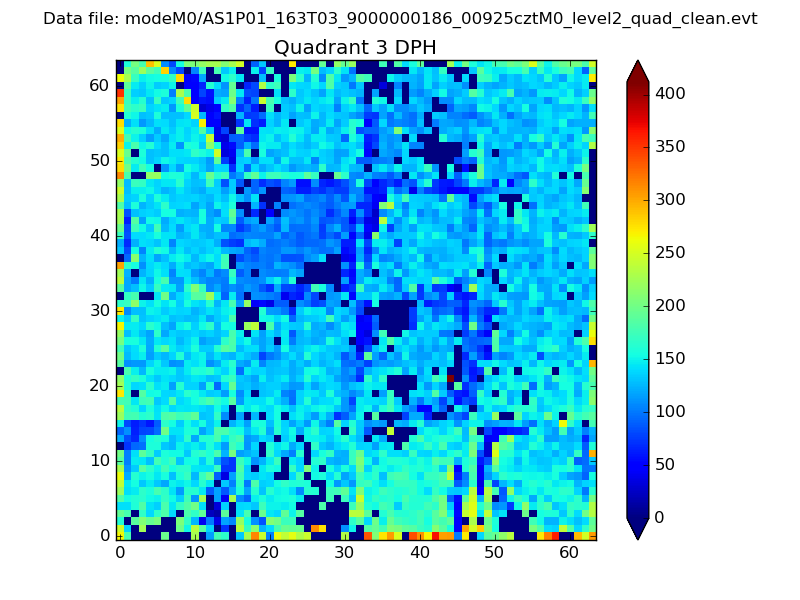 |
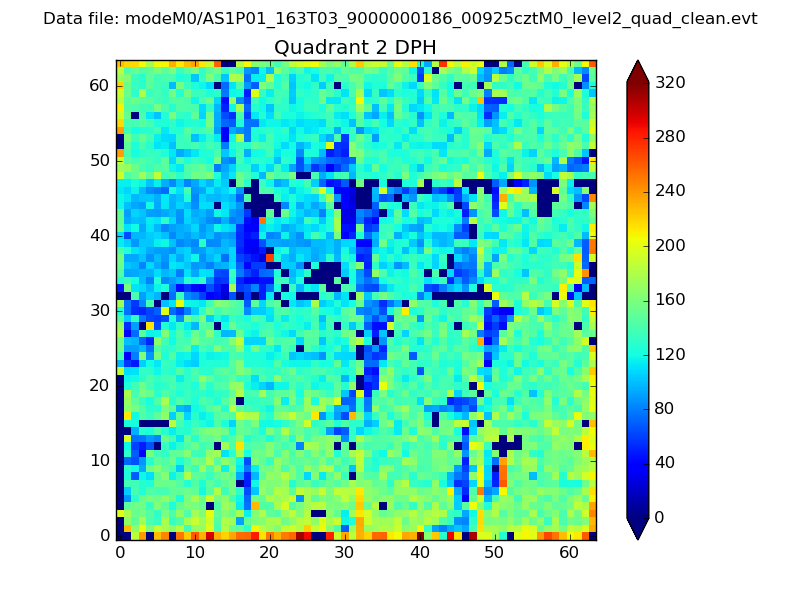 |
Quadrant C |
| Plot type | Count rate plots | Images |
|---|---|---|
| Comparison with Poisson distribution Blue bars denote a histogram of data divided into 1 sec bins. Red curve is a Poisson curve with rate = median count rate of data. |
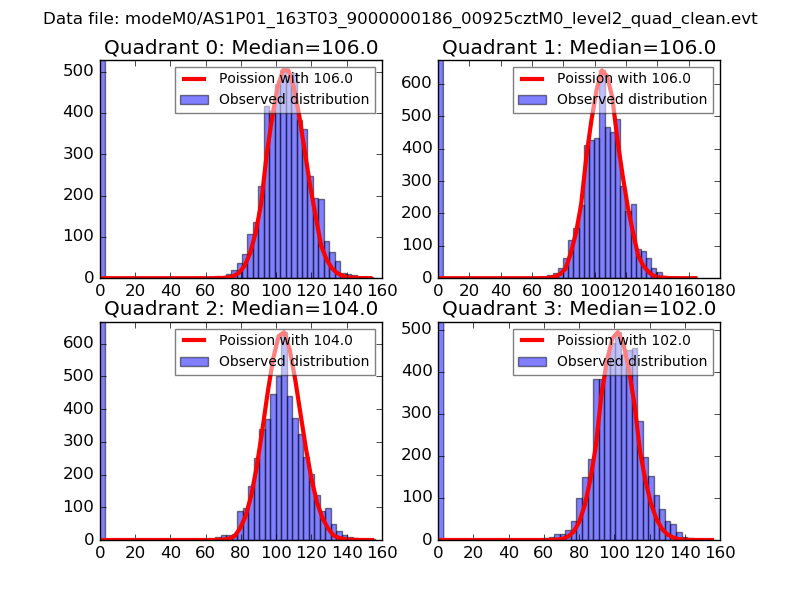 |
 |
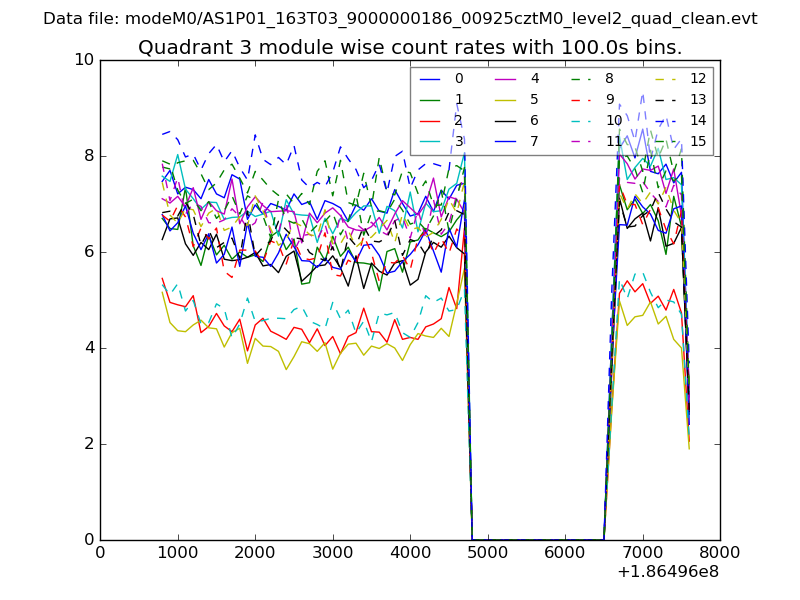
| Quadrant-wise count rates Data is divided into 100 sec bins |
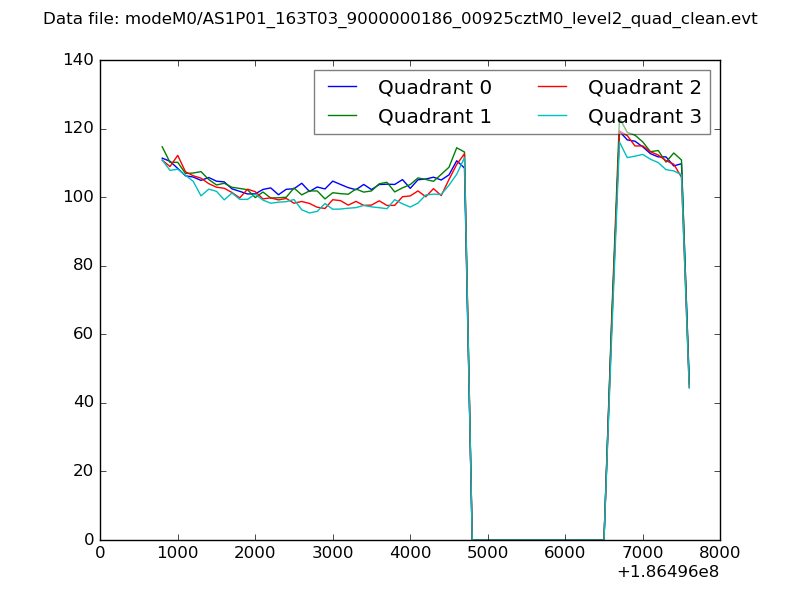 |
|
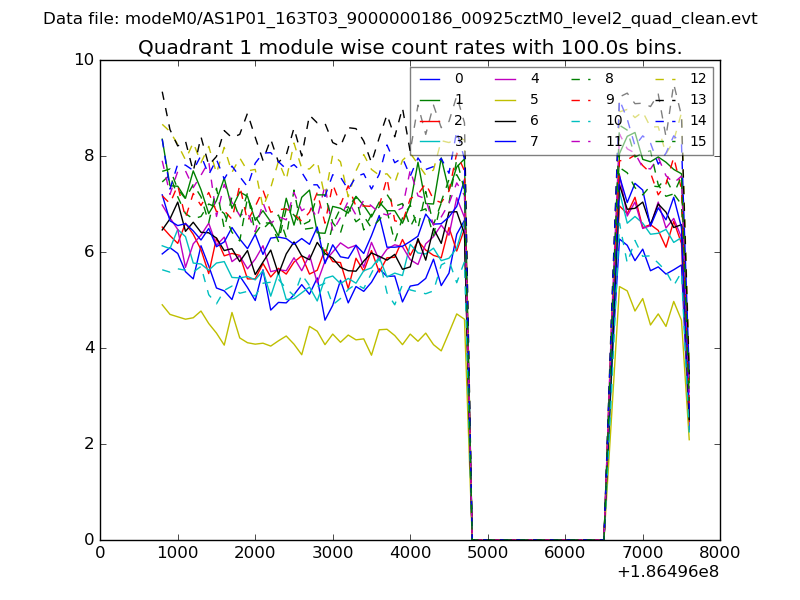
| Module-wise count rates for Quadrant A Data is divided into 100 sec bins |
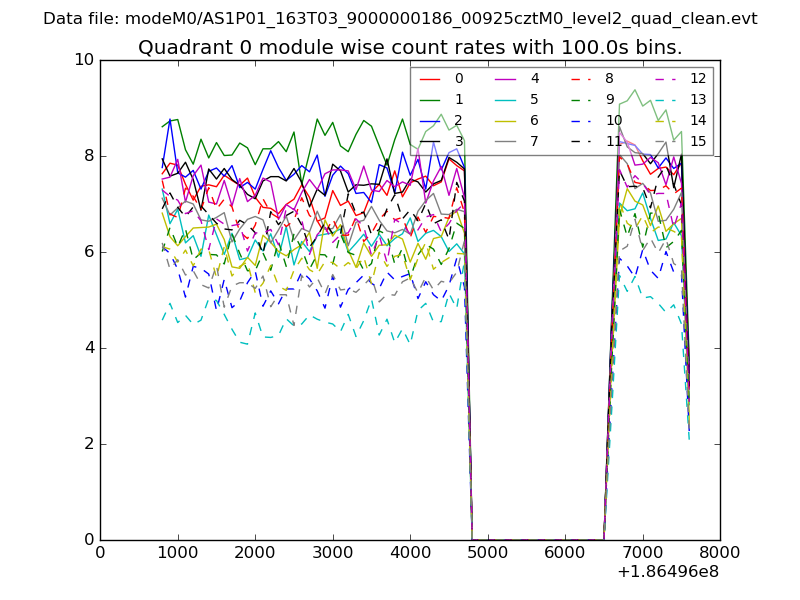 |
 |
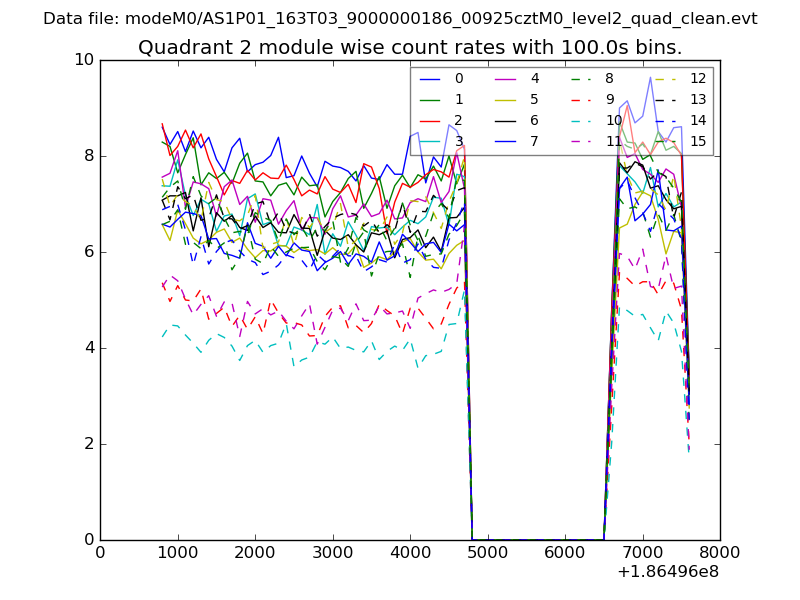
| Module-wise count rates for Quadrant B Data is divided into 100 sec bins |
 |
 |
| Module-wise count rates for Quadrant C Data is divided into 100 sec bins |
 |
 |
| Module-wise count rates for Quadrant D Data is divided into 100 sec bins |
 |
 |
| Parameter | Plot |
|---|---|
| CZT HV Monitor | 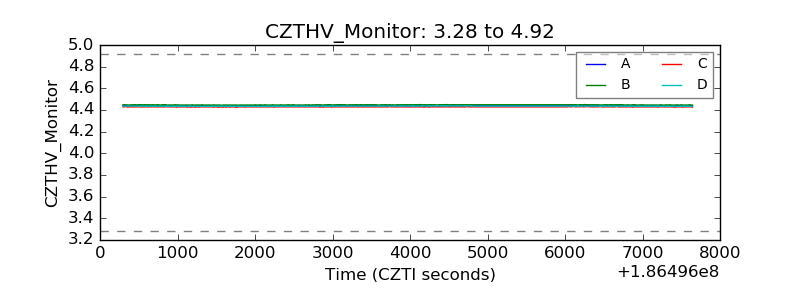 |
| D_VDD | 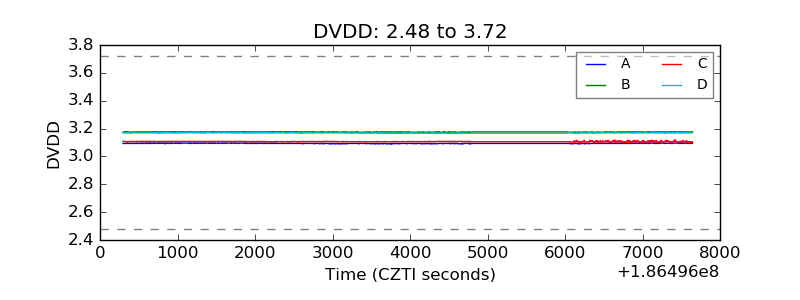 |
| Temperature 1 | 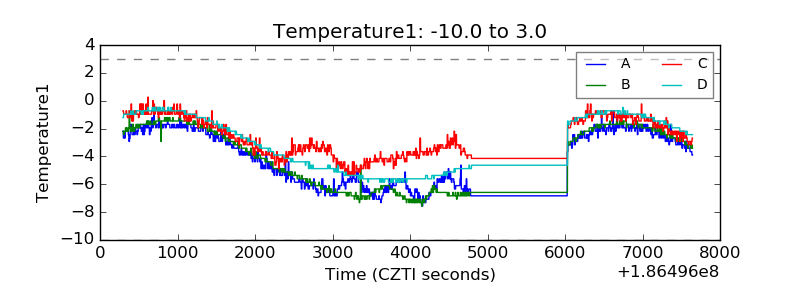 |
| Veto HV Monitor | 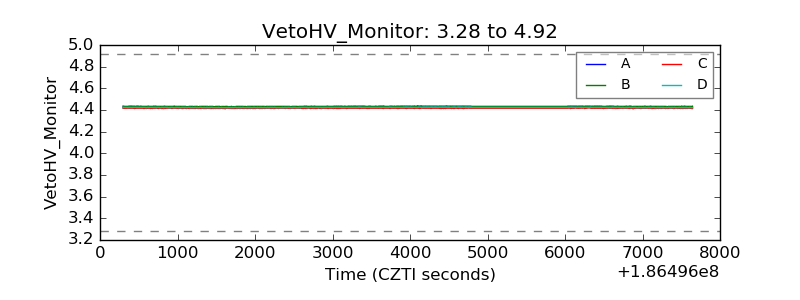 |
| Veto LLD | 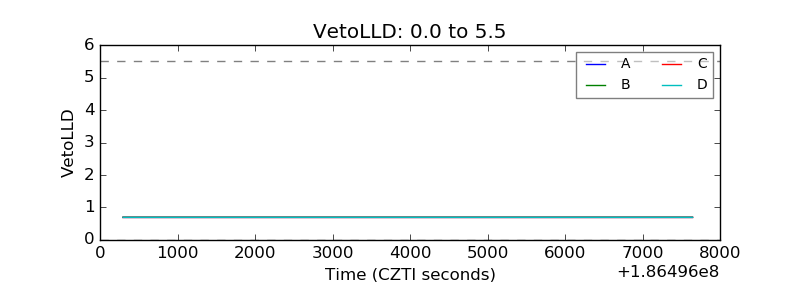 |
| Alpha Counter | 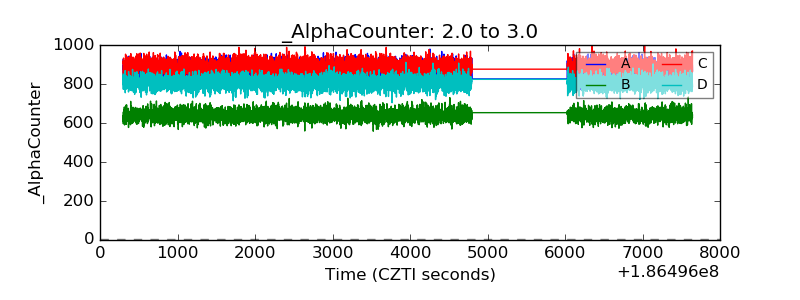 |
| _CPM_Rate | 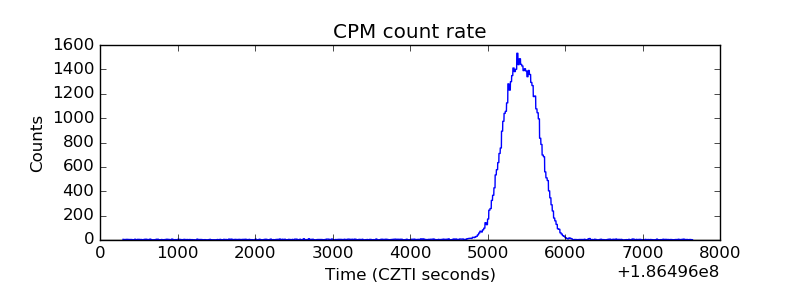 |
| CZT Counter | 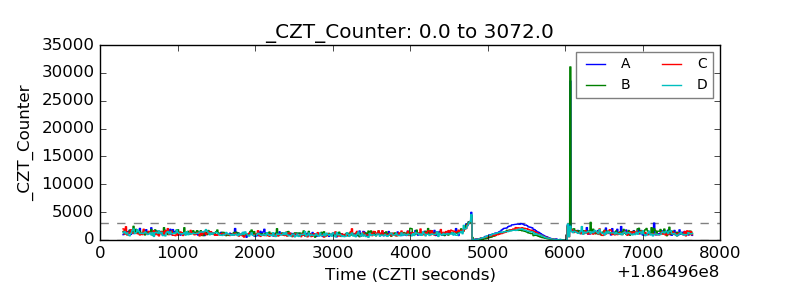 |
| +2.5 Volts monitor |  |
| +5 Volts monitor |  |
| _ROLL_ROT | 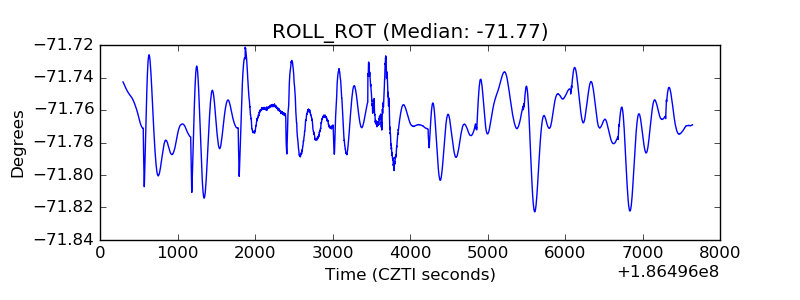 |
| _Roll_DEC | 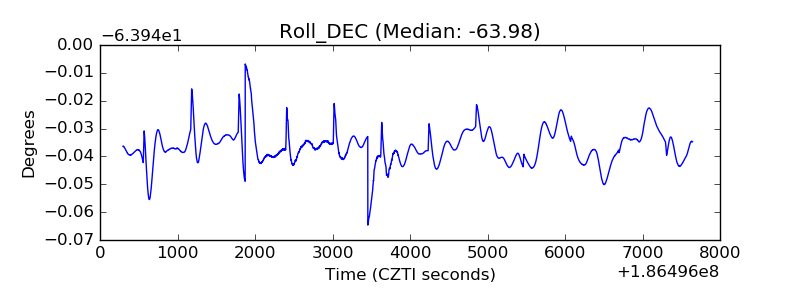 |
| _Roll_RA | 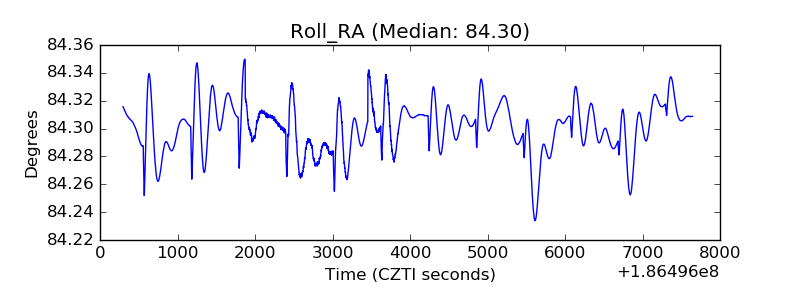 |
| Veto Counter | 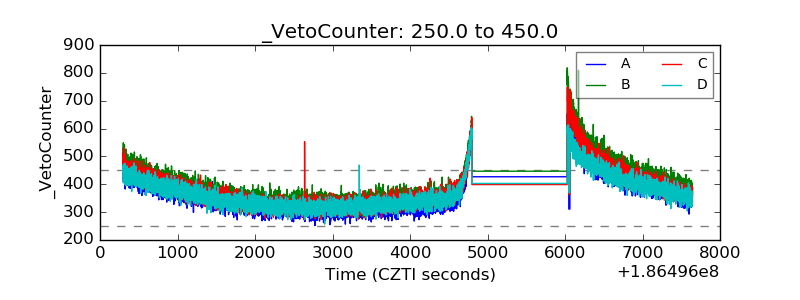 |