| Param | Original file | Final file |
|---|---|---|
| Filename | modeM0/AS1P01_163T03_9000000186_00926cztM0_level2.evt | modeM0/AS1P01_163T03_9000000186_00926cztM0_level2_quad_clean.evt |
| Size (bytes) | 1,040,820,480 | 95,526,720 |
| Size | 992.6 MB | 91.1 MB |
| Events in quadrant A | 7,515,819 | 629,140 |
| Events in quadrant B | 8,132,517 | 630,959 |
| Events in quadrant C | 7,485,300 | 611,295 |
| Events in quadrant D | 7,976,090 | 587,951 |
| Mode SS | |||
|---|---|---|---|
| Quadrant | BADHDUFLAG | Total packets | Discarded packets |
| A | 0 | 126 | 0 |
| B | 0 | 126 | 0 |
| C | 0 | 126 | 0 |
| D | 0 | 126 | 0 |
| Mode M0 | |||
|---|---|---|---|
| Quadrant | BADHDUFLAG | Total packets | Discarded packets |
| A | 0 | 26716 | 0 |
| B | 0 | 28591 | 0 |
| C | 0 | 26674 | 0 |
| D | 0 | 28123 | 0 |
| Mode M9 | |||
|---|---|---|---|
| Quadrant | BADHDUFLAG | Total packets | Discarded packets |
| A | 0 | 13 | 0 |
| B | 0 | 13 | 0 |
| C | 0 | 13 | 0 |
| D | 0 | 13 | 0 |
| Quadrant | Total seconds | Saturated seconds | Saturation percentage |
|---|---|---|---|
| A | 6215 | 69 | 1.110217% |
| B | 6215 | 89 | 1.432019% |
| C | 6214 | 63 | 1.013840% |
| D | 6214 | 291 | 4.682974% |
Noise dominated data is calculated using 1-second bins in cleaned event files. If a bin has >2000 counts, and if more than 50% of those come from <1% of pixels, then it is considered to be noise-dominated and hence unusable.
| Quadrant | # 1 sec bins | Bins with >0 counts | Bins with >2000 counts | High rate bins dominated by noise | Noise dominated (total time) | Noise dominated (detector-on time) | Marked lightcurve |
|---|---|---|---|---|---|---|---|
| A | 7480 | 6216 | 256 | 256 | 3.42% | 4.12% | 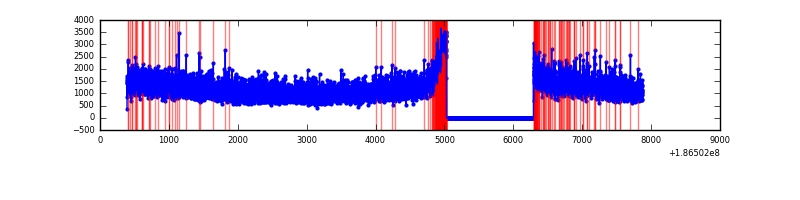 |
| B | 7480 | 6216 | 372 | 372 | 4.97% | 5.98% | 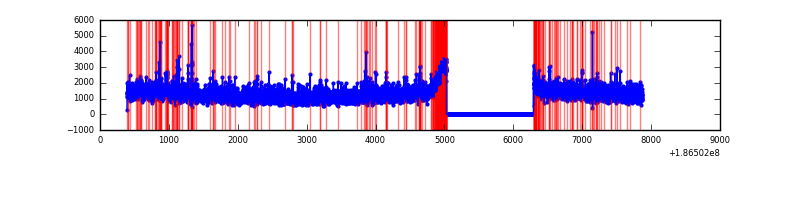 |
| C | 7479 | 6215 | 264 | 264 | 3.53% | 4.25% |  |
| D | 7479 | 6215 | 691 | 691 | 9.24% | 11.12% | 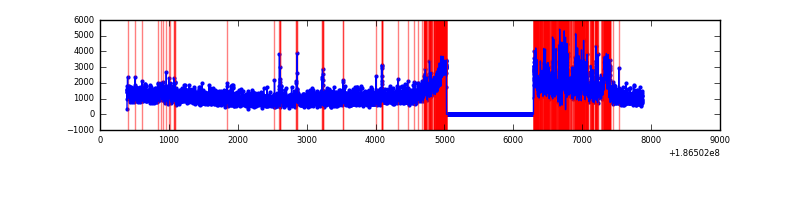 |
Top three noisy pixels from each quadrant. If the there are fewer than three noisy pixels in the level2.evt file, extra rows are filled as -1
| Pixel properties | Quadrant properties | ||||||
|---|---|---|---|---|---|---|---|
| Quadrant | DetID | PixID | Counts | Sigma | Mean | Median | Sigma |
| A | 15 | 233 | 11297 | 19.89 | 1956 | 1975 | 468.8 |
| A | 11 | 79 | 6199 | 9.01 | 1956 | 1975 | 468.8 |
| A | 3 | 111 | 6188 | 8.99 | 1956 | 1975 | 468.8 |
| B | 0 | 230 | 72351 | 146.9 | 2041 | 2050 | 478.6 |
| B | 7 | 221 | 71848 | 145.85 | 2041 | 2050 | 478.6 |
| B | 5 | 249 | 71331 | 144.77 | 2041 | 2050 | 478.6 |
| C | 15 | 241 | 227639 | 455.13 | 1803 | 1864 | 496.1 |
| C | 9 | 144 | 158459 | 315.67 | 1803 | 1864 | 496.1 |
| C | 3 | 111 | 27273 | 51.22 | 1803 | 1864 | 496.1 |
| D | 12 | 188 | 1162865 | 2192.39 | 1728 | 1788 | 529.6 |
| D | 1 | 4 | 92546 | 171.37 | 1728 | 1788 | 529.6 |
| D | 10 | 157 | 57501 | 105.2 | 1728 | 1788 | 529.6 |
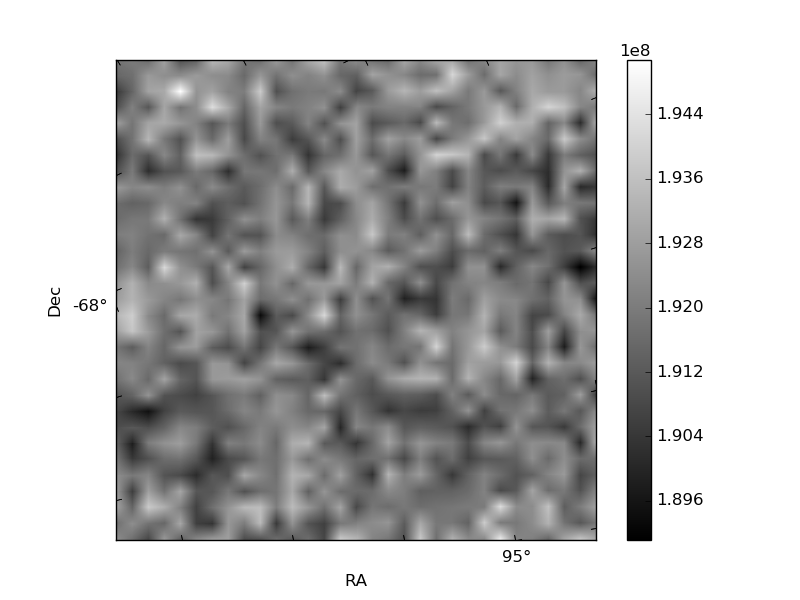
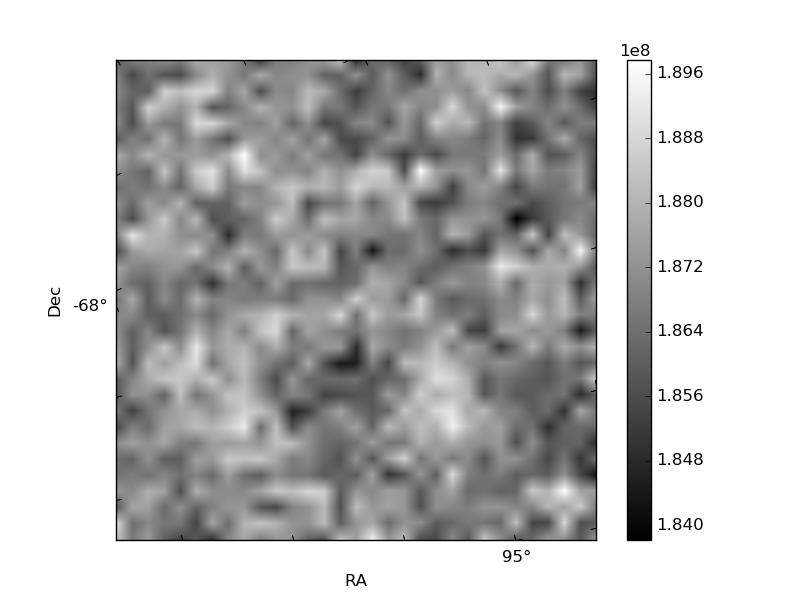
Histogram calculated using DETX and DETY for each event in the final _common_clean file
| Quadrant A | 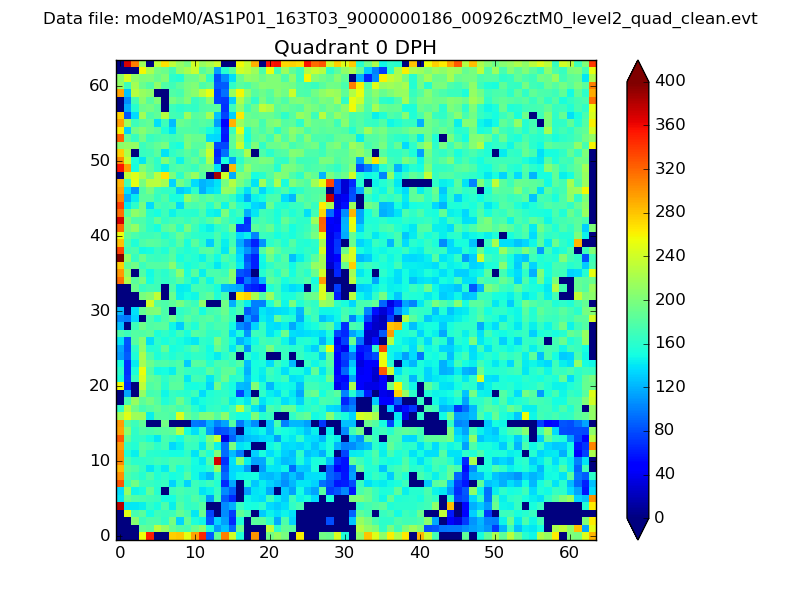 |
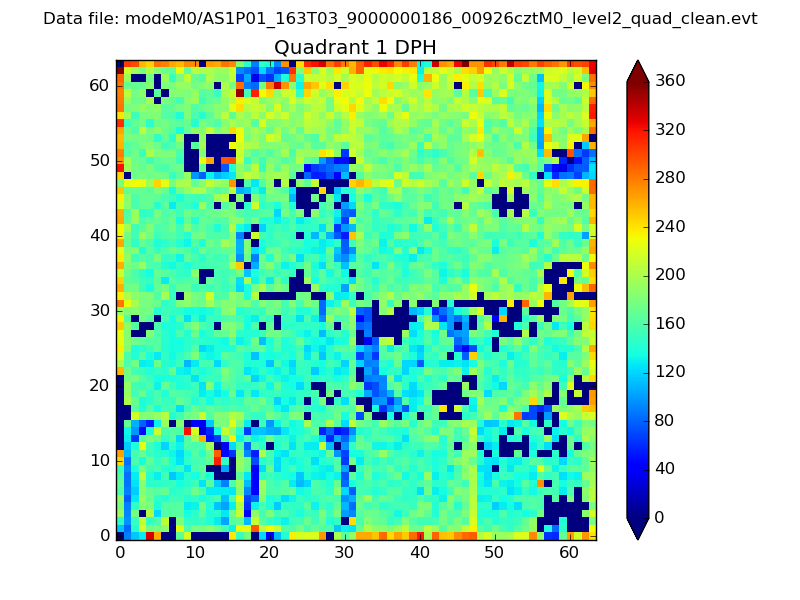 |
Quadrant B |
|---|---|---|---|
| Quadrant D |  |
 |
Quadrant C |
| Plot type | Count rate plots | Images |
|---|---|---|
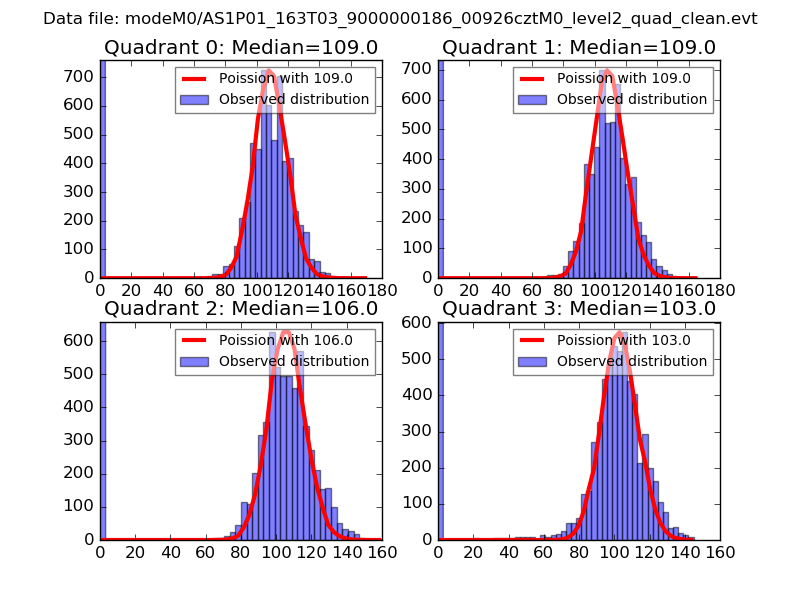
| Comparison with Poisson distribution Blue bars denote a histogram of data divided into 1 sec bins. Red curve is a Poisson curve with rate = median count rate of data. |
 |
 |
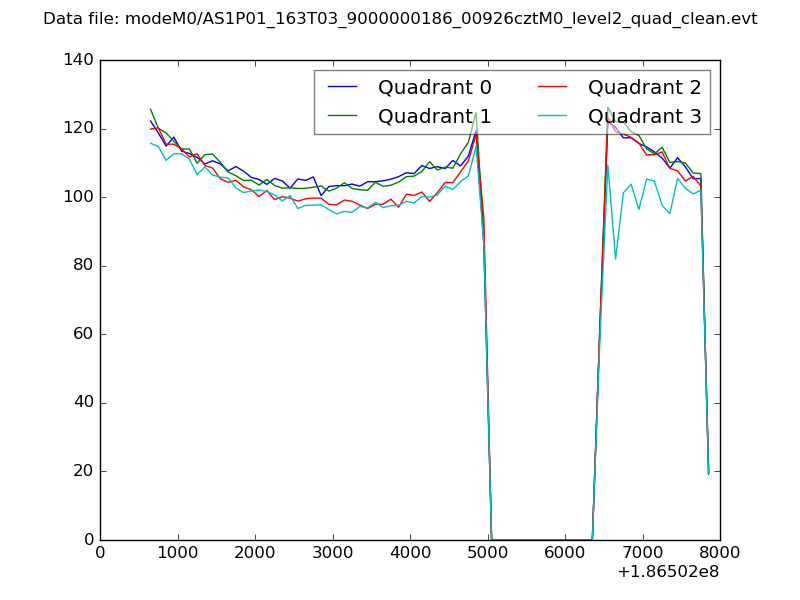
| Quadrant-wise count rates Data is divided into 100 sec bins |
 |
|
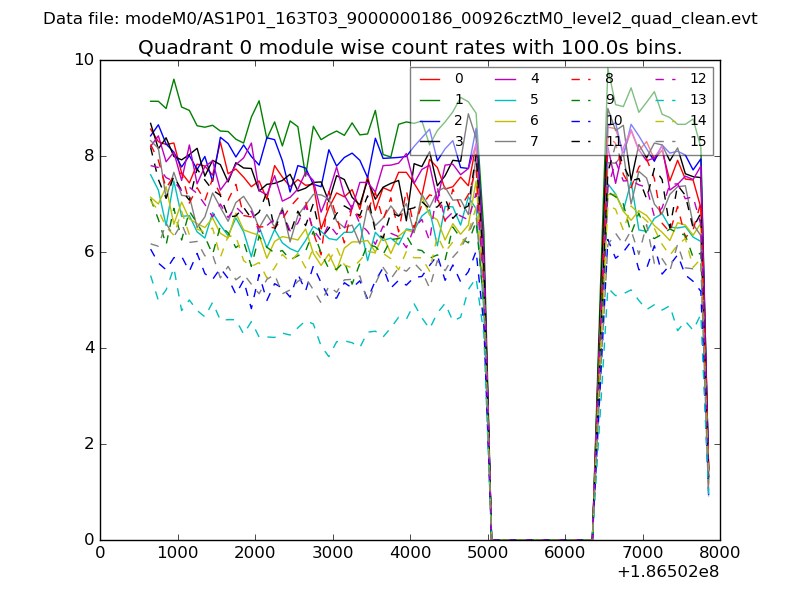
| Module-wise count rates for Quadrant A Data is divided into 100 sec bins |
 |
 |
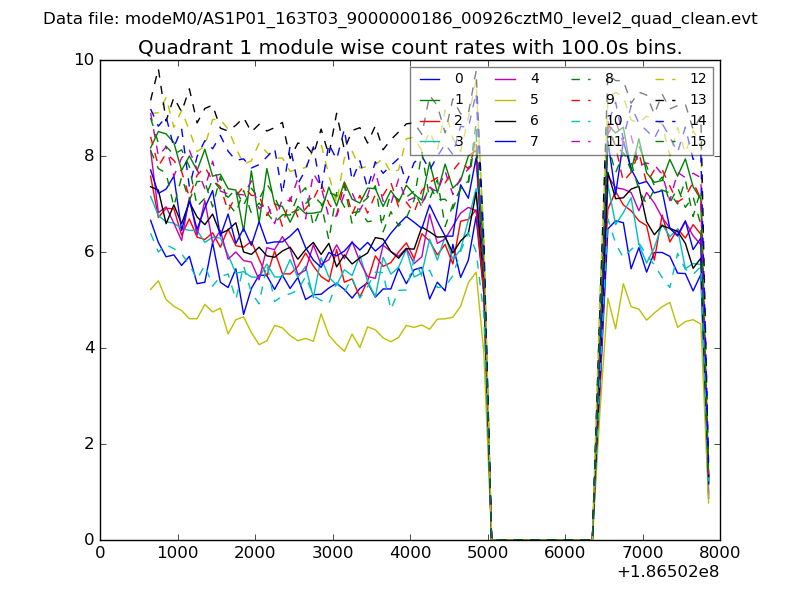
| Module-wise count rates for Quadrant B Data is divided into 100 sec bins |
 |
 |
| Module-wise count rates for Quadrant C Data is divided into 100 sec bins |
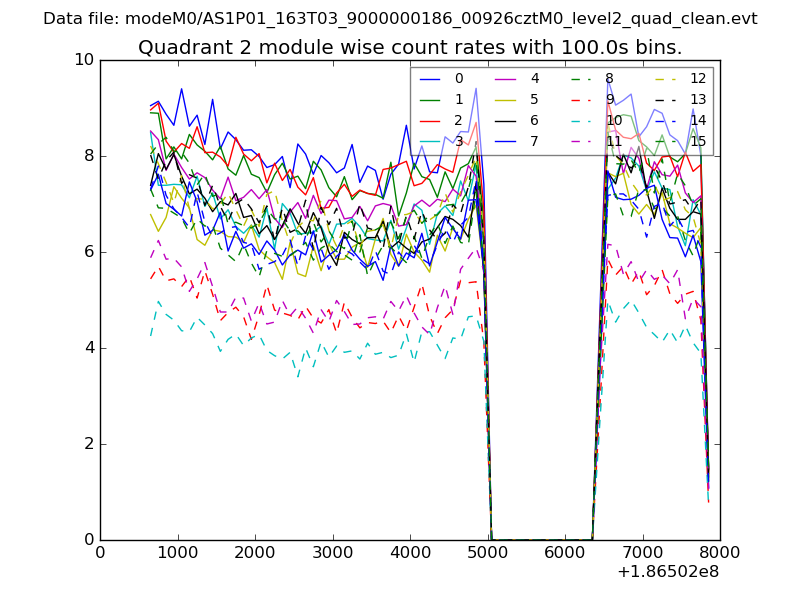 |
 |
| Module-wise count rates for Quadrant D Data is divided into 100 sec bins |
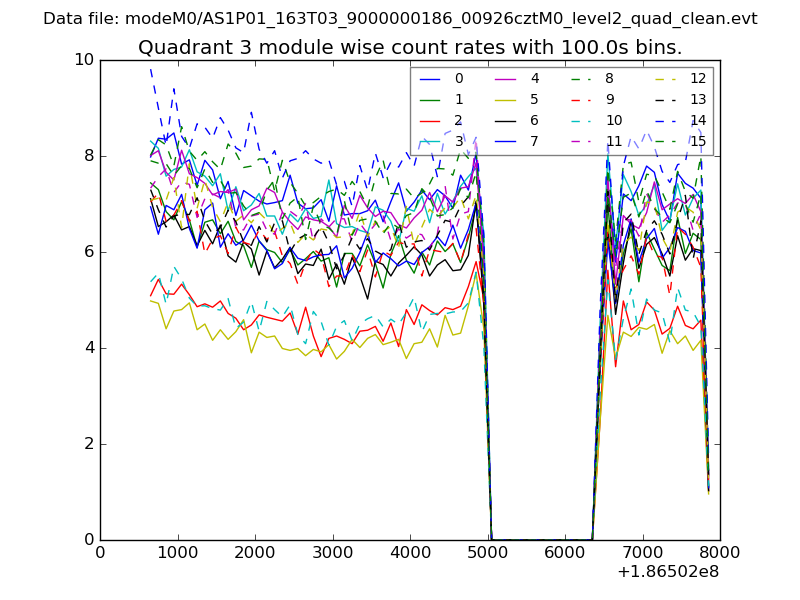 |
 |
| Parameter | Plot |
|---|---|
| CZT HV Monitor | 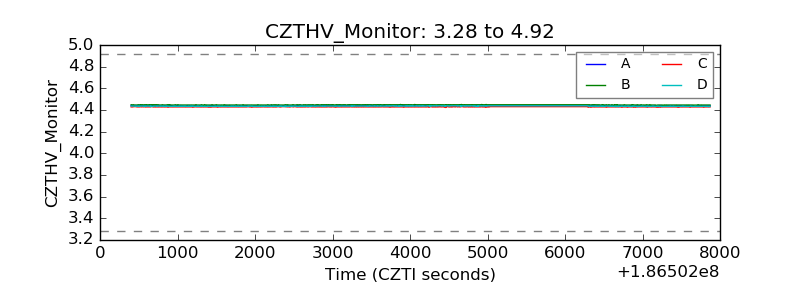 |
| D_VDD | 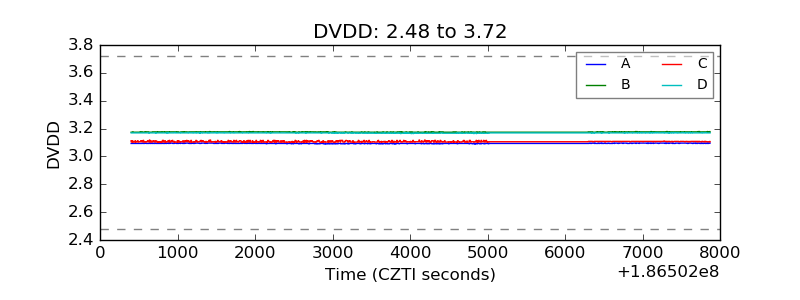 |
| Temperature 1 | 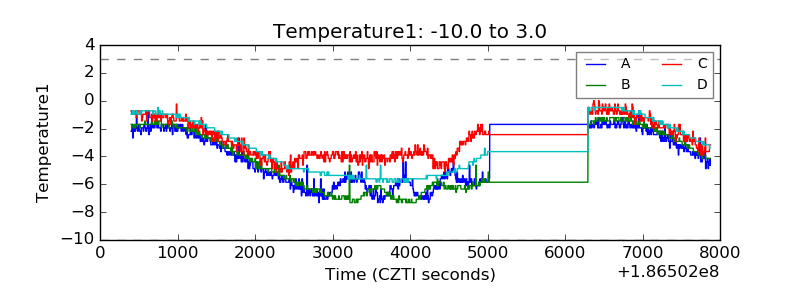 |
| Veto HV Monitor | 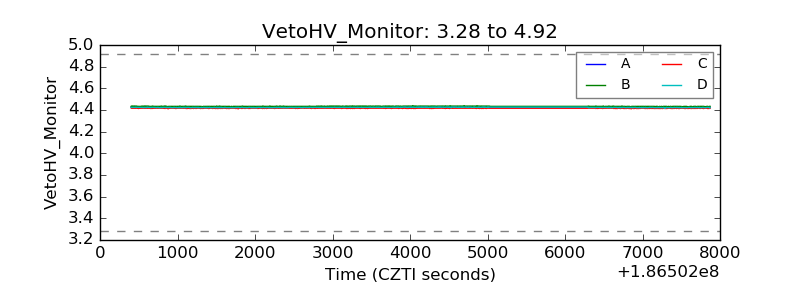 |
| Veto LLD | 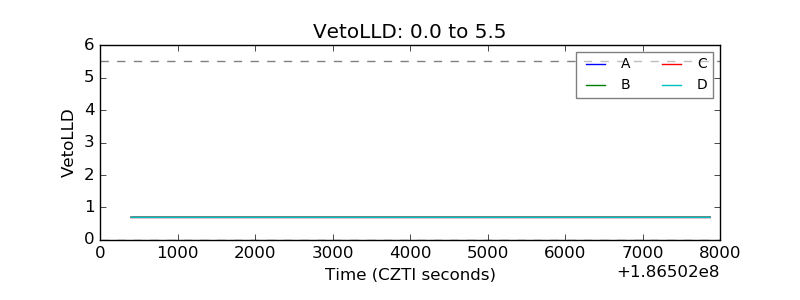 |
| Alpha Counter | 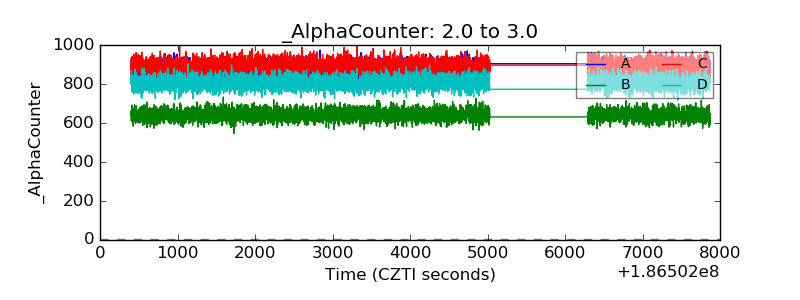 |
| _CPM_Rate | 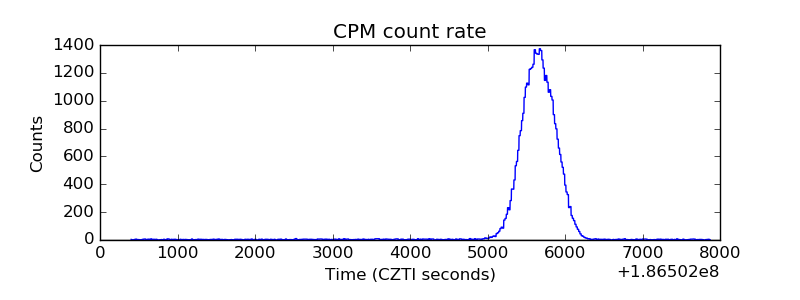 |
| CZT Counter |  |
| +2.5 Volts monitor |  |
| +5 Volts monitor |  |
| _ROLL_ROT | 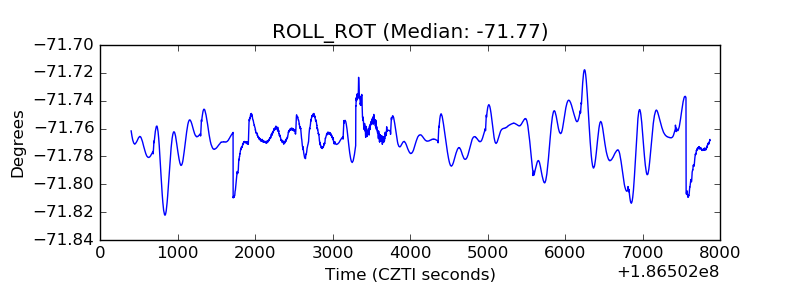 |
| _Roll_DEC | 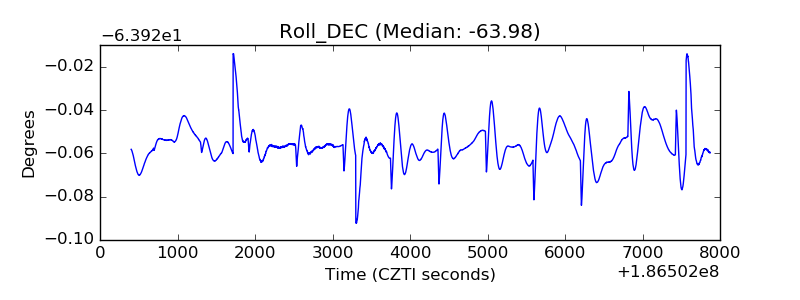 |
| _Roll_RA | 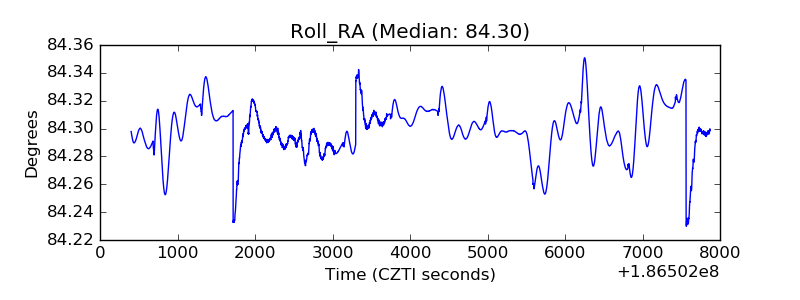 |
| Veto Counter | 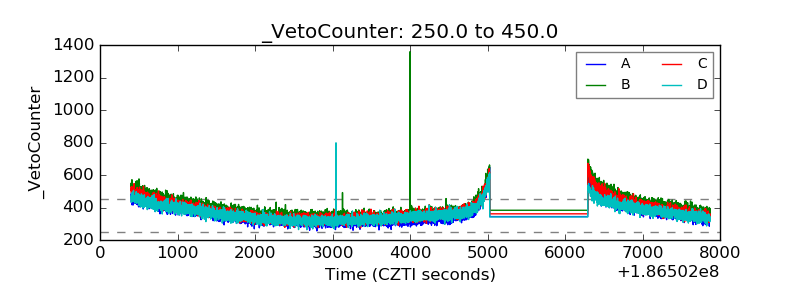 |